Cop
yright
© ABE&M t
odos os dir
eit
os r
eser
vados
.
824
original article
Arq Bras Endocrinol Metab. 2014;58/8
Thyroid volume in patients with
glucose metabolism disorders
Volume da tiroide em pacientes com alterações do metabolismo da glicose
Ayse Ocak Duran1,Cuneyd Anil2, Alptekin Gursoy3, Aslı Nar2,
Mevlude Inanc1, Oktay Bozkurt1, Neslihan Bascil Tutuncu2
ABSTRACT
Objective: Thyroid volume and the prevalence of thyroid nodules are higher in patients with insu-lin resistance. A relationship between thyroid volume and glucose metabolism disorders (GMD) has not as yet been clariied. The present retrospective study aimed to investigate the association between GMD and thyroid volume. Subjects and methods: We investigated the data of 2,630 patients who were evaluated for thyroid biopsy in our hospital. The study population included 602 patients with GMD, 554 patients with diabetes mellitus (DM) and 1,474 patients with normal
gluco-se metabolism as a control group. We obtained the levels of gluco-serum thyroid stimulating hormone (TSH) and the thyroid volumes of those patients retrospectively. Results: The median ages for the control group, GMD group and DM group were 55 (15-91) years, 60 (27-97) years, and 65 (27-91) years respectively and there was a statistically signiicant difference between the groups with regard to age and gender (p < 0.001). Levels of TSH were similar in all groups. The median total thyroid volumes for patients with DM and GMD were signiicantly higher than that of the control group [22.5 (3-202) mL, 20.2 (4-190) mL, and 19.2 (3-168) mL respectively, p ≤ 0.001 for all para-meters]. Also the median total thyroid volume for patients with DM was signiicantly higher than that of the GMD group (p < 0.001). According to the correlation analysis, thyroid volume was sig-niicantly correlated with age (r = 0.92, p < 0.001) and TSH (r = 0.435, p < 0.001). Age, gender, TSH levels, GMD and DM diagnosis were independently correlated with thyroid volume. Conclusion: The thyroid gland is one of the target tissues of metabolic disorders. We reported a positive corre-lation between GMD/type 2 DM and thyroid volume. Further controlled, prospective, randomized studies on this subject are required to gain more information. Arq Bras Endocrinol Metab. 2014;58(8):824-7
Keywords
Thyroid volume; impaired glucose metabolism; diabetes mellitus
RESUMO
Objetivo: O volume da tiroide e a prevalência de nódulos tiroidianos são mais altos em pacientes com resistência à insulina. A relação entre o volume da tiroide e os transtornos do metabolismo da glicose (TMG) ainda não foi elucidada. O objetivo do presente estudo retrospectivo foi investigar a associação entre os TMG e o volume da tiroide. Sujeitos e métodos: Analisamos os dados de 2.630 pacientes que foram avaliados para biópsia de tiroide em nosso hospital. A população estudada incluiu 602 pacientes com TMG, 554 pacientes com diabetes melito (DM) e 1.474 pacientes com me-tabolismo normal da glicose, como grupo controle. As concentrações de hormônio tireoestimulante (TSH) e os volumes da tiroide para esses pacientes foram obtidos de forma retrospectiva. Resulta-dos: As idades medianas para o grupo controle, grupo TMG e grupo DM foram 55 (15-91), 60 (27-97) e 65 (27-91) anos, respectivamente, e houve diferença estatisticamente signiicativa entre os grupos com relação à idade e ao gênero (p < 0,001). Os níveis de TSH foram similares em todos os grupos. A mediana do volume total da tiroide para pacientes com DM e TMG foi signiicativamente maior do que para os pacientes do grupo controle [22,5 (3-202) mL, 20,2 (4-190) mL, e 19,2 (3-168) mL, respecti-vamente, p ≤ 0,001 para todos os parâmetros]. Além disso, a mediana do volume total da tiroide para pacientes com DM foi signiicativamente maior do que no grupo TMG (p < 0,001). De acordo com a análise de correlação, o volume da tiroide foi signiicativamente correlacionado com a idade (r = 0,92; p < 0,001) e TSH (r = 0,435; p < 0,001). A idade, o gênero, a concentração de TSH e o diagnóstico de TMG e DM se correlacionaram com o volume da tiroide de forma independente. Conclusão: A tiroide é um dos tecidos-alvo para doenças metabólicas. Relatamos uma correlação positiva entre TMG/DM tipo 2 e o volume da tiroide. São necessários mais estudos prospectivos, randomizados e controlados sobre o assunto para se obterem mais informações. Arq Bras Endocrinol Metab. 2014;58(8):824-7
Descritores
Volume da tiroide; problemas do metabolismo da glicose; diabetes melito
1 Department of Medical Oncology,
Faculty of Medicine, Erciyes University, Kayseri, Turkey
2 Department of Endocrinology and
Metabolism, Faculty of Medicine, Baskent University, Ankara, Turkey
3Department of Endocrinology
and Metabolism, Guven Hospital, Ankara, Turkey
Correspondence to:
Ayse Ocak Duran Erciyes University, Faculty of Medicine, Department of Oncology, Kayseri, Turkey [email protected]
Received on Feb/27/2014 Accepted on July/1/2014
Cop
yright
© ABE&M t
odos os dir
eit
os r
eser
vados
.
825 Arq Bras Endocrinol Metab. 2014;58/8
INTRODUCTION
T
hyroid volume has been associated with multiple factors such as iodine deiciency and supply, body surface area (BSA), body mass index (BMI), age, gen-der, smoking and genetic factors (1,2). Impaired fasting glucose (IFG), impaired glucose tolerance (IGT), and diabetes mellitus (DM) can be mentioned among the principal disorders of the glucose metabolism in which insulin resistance (IR) acts as a signiicant factor. The morphological and pathological changes in the thyroid gland induced by glucose metabolism disorders (GMD) have already been reported (3,4). Increased thyroid vo-lumes were reported in patients with IR (3,4). Insulin resistance is associated with GMD and it is well known that, in the pathogenesis of DM, insulin resistance and compensatory hyperinsulinemia plays a pivotal role (5). Although a few studies showed an association be-tween thyroid volume and GMD, especially type 1 DM, data about the relationship between GMD and thyroid gland volume are rare (6,7). As thyroid volume is associated with IR, the relationship between thyroid volume and GMD should be investigated. We hypoth-esized that increased in thyroid volume was associated with GMD (IFG, IGT and DM).SUBJECTS AND METHODS
The study design is cross-sectional with retrospective data. We examined the iles of 4,500 patients who were admitted or referred by other policlinics to the endocri-nology policlinic for thyroid examination between June 2003 – January 2009 and 2,630 patients aged between 15-97 years were included after considering the exclu-sion and incluexclu-sion criteria. The age, gender, and blood glucose characteristics of the patients were noted. Thy-roid function was evaluated by measuring thyThy-roid stim-ulating hormone (TSH) using immunochemilumines-cent assays by an automated analyzer (Immulite 2000; Diagnostic Products, Los Angeles, CA, USA). Serum glucose was measured by the glucose oxidase technique (Roche Diagnostics, Mannheim, Germany). The refer-ences ranges for serum TSH were 0,35-4,94 (mIU/L).
Glucose metabolism disorders were evaluated ac-cording to the American Diabetes Association (ADA) 2009 criteria (5). The categories of fasting plasma glu-cose (FPG) values are as follows: FPG < 100 mg/dL normal fasting glucose; FPG 100-125 mg/dL IFG and FPG ≥ 126 mg/dL provisional diagnosis of diabetes. The corresponding categories when the oral glucose
tolerance test (OGTT) is used are the following: 2-h postload glucose < 140 mg/dL normal glucose tol-erance; 2-h postload glucose 140-199 mg/dL IGT 0 and 2-h postload glucose ≥ 200 mg/dL provisional diagnosis of diabetes. The patients were classifed into groups as follows: patients with normal fasting glucose, patients with GMD (IFG and IGT) and patients with DM according to the fasting blood glucose and OGTT. Thyroid size was estimated by ultrasonography us-ing a 10-MHz linear probe (Logiq 5 Pro, GE).
Medical Systems, WI, USA). The volumes of the thyroid glands and nodules were calculated according to the ellipsoid formula: volume (mL) = depth (cm) × width (cm) × length (cm) × π/6. Nodules were deined as solitary lesions distorting the uniform shape or echo pattern of the thyroid gland with a diameter of at least 1 cm. The volume of nodules was not considered to-gether with thyroid volumes.
Exclusion criteria were as follows: a history of neck irradiation, operation or ine-needle aspiration biopsy (FNAB), a history of thyroid disease, overt or subclini-cal hypothyroidism and previous-thyroxine suppression therapy at any time.
Statistical analysis of the acquired data was carried out with the SPSS 16.0 (SSPS Inc, Chicago, USA) for Win-dows package program. As descriptive statistics, numeri-cal values and percentiles were used for numeric data. The compliance of numerical values to normal distribu-tion was evaluated with the One-Sample Kolmogorov-Smirnov test. Since numerical values did not have a normal distribution, median and minimum-maximum values were employed and non-parametric tests were used. Spearman correlation analysis was used to verify the correlation between numerical variables. Intergroup comparisons for categorical values were performed with the Chi-Square test. Comparisons of non-parametric values among groups were performed by Kruskal Wal-lis test and the Bonferroni adjustment Mann-Whitney U-test (for non-parametric variables) was used as a post hoc test for multiple comparisons between the groups. In all evaluations, results with p < 0.05 within a coni-dence interval of 95% were deemed as statistically signii-cant. Multiple linear regression analysis was used for the assessment of independent predictors of thyroid volume.
RESULTS
The study population included a total of 2,630 pa-tients, 602 patients with GMD, 554 patients with DM
Cop
yright
© ABE&M t
odos os dir
eit
os r
eser
vados
.
826 Arq Bras Endocrinol Metab. 2014;58/8
and 1,474 patients with normal glucose metabolism as a control group. Two thousand and seventy-six (78.9%) patients were female and 554 (21.1%) patients were male. The number of male patients in the control group, GMD group and DM group were 261 (17.7%), 129 (21.4%) and 164 (29.6%) respectively. There was a signiicant difference between all groups according to gender (Table 1). The median ages for the control group, GMD group and DM group were 55 (15-91) years, 60 (27-97) years, and 65 (27-91) years respec-tively and there was a statistically signiicant difference between the groups with regard to age and gender (p < 0.001, Table 1). TSH levels were similar in all groups [for control patients: 0.9 (0.1-28) (mIU/L), for GMD group: 1 (0.1-15) (mIU/L) and for DM group: 0.9 (0.1-28) (mIU/L) (p > 0.05, Table 1)]. The median total thyroid volumes for the patients with DM and GMD were signiicantly higher than that of the control group [22.5 (3-202) mL, 20.2 (4-190) mL, and 19.2 (3-168) mL respectively, p ≤ 0.001 for all parameters]. Also the median total thyroid volumes for patients with DM was signiicantly higher than that of the GMD group (p < 0.001, Table 1). According to the correlation analysis, thyroid volume was correlated with age (r = 0.92, p < 0.001) and TSH (r = 0.435, p < 0.001). The maximum nodule diameters of patients with DM and GMd were signiicantly higher than that of the control group (p < 0.001, Table 1). The maxi-mum nodule diameter was similar in the patients with GMD and DM. Age, gender, TSH levels and GMD and DM diagnosis were independently correlated with thyroid volume (Table 2).
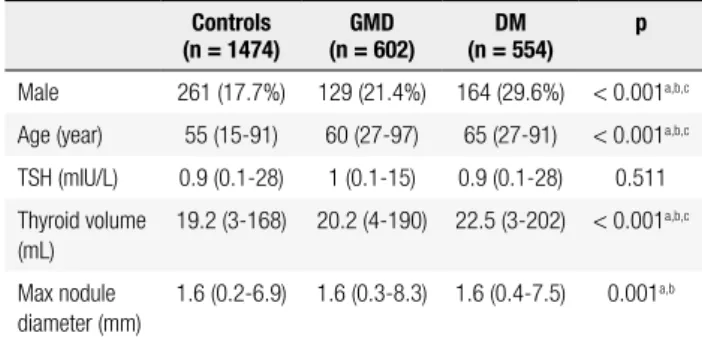
Table 1. Clinical, laboratory and thyroid ultrasonography properties of patients
Controls (n = 1474)
GMD (n = 602)
DM (n = 554)
p
Male 261 (17.7%) 129 (21.4%) 164 (29.6%) < 0.001a,b,c
Age (year) 55 (15-91) 60 (27-97) 65 (27-91) < 0.001a,b,c
TSH (mIU/L) 0.9 (0.1-28) 1 (0.1-15) 0.9 (0.1-28) 0.511
Thyroid volume (mL)
19.2 (3-168) 20.2 (4-190) 22.5 (3-202) < 0.001a,b,c
Max nodule diameter (mm)
1.6 (0.2-6.9) 1.6 (0.3-8.3) 1.6 (0.4-7.5) 0.001a,b
(Data are given as median and minimum-maximum levels as appropriate). GMD: glucose
metabolism disorders; DM: type 2 diabetes mellitus; TSH: thyroid stimulating hormone.
a: signiicant difference between controls and patients with GMD, b: signiicant difference between controls and patients with type 2 DM, c: signiicant difference between patients with GMD and type 2 DM (One-Way ANOVA and Bonferroni test for comparision of non parametric variables and Chi-Square test for comparisons of categorical values).
Table 2. Multiple linear regression analysis for the assessment of independent predictors of thyroid volume
Thyroid volume
Beta t p
Age (year) 0.07 2.8 0.005
Gender (male) 0.232 9.1 < 0.001
TSH (mIU/L) 0.19 7.9 < 0.001
GMD vs. control 0.03 2.2 0.027
DM vs. control 0.05 2.8 0.004
TSH: thyroid stimulating hormone; GMD: glucose metabolism disorders; DM: type 2 diabetes
mellitus.
DISCUSSION
The main result of our study was total thyroid volumes for patients with DM and GMD were signiicantly higher than that of the control group. GMD and thy-roid disorders occur in the common endocrine diseases of the adult population. It is well known that, in the pathogenesis of DM, insulin resistance and compensa-tory hyperinsulinemia play a pivotal role (5,8).
Until now, only a few studies have investigated an association between thyroid volume and GMD. Rez-zonico and cols. showed a positive association between IR and thyroid volume (4). Junik and cols. reported that the median thyroid volumes in patients with type 1 and type 2 DM (in only 30 and 98 patients respec-tively) were signiicantly higher than the control group (6). They also reported that TSH levels did not dif-fer between type 2 DM and control cases; they were signiicantly lower than the controls in type 1 DM pa-tients. Anil and cols. showed that patients with pre-di-abetes and type 2 DM had larger thyroid volumes and higher risk for formation of thyroid nodules than the control group (9). They also reported that the serum TSH level was higher in patients with type 2 DM than in patients with pre-diabetes and in controls. In anoth-er study, the authors demonstated that type 1 DM pa-tients (65 type 1 papa-tients and 65 control papa-tients) had larger thyroid volumes compared with healthy controls with similar anthropometry (10). In these studies, the investigators speculated that thyroid autoimmunity and lower iodine ingestion have an important effect on the thyroid volume.
In the current retrospective study, we determined a signiicant correlation between GMD/type 2 DM and elevated thyroid volume among patients who were re-ferred for thyroid biopsy. Our study population con-sisted of 602 patients with GMD and 554 patients with
Cop
yright
© ABE&M t
odos os dir
eit
os r
eser
vados
.
827 Arq Bras Endocrinol Metab. 2014;58/8
DM, which is relatively large according to the studies mentioned above. Unlike those studies we did not ind a relationship between serum TSH levels and the presence of GMD/type 2 DM (Table 1). Serum TSH levels were correlated with thyroid volume (r = 0.435, p < 0.001).
Progression of the thyroid cell cycle is dependent on joint activity of TSH and insulin/insulin-like growth tor-1 (IGF-1), all of which function as co-mitogenic fac-tors (11). The main regulator of growth and differentia-tion of thyroid cells is TSH (12). Therefore, serum TSH levels should be evaluated in the initial evaluation of a patient with a high thyroid volume. We found a signii-cant association between serum TSH levels and thyroid volume which is in accordance with studies done so far.
The most important effects of GMD leading to el-evated risk are hyperinsulinemia, IR, and hyperglyce-mia that can exist for years before and after diagnosis. Elevated insulin levels due to IR lead to an increase in IGF-1 levels (which is an important hypertrophic and progression factor for a series of cell types including thyroid cells). Experimental evidence showed that both insulin and IGF-1 modulated the regulation of thyroid gene expression and elevated insulin and/or glucose levels may lead to proliferation of thyroid cells by af-fecting cellular energy metabolism (13,14).
Insulin also raises the mitogenic activity of growth fac-tors (11). Although the proliferative properties of insulin and IGF-1 are known, the impact of these parameters on the total thyroid volume is unclear. We hypothesized that higher circulating levels of glucose, insulin and IGF-1 in the case of abnormal glucose metabolism may cause in-creased thyroid proliferation and thyroid volume.
he most important limitation of our study was its ret-rospective design. Several risk factors are inluential both in diabetes and thyroid volume such as TSH, body weight, physical activity, alcohol use, nutrition style, and BMI. Be-cause of the design of our study, we could not evaluate all these parameters. Our study was based on data acquired from a single center.
In conclusion, we reported a positive correlation be-tween GMD/type 2 DM and thyroid volume. Further controlled, prospective, randomized studies on this sub-ject are required to gain more information. In a recently published systematic review, the authors reported that in-dividuals with diabetes showed a borderline statistically signiicant increased risk of thyroid cancer compared with
those without diabetes (15). According to our results, high thyroid volumes in patients with GMD and DM may be related with increased risk of malignancy in these patients.
Disclosure: all the authors (Ayse Ocak Duran, Cuneyd Anil, Alp-tekin Gursoy, Aslı Nar, MD, Mevlude Inanc, Oktay Bozkurt, Nes-lihan Bascil Tutuncu) declare the absence of any conlict of interest and that each contributed to the preparation of the manuscript submitted. All the authors accepted responsibility for the article.
REFERENCES
1. Gharib H, Papini E. Thyroid nodules: clinical importance, as-sessment, and treatment. Endocrinol Metab Clin North Am. 2007;36:707-35.
2. Zou Y, Ding G, Lou X, Zhu W, Mao G, Zhou J, et al. Factors in-luencing thyroid volume in Chinese children. Eur J Clin Nutr. 2013;67(11):1138-41.
3. Ayturk S, Gursoy A, Kut A, Anil C, Nar A, Tutuncu NB. Metabolic syndrome and its components are associated with increased thy-roid volume and nodule prevalence in a mild-to-moderate iodine-deicient area. Eur J Endocrinol. 2009;161:599-605.
4. Rezzonico J, Rezzonico M, Pusiol E, Pitoia F, Niepomniszcze H. Introducing the thyroid gland as another victim of the insulin re-sistance syndrome. Thyroid. 2008;18:461-4.
5. American Diabetes Association, Diagnosis and classiication of diabetes mellitus. Diabetes Care. 2008;31:S55-60.
6. Junik R, Kozinski M, Debska-Kozinska K. Thyroid ultrasound in diabetic patients without overt thyroid disease. Acta Radiol. 2006;47:687-91.
7. Pimenta WP, Mazeto GM, Callegaro CF, Shibata SA, Marins LV, Ya-mashita S, et al. Thyroid disorders in diabetic patients. Arq Bras Endocrinol Metabol. 2005;49:234-40.
8. American Diabetes Association. Diagnosis and classiication of diabetes mellitus. Diabetes Care. 2010;33 Suppl 1:S62-9. 9. Anil C, Akkurt A, Ayturk S, Kut A, Gursoy A. Impaired glucose
me-tabolism is a risk factor for increased thyroid volume and nodule prevalence in a mild-to-moderate iodine deicient area. Metabo-lism. 2013;62(7):970-5.
10. Gómez JM, Maravall FJ, Gumà A, Abós R, Soler J, Fernández-Castañer M. Thyroid volume as measured by ultrasonography in patients with type 1 diabetes mellitus without thyroid dysfunc-tion. Horm Metab Res. 2003;35(8):486-91.
11. Rapp K, Schroeder J, Klenk J, Ulmer H, Concin H, Diem G, et al. Fasting blood glucose and cancer risk in a cohort of more than 140,000 adults in Austria. Diabetologia. 2006;49:945-52.
12. Rapoport B, Chazenbalk GD, Jaume JC, McLachlan SM. The thy-rotropin (TSH) receptor: interaction with TSH and autoantibodies. Endocr Rev. 1998;19:673-716.
13. Inoue M, Iwasaki M, Otani T, Sasazuki S, Noda M, Tsugane S. Diabetes mellitus and the risk of cancer: results from a large-scale population-based cohort study in Japan. Arch Intern Med. 2006;166:1871-7.
14. Riedemann J, Macaulay VM. IGF1R signalling and its inhibition. Endocr Relat Cancer. 2006;13(Suppl 1):S33-43.
15. Schmid D, Behrens G, Jochem C, Keimling M, Leitzmann M. Phys-ical activity, diabetes, and risk of thyroid cancer: a systematic re-view and meta-analysis. Eur J Epidemiol. 2013;28(12):945-58.