The use of social indicators to implement
the health surveillance model
**Extracted from the thesis “Análise da utilização de indicadores sociais na operacionalização do modelo de Vigilância da Saúde: um estudo de caso”, School of Nursing, University of São Paulo, 2007. 1 Nurse. Student of the Masters program in Collective Health Nursing. Professor of the Centro Universitário São Camilo.
São Paulo, SP, Brazil. [email protected] 2 Nurse. PhD. Professor of the Collective Health Department at School of Nursing, University of São Paulo.
São Paulo, SP, Brazil. [email protected]
O
RIGINAL
A
R
TICLE
A UTILIZAÇÃO DE INDICADORES SOCIAIS NA OPERACIONALIZAÇÃO DO MODELO DE VIGILÂNCIA DA SAÚDE
LA UTILIZACIÓN DE INDICADORES SOCIALES EN LA OPERACIONALIZACIÓN DEL MODELO DE VIGILANCIA DE LA SALUD
RESUMO
Este estudo objetivou caracterizar a área de abrangência da subprefeitura do Butantã a partir dos indicadores compostos que repre-sentam as categorias autonomia, qualidade de vida, desenvolvimento humano e eqüida-de; e discutir a adequação da utilização des-sas categorias para a operacionalização da vigilância da saúde nesse território. Trata-se de um estudo exploratório e descritivo, com abordagem quantitativa, cujos dados foram obtidos por meio de identificação de ban-cos de dados de domínio público, com in-formações relativas a indicadores sociais e de saúde, bem como os índices de exclusão/ inclusão social utilizados para a construção das categorias autonomia, qualidade de vida, desenvolvimento humano e eqüidade. Os resultados apontam que os indicadores compostos permitiram revelar as desigual-dades nas condições de vida e saúde presen-tes no território. Os distritos de Raposo Ta-vares e Rio Pequeno apresentam os piores índices de exclusão/inclusão social na sub-prefeitura do Butantã, configurando-se como os distritos que mais apresentam ex-clusão social.
DESCRITORES Vigilância da população. Indicadores sociais.
Diagnóstico da situação em saúde. Iniqüidade social.
Rosemara Melchior Valdevino Silva1, Lislaine Aparecida Fracolli2
ABSTRACT
The purpose of this study was to character-ize the coverage area of the Butantã sub-district, based on compound indicators that represent the categories autonomy, qual-ity of life, human development and eququal-ity; and discuss the adequacy of using said cat-egories to execute Health Surveillance in this territory. This is a descriptive, explor-atory study, with a quantitative approach, with data obtained through identification of public domain data banks with informa-tion about health and social indicators, as well as the indexes of social inclusion/ex-clusion used to build the categories au-tonomy, quality of life, human development and equity. The results show that the com-pound indicators allowed for the unveiling of the inequalities in health and life condi-tions in the territory. The Raposo Tavares and Rio Pequeno districts showed the worst indexes of social inclusion/exclusion in the Butantã sub-prefecture, configured as the districts with the highest social exclusion.
KEY WORDS Population surveillance. Social indicators.
Diagnosis of health situation. Social inequity.
RESUMEN
Este estudio tuvo como objetivo caracteri-zar el área de influencia de la municipalidad de Butanta, a partir de indicadores compues-tos que representan las categorías autono-mía, calidad de vida, desarrollo humano y equidad; y discutir la adecuación de la utili-zación de esas categorías para la operacio-nalización de la vigilancia de la salud en ese territorio. Se trata de un estudio explorato-rio y descriptivo, con abordaje cuantitativo, cuyos datos fueron obtenidos por medio de la identificación en bancos de datos de do-minio público, con informaciones relativas a indicadores sociales y de salud, así como los índices de exclusión/inclusión social utiliza-dos para la construcción de las categorías autonomía, calidad de vida, desarrollo hu-mano y equidad. Los resultados apuntan que los indicadores compuestos permitieron re-velar las desigualdades en las condiciones de vida y salud presentes en el territorio. Los distritos de Raposo Tavares y Río Pequeno presentan los peores índices de exclusión/ inclusión social en la municipalidad de Butanta, configurándose como los distritos que más presentan exclusión social.
DESCRIPTORES Vigilancia de la población. Indicadores sociales.
162
Rev Esc Enferm USP 2009; 43(1):161-9 www.ee.usp.br/reeusp/The use of social indicators to implement the health surveillance model
Silva RMV, Fracolli LA
INTRODUCTION
The conception of the health-disease process has in-creased considerably, from more connections with death and disease (negative approach) to conceptions linked to the quality of life of a given population, a social product (positive approach). Health is then understood […] as the expression of quality of life, resulting […] in the state of health and its consequences, based on its actions on the determinants(1).
The theory of social production postulates that, except for untouched nature, everything that exists is a product of human action on society. This theory supports the concept of situation, in which a social actor, such as the rational man, retrieves the totality of reality, aiming at overcoming the restrictive concept of economic production, incorpora-tion other producincorpora-tions as well: political, organizaincorpora-tional, cognitive, ideological, and cultural, among others, as social productions.
A society will always have a health reserve, expressed in a state of health,
[…] which could accumulate or deplete itself according to the social game. This state of health is an instant in the health/disease process, and therefore is in permanent mutation, improving or deteriorating, in its different mo-ments, according to their reproductive dynamics and ac-cording to the positive or negative determinations for health(1).
Therefore, a society can either accumulate health, im-proving the state of health, or deplete health, producing diseases socially.
Health understood as a social product implies in the social construction of new health practices, named health surveillance, whose concept is an organized form of social response to health problems, having the positive concept of health and the social paradigm of the social production of health as its references. It will organize the healthcare work processes in view of inter-sectorial operations, articu-lated by different intervention strategies(1).
Health surveillance practices should be focused on in-ter-sectoriality, […] based on the articulation of government actions on concrete problems and concrete people, identi-fied in concrete territories and transformed into political demands. Therefore, health surveillance, in harmony with a positive conception of health, is presented as the sani-tary practice of a new paradigm, the social production of health(1).
The proposal of health surveillance in Brazil originated with the sanitary reform processes of the 1970s and the ideals that promoted the implementation of the Single Healthcare System – Sistema Único de Saúde (SUS) in the 1980s. This brought new forms of interpreting health, aim-ing to transcend multi-causality and promote articulation
between the health-disease process and its determiners and conditioners, attempting to comprehend health-disease as a process determined by the processes of social produc-tion and reproducproduc-tion(2). It started due to the need to
in-crease epidemiologic surveillance actions, in the sense of contemplating health problems and the conditions of life in all of their dimensions(3).
Health surveillance, increasing the methods of tradi-tional epidemiologic surveillance, takes considerable dis-tance when it links the control of risks and aggravations to regionalized and democratized processes of priority defini-tion and intervendefini-tion and monitoring strategies. Also, the same happens when it incorporates surveillance objectives that are broader than the traditional aggravations of obliga-tory notification, such as issues regarding nutrition, envi-ronmental health, mental health, relations between health and labor, violence, among others(4).
Health surveillance corresponds to
a healthcare model that incorporates and overcomes the current models, implying in the redefinition of the object, the means of work, the activities, the social and technical relations […](5)
synthetically presenting seven characteristics:
a) intervention in health problems (damages, risk and/or determiners); b) emphasis on problems requiring continu-ous attention and monitoring; c) operationalization of the concept of risk; d) articulation between promotional, preven-tive and curapreven-tive actions; e) intersectorial work; f) actions across territory; g) intervention, in the form of operations(5).
In the health surveillance proposal, territory is an im-portant key concept, and its conception goes beyond out-lining a geographic space, as it is a setting where the rela-tions of life and work of a given population occur. As such, demographic, socioeconomic, political-cultural, epidemio-logical and sanitary information is needed about a given territory, which will permit identifying and analyzing the problems, the epidemiological profiles and the health ne-cessities of the population groups in order to define the healthcare priorities with inter-sectoriality, integrality and equity in mind(6).
There is a consensus that the techniques available to monitor the health situation and conditions of life are con-sidered insufficient – reasons why the need to enhance them with the development of new techniques and strate-gies of information collection is discussed. These will per-mit usage by local healthcare systems.
Traditionally used health indicators do not reflect the health situation of a given population clearly.
inequali-ties and inequiinequali-ties in the health-disease process or to build surveillance systems that allow for decision-making in the scope of the Healthcare Policies(8).
Nowadays, concerns are related to the conceptual and methodological improvement of more specific instruments to quantify and qualify the conditions of life and health and other dimensions of the social reality. Therefore, a var-ied portfolio of social indicators can be built, greatly con-tributing to unveil historical inequities in Brazil(9).
The choice of consensus indicators to measure prob-lems and evaluate results is shown to be an adequate form to involve social actors in studies and projects intended to influence public policy making(10).
The utilization of compound indicators could yield a chart of the conditions of life of certain social groups, and serve as a starting point to analyze the health situation of these groups, with the consequent description of the epi-demiologic profiles.
Compound indicators are also named synthetic indica-tors or social indexes. They are built with the agglutination of two or more single indicators, referring either to the same or to different dimensions of the social reality. The HDI – human development index – is an example of compound indicator or social index, elaborated according to the combi-nation of simpler indicators related to the areas of health, education and income. The formulation of compound indi-cators is usually chosen by their synthesizing capacity in situ-ations where a general evaluation of the conditions of life or socioeconomic levels of different social groups is necessary(9).
The utilization of compound indicators would permit evi-dencing social inequities existing in the city of São Paulo(11).
The choice of the compound indicators that are part of the Map of Exclusion/Inclusion(11) aimed to disclose the
social inequalities existing in the administrative districts of the Butantã subprefecture.
The Map of Social Exclusion/Inclusion permits verifying the social reality of the territories in a region, establishing a comparative relation between a part and the whole, and examining the presence of social exclusion/inclusion. The map represents a methodology of geo-referenced analysis for the territories of a city by means of variables that mea-sure the level of human development, equity, quality of life and autonomy. It produces knowledge about the place of the data and builds compound indexes of social exclu-sion/inclusion (IEX), symbolized by negative and positive decimal scores. With these scores, the districts were ranked according to the negative or positive distancing from the inclusion standard. This measurement compares the dis-tance that the city builds between the best and worst con-ditions of life. In the case of the city of São Paulo, these indexes were produced for all 96 districts(11).
The compound social exclusion/inclusion index was built from the following categories (11):
1. Category – Autonomy: comprising the variables fam-ily income, employability and situation of indigence.
2. Category – Quality of life: comprising the variables number of people per household, availability of daycare institutions for children aged 0-3 years old, availability of kindergarten schools for children aged 4-6, availability of elementary schools for children aged 7-14.
3. Category – Human development: comprising the variables level of instruction of family heads, district lon-gevity rate and potentially lost years of life and homicides
4. Category – Equity: comprising the variable families headed by women.
The operationalization of the health surveillance pro-posal, understood as an inter-sectorial healthcare model, could occur with the use of social indicators, put in prac-tice by means of the following categories: autonomy, qual-ity of life, human development and eququal-ity. These indica-tors would provide knowledge about the reality of life of the social groups, providing the healthcare teams with in-struments for healthcare surveillance(2).
These indicators would permit an approximation with the profile of social reproduction of the different social groups or the different districts, which would result in the construction of the epidemiologic profile. Thus, these indi-cators could help in the discrimination of the most vulner-able social groups.
This research is expected to contribute to the implanta-tion process of the healthcare surveillance model in the districts of the Butantã subprefecture, particularly aiming to identify indicators to provide the healthcare teams with instruments to apprehend social inequalities that, at least, determine the health-disease profiles of the population in this territory.
OBJECTIVES
•
Characterize the coverage of the Butantã subprefec-ture with the utilization of compound indicators represent-ing the categories autonomy, quality of life, human devel-opment and equity.• Discussing the adequacy of the categories
autonomy, quality of life, human development and equity for the operationalization of health surveillance.METHOD
This is a quantitative, exploratory and descriptive study. It sought to analyze the adequacy of the categories au-tonomy, quality of life, human development and equity for the practice of health surveillance.
164
Rev Esc Enferm USP 2009; 43(1):161-9 www.ee.usp.br/reeusp/The use of social indicators to implement the health surveillance model
Silva RMV, Fracolli LA
of São Paulo. The Butantã subprefecture is formed by the administrative districts of Butantã, Morumbi, Raposo Tavares , Rio Pequeno and Vila Sônia. The total area of this subprefecture is 56.1 Km², which corresponds to 3.75% of the total area of the city of São Paulo. The estimated popu-lation for 2005 was 377,351 inhabitants
The study had the following stages: 1) identification and selection of the social exclusion/inclusion indexes used to build the categories autonomy, quality of life, human development and equity; 2) organization and distribution of the indicators and categories of analysis, according to a specific territorial unit – the administrative districts of the Butantã subprefecture, in this case, and 3) analysis of these indicators according to their technological pertinence for health surveillance.
The data were analyzed quantitatively and descriptively in order to characterize the administrative districts regard-ing social exclusion/inclusion. In this process of analysis and description of the data, we attempted to identify the dif-ferences among the districts of the Butantã subprefecture and the adequacy of the selected social indicators for the operationalization of health surveillance.
RESULTS AND DISCUSSION
The figures and tables presented below intend to illus-trate the ranking, i.e., the positive or negative distancing from the inclusion standard in the region of Butantã and its administrative districts (Butantã, Morumbi, Raposo Tavares and Vila Sônia). To allow for comparisons, the city districts considered most and least distant from inclusion were included.
Category – Autonomy
The autonomy category was put in practice through the variables employability, family income and situation of indigence.
Table 1 shows that the Vila Sônia district is the region with the worst situation, with a score of 0.29, i.e. less than three out of 10 inhabitants have jobs within the district. The Butantã and Morumbi districts are within the inclu-sion standard, which means that job demand in the area is one position for each inhabitant, approximately.
Table 1 - District social exclusion/inclusion index for job offers per inhabitant aged 14-69, according to administrative districts. São Paulo, SP - 1997.
Ranking
1
20
36
42
73
80
96
District
Cidade Tiradentes
Vila Sonia
Rio Pequeno
Raposo Tavares
Butantã
Morumbi
Sé
Population aged 14-69 years
107,489
60,102
74,261
59,968
41,673
31,020
17,628
Total amount of jobs in 1997
19,076
17,648
28,966
24,629
50,377
50,534
144,506
Index
0.18
0.29
0.39
0.41
1.21
1.63
8.20
IEX
-1.00
-0.87
-0.76
-0.73
0.02
0.08
1.00
Table 2 presents the IEX of the homeless population liv-ing in the Butantã districts. Certainly, the highest concen-trations of homeless will occur in places with homeless shel-ters, such as Moóca. In this index, the Vila Sônia and Rio
Source:Social Exclusion/Inclusion Map 2000(11)
Pequeno districts have the worst conditions, with the high-est count of homeless people, which represents the extreme end of social exclusion and the utopia of the social produc-tion of health.
Table 2 - District social exclusion/inclusion index for the homeless population, according to the administrative districts. São Paulo, SP - 1997
Ranking
1
44
49
51
76
87
96
MSP District
Mooca
Vila Sonia
Rio Pequeno
Butantã
Raposo Tavares
Morumbi
Vila Curuça
IEX
-1.00
-0.01
-0.01
-0.01
0.00
0.00
0.00
Homeless people living on the streets
61
14
11
10
3
1
-5.013
Homeless people living in shelters
1,000
-3,693
Total
1,061
14
11
10
3
1
0
8,706
%
12.19
0.16
0.13
0.11
0.03
0.01
0.00
100.00
Homeless population consists of people for whom some of the basic social institutions – private property, family, mar-ket – no longer provide the usual strategies for survival. Cer-tainly, the higher the social inequality in a country, the more it affects the quality of life and health of the population in gen-eral, and the individuals and their families in particular.
The calculation of the family income social exclusion/ inclusion index (IEX) used the approximate value of
one-third of the highest income of the city as a standard, which represents 14 times the minimum wage(11). The highest
fam-ily income (Figure 1) is found in the Morumbi district, nearly equal to the index found for the Moema index, the district with the highest income of the city. It can be observed that only the Raposo Tavares district in the Butantã subprefec-ture has exclusion indexes, i.e., family income below the inclusion standard.
Figure 1 - District social exclusion/inclusion index according to family income - São Paulo, SP - 2000
Social Exclusion/Inclusion Index FAMILY INCOME
-0,33
0,02 0,15 -1,00
0,55 0,93
1,00 1 Jose Bonifáciost
35 Raposo Tavaresth
59 Rio Pequenoth
72 Butantãth
87 Vila Soniath
94 Morumbith
96 Moemath
Source:Social Exclusion/Inclusion Map 2000(11)
Inequalities in the conditions of life, due to differences in social reproduction processes, i.e. the standards of work and consumption, will reflect in the health situations of the population(8). Therefore, income and work are
essen-tial aspects to generate conditions that will produce health.
In the autonomy category, the districts of Raposo Tava-res, Rio Pequeno and Vila Sônia showed social exclusion indexes in the indicators employability and income, which are directly related with the acquisition of goods in both quantity and quality to satisfy basic necessities (food, housing, clothing, education, leisure, etc), which will re-flect in the social production of health, i.e., the accumu-lation of health.
Category – quality of life
The following variables were selected for this category: number of people per household, availability of daycare insti-tutions for children aged 0-3 years old, availability of kinder-garten schools for children aged 4-6, availability of elementary schools for children aged 7-14 and availability of basic health-care units - Unidade Básica de Saúde (UBS) for the population.
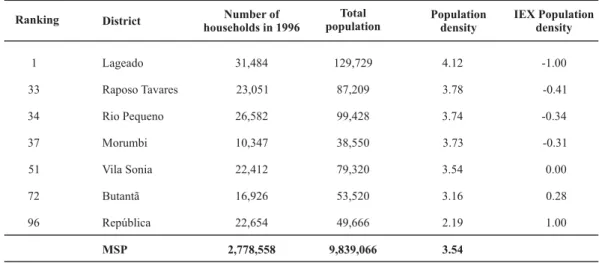
For the population density IEX (Table 3), only the Butantã and Vila Sônia districts are in a situation of inclusion. How-ever, this indicator did not assess the number of rooms in the households. This could change the results, especially in the Morumbi district, with a family income that is much higher than the inclusion standards. The Raposo Tavares dis-trict is in the worst situation for this category.
Table 3 - District social exclusion/inclusion index for the population density rate, according to the administrative districts. São Paulo, SP - 1996
Ranking
1
33
34
37
51
72
96
IEX Population density
-1.00
-0.41
-0.34
-0.31
0.00
0.28
1.00
District
Lageado
Raposo Tavares
Rio Pequeno
Morumbi
Vila Sonia
Butantã
República
MSP
Number of households in 1996
31,484
23,051
26,582
10,347
22,412
16,926
22,654
2,778,558
Total population
129,729
87,209
99,428
38,550
79,320
53,520
49,666
9,839,066
4.12
3.78
3.74
3.73
3.54
3.16
2.19
3.54 Population
density
166
Rev Esc Enferm USP 2009; 43(1):161-9 www.ee.usp.br/reeusp/The use of social indicators to implement the health surveillance model
Silva RMV, Fracolli LA
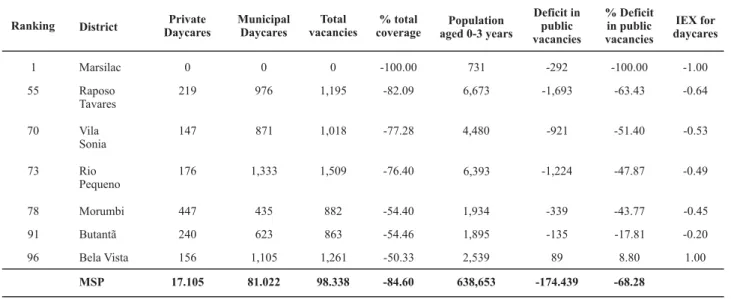
All districts in the Butantã subprefecture had a nega-tive IEX for the availability of vacancies in daycares (Table
4), which shows a deficit situation. The Raposo Tavares dis-trict had the worst exclusion index.
Table 4 - District social exclusion/inclusion index for availability of vacancies in daycares per child aged 0-3 years, according to the administrative districts. São Paulo, SP - 2000.
Ranking 1 55 70 73 78 91 96 IEX for daycares -1.00 -0.64 -0.53 -0.49 -0.45 -0.20 1.00 District Marsilac Raposo Tavares Vila Sonia Rio Pequeno Morumbi Butantã Bela Vista MSP Private Daycares 0 219 147 176 447 240 156 17.105 Municipal Daycares 0 976 871 1,333 435 623 1,105 81.022 Total vacancies 0 1,195 1,018 1,509 882 863 1,261 98.338 % total coverage -100.00 -82.09 -77.28 -76.40 -54.40 -54.46 -50.33 -84.60 Population aged 0-3 years
731 6,673 4,480 6,393 1,934 1,895 2,539 638,653 Deficit in public vacancies -292 -1,693 -921 -1,224 -339 -135 89 -174.439 % Deficit in public vacancies -100.00 -63.43 -51.40 -47.87 -43.77 -17.81 8.80 -68.28
Source:Social Exclusion/Inclusion Map 2000(11)
Nowadays, Brazilian law determines that daycares are part of the educational system, but the educational policy defines daycares as educational institutions without the char-acteristics of a school. […] the daycare assumes, jointly with family, the upbringing of the child, the transformation of the natural being into a social being, a citizen(12). The offer of
vacancies in daycares can be a protecting factor for families and children due to its social importance, noting the
follow-ing advantages: a safe place for children; satisfaction of ali-mentary needs and possibly preventive healthcare(13).
Table 5 illustrates the levels of educational exclusion for children aged 4-6 years, noting that all districts of the Butantã subprefecture lack public vacancies. The Morumbi district has the worst index, where this age range is observed to re-ceive formal education in private schools, mostly.
Table 5 - District social exclusion/inclusion index for the education of children aged 4-6 years, according to the administrative districts. São Paulo, SP - 2000.
Ranking 1 21 65 70 76 82 96 IEX EMEI -1.00 -0.74 -0.45 -0.42 -0.33 -0.24 1.00 District Marsilac Morumbi Vila Sonia Rio Pequeno Raposo Tavares Butantã Lapa MSP Municipal schools 0 387 1,925 2,873 3,195 1,296 2,419 215,034 Private schools 0 1,106 456 928 307 1,278 779 74,139 Total 0 1,493 2,381 3,801 3,502 2,574 3,198 289,173 Total children aged 4 to 6
540 1,508 3,483 4,931 4,721 1,704 1,868 479,674 %Municipal coverage 0 25.66 55.27 58.26 67.68 76.06 129.50 44.83 % Private coverage 0 73.34 13.09 18.82 6.50 75.00 41.70 15.46 Deficit/ Surplus -540 -1,121 -1,558 -2,058 -1,526 -408 551 -264,640 % Deficit/ Surplus -100.00 -74.34 -44.73 -41.74 -32.32 -23.94 29.50 -55.17
Source:Social Exclusion/Inclusion Map 2000(11)
Data in table 6 show that the Butantã district in the Butantã subprefecture has the best availability of
The provision of care by basic healthcare units -Unidade Básica de Saúde (UBS) is estimated at 1:20,000 inhabitants. For the category UBS coverage (Figure 2), the
Table 6 - District social exclusion/inclusion index for elementary education of children aged 7-14 years, according to administrative districts. São Paulo, SP - 2000.
Ranking
1
18
23
36
88
93
96
IDI Elementary education
36.53
34.18
80.66
138.49
621.15
981.78
3046.22
IEX Elementary education
-1.00
0.01
0.03
0.05
0.20
0.32
1.00
District
República
RaposoTavares
Vila Sonia
Rio Pequeno
Morumbi
Butantã
Pari
MSP
Total children aged 7-14 years
3,646
14,273
10,899
15,270
4,553
5,852
1,655
1,435,665
Enrolled students
868
14,738
11,737
17,286
7,249
11,329
6,461
1,730.420
Deficit
-2,778
465
838
2,016
2,696
5,477
4,806
294,755
-76.19
3.26
7.69
13.20
59.21
93.59
290.39
20.53 % Deficit
Morumbi district has the worst situation, being out of the inclusion standards, while the remaining districts are in a better situation.
Source:Social Exclusion/Inclusion Map 2000(11)
Social Exclusion/Inclusion Index
BASIC HEALTHCARE UNIT COVERAGE
-0,25
0,00
0,07 -1,00
0,13
0,50
1,00
1 Marsilacst
26 Morumbith
48 Raposo Tavaresth
58 Vila Soniath
68 Rio Pequenoth
85 Butantãth
96 Jaraguáth
Source:Social Exclusion/Inclusion Map 2000(11)
Figure 2 - District social exclusion/inclusion index according to Basic healthcare unit coverage, according to the administrative districts - São Paulo, SP - 1999
In the category quality of life, the Raposo Tavares dis-tricts has the worst indexes overall. Health is understood […] as an expression of the quality of life(1) and the same
author points to the fundamental need to build compound indicators of the quality of life in health surveillance, which assume the interaction of several factors in the determina-tion of the quality of life of a given city by combining differ-ent references in the city description, as well as the quality of life of its inhabitants(1).
Human development
For the human development category, the present study considers the indicators referring to the level of instruction of the head of the family and longevity.
Table 7 illustrates the educational development IEX for the family heads, an index comprising the educational rates (no education, 1-3 years of education, 4-7 years of educa-tion, 8-14 years of education and more than 15 years of education) using the 4-7 years of education range as inclu-sion standard. The Raposo Tavares and Rio Pequeno dis-tricts are below the inclusion standard for the educational development of family heads.
168
Rev Esc Enferm USP 2009; 43(1):161-9 www.ee.usp.br/reeusp/The use of social indicators to implement the health surveillance model
Silva RMV, Fracolli LA Table 7 - IEX educational development of family heads, according to the administrative districts. São Paulo, SP – 2000
Ranking 1 29 37 62 71 79 96 District Marsilac Raposo Tavares Rio Pequeno Vila Sonia Morumbi Butantã Jardim Paulista IEX no education -1.00 -0.40 -0.41 -0.24 -0.20 -0.10 0.00 IEX 1-3 years of education -1.00 -0.59 -0.50 -0.34 -0.26 -0.15 0.00 IEX 4-7 years of education 0.00 0.00 0.00 0.00 0.00 0.00 0.00 IEX 8-14 years of education 0.00 0.55 0.53 0.53 0.16 0.59 0.51 IEX more than 15 years
of education 0.01 0.08 0.22 0.45 0.89 0.59 0.95 Soma -1.99 -0.35 -0.16 0.39 0.59 0.93 1.46 IEX educational development of the family head
-1.00 -0.17 -0.08 0.27 0.41 0.64 1.00
Source:Social Exclusion/Inclusion Map 2000(11)
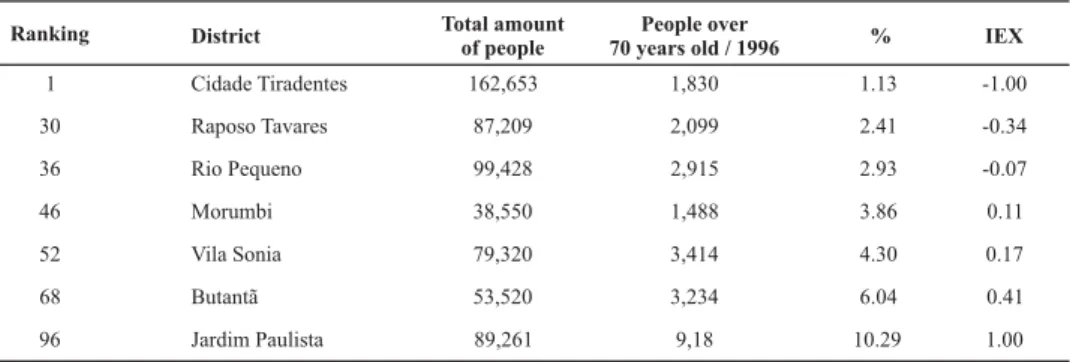
Table 8 - Longevity IEX, according to the administrative districts. São Paulo, SP - 2000
Ranking 1 30 36 46 52 68 96 District Cidade Tiradentes Raposo Tavares Rio Pequeno Morumbi Vila Sonia Butantã Jardim Paulista Total amount of people 162,653 87,209 99,428 38,550 79,320 53,520 89,261 People over 70 years old / 1996
1,830 2,099 2,915 1,488 3,414 3,234 9,18 % 1.13 2.41 2.93 3.86 4.30 6.04 10.29 IEX -1.00 -0.34 -0.07 0.11 0.17 0.41 1.00
Source:Social Exclusion/Inclusion Map 2000(11)
The homicide rates in 1999 were higher in the Morumbi and Rio Pequeno districts. The current data about homi-cide rates show that the Raposo Tavares district has the highest rates(11-14).
The increasing process of social exclusion contributes to increased violence in urban areas, pointing to the existence of intra-urban differences regarding violence, where the high-est rates are found in the regions that concentrate the groups with the least favorable socioeconomic conditions(15).
Category – Equity
The equity category was measured according to the indi-cator number of families headed by women. In Map 95, by the same author, the equity IEX was built with two variables:
the number of women who were heads of families and the number of illiterate women who were heads of families(11).
Table 9 presents the IEX of female heads of families in the Butantã subprefecture. It should be noted that the Butantã district was the only one characterized in a situation of exclu-sion, i.e. a rate that was lower than the inclusion standard. The other districts had inclusion levels that were higher than the standard. To build the IEX of women who were heads of families, the percentage of 28.34% of female heads of families was considered as the standard. According to the author,
the districts with higher rates were considered in situations of exclusion, being monoparental homes associated to the femininization of poverty and reduced wages for female workers(11).
Table 9 - District social exclusion/inclusion index for women who were heads of families, according to the administrative districts. São Paulo, SP - 1996
Ranking 1 31 46 49 51 81 96 IEX -1.00 -0.1 0.0 0.0 0.08 0.38 1.00 District Santa Cecília Butantã Rio Pequeno Raposo Tavares Vila Sonia Morumbi Marsilac MSP Permanent housing in 1996
27,970 15,286 26,068 21,776 20,383 9,986 1,833 2,708,845
Total of female family heads 11,728 3,985 6,258 5,188 4,796 2,021 247 660,422 % Women 41.93 26.07 24.01 23.82 23.53 20.24 13.48 24.38
Overall, the Raposo Tavares district, followed by Rio Pequeno, are the places with the worst social exclusion/ inclusion indexes within the Butantã region, being config-ured as the districts with the greatest social exclusion.
By analyzing some health indicators, such as infant mortality, early mortality due to stroke and diabetes melli-tus, new cases of tuberculosis, it can be observed that the Raposo Tavares and Rio Pequeno districts again have the worst indicators(14-16).
CONCLUSIONS AND FINAL CONSIDERATIONS
The indexes of social exclusion/inclusion attempt to show the inequities in the conditions of life that are conse-quences of differences in social production and reproduc-tion processes reflected in the situareproduc-tion of health of the population, i.e. the accumulation of health or disease.
In this study, the utilization of compound indicators permitted focusing on the several contexts of the territory, yielding knowledge about the place where the data come from(11). It is understood that health problems have
mul-tiple determinants. Therefore, a proposal to put in practice health surveillance should predict the recognition of the district territory or the area covered by a single healthcare unit, according to the logic of relationships between condi-tions of life, health and access to healthcare accondi-tions and services, which implies a process of selection and
system-atization of demographic, socioeconomic, political-cultural, epidemiological and sanitary data.
The compound indexes of social exclusion/inclusion (IEX) represent four broad fields that give meaning to so-cial inclusion areas: autonomy, quality of life, human de-velopment and equity. These indexes can contribute to the elaboration of health diagnoses in the perspective of health surveillance, due to monitoring conditions of life that pro-duce health by achieving basic standards of inclusion.
The distance between the levels of exclusion and inclu-sion in a given territory can be established through com-pound indexes. As such, the necessary acknowledgement of the situations that are configured as social inequities in health, i.e. the differences produced by the social insertion of the individuals, can be feasible with the use of method-ologies that identify the singularities and the heterogene-ity present in the territory. These are based on approaches that acknowledge the real distance between the forms of inclusion and exclusion produced in a society, favoring the construction of diagnoses for the situation of health or epidemiological profiles, with a view to putting health sur-veillance in practice.
The socioeconomic differences that permeate the districts of the Butantã subprefecture indicate and reinforce the need to develop and implement local public policies that could have great effects in the improvement of the conditions of life for the population found in a situation of social exclu-sion, which would make the accumulation of health possible.
REFERENCES
1. Mendes EV. Uma agenda para a saúde. São Paulo: Hucitec; 1996.
2. Bertolozzi MR, Fracolli LA. Vigilância à saúde: alerta continuado em saúde coletiva. Mundo Saúde. 2004;28(1):14-20.
3. Brasil. Ministério da Saúde. Fundação Nacional da Saúde. Unidade de Vigilância Epidemiológica: Relatório Final. In: Anais do Seminá-rio Nacional de Vigilância Epidemiológica; 1992 dez. 1-14; Brasília, BR. Brasília: Centro Nacional de Epidemiologia; 1993. p. 15-34.
4. Ayres JR. Norma e formação: horizontes filosóficos para as práti-cas de avaliação no contexto da promoção de saúde. Ciênc Saúde Coletiva. 2004;9(3):583-2
5. Teixeira CF, Paim JS, Vilasbôas AL. SUS: modelos assistenciais e vi-gilância da saúde. Inf Epidemiol SUS. 1998;7(2):7-28.
6. Mendes EV. Distrito sanitário: processo social de mudanças das práticas sanitárias do SUS. São Paulo: Hucitec; 1995.
7. Teixeira CF. Promoção e vigilância da saúde no contexto da regionalização da assistência à saúde no SUS. Cad Saúde Pública. 2002;18 Supl:S153-62
8. Barata RB, organizadora. Condições de vida e situação de saúde. Rio de Janeiro: ABRASCO; 1997.
9. Jannuzzi PM. Indicadores sociais no Brasil: conceitos, fontes de dados e aplicações. 3ª ed. Campinas: Alínea; 2004.
10. Akerman M. Examinando elementos que possam influenciar a for-mulação de políticas em estudos que utilizaram indicadores compos-tos: o chão contra o cifrão. Ciênc Saúde Coletiva. 2000;5(1):115-23.
11. Sposati A, coordenadora. Mapa de exclusão/inclusão social da cidade de São Paulo/2000: dinâmica social dos anos 90 [CD-ROM]. São Paulo: PUC-SP; 2000.
12. Veríssimo MLR, Fonseca RMGS. Funções da creche segundo suas trabalhadoras: situando o cuidado da criança no contexto educa-tivo. Rev Esc Enferm USP. 2003;37(2):25-34.
13. Santos LES, Resck ZMR, Carneiro VG. A creche e o contexto soci-al. Nursing (São Paulo). 2003;6(59):42-5.
14. Fundação Sistema Estadual de Análise de Dados (SEADE). Informações dos distritos da capital [texto na Internet]. São Paulo; 2006 [citado 2006 dez. 10]. Disponível em: http://www.seade.gov.br/ produtos/imp/distritos/
15. Gawryszewski VP, Costa LS. Homicídios e desigualdades sociais no Município de São Paulo. Rev Saúde Pública. 2005;39 (2):191-7.