Experimental investigation on the yield behavior of Nomex
hon-eycombs under combined shear-compression
Abstract
This paper presents an experimental investigation on the yield behavior of Nomex honeycombs under combined shear-compression with regard to out-of-plane direction. Four dif-ferent types of specimens were designed in order to investi-gate the influence of in-plane orientation angle on the yield behavior of honeycombs under combined loads. Two differ-ent failure modes of honeycomb specimens, i.e. the plastic buckling and the extension fracture of cell walls, are observed under combined shear-compression. The experimental re-sults validate that the in-plane orientation angle has a sig-nificant influence on the developments of the experimental yield surface. The experimental yield surfaces are compared with a phenomenological yield criterion capable of account-ing for anisotropic behavior. The comparative analytical re-sults indicate the experimental yield surfaces are approxi-mately consistent with the theoretical yield surfaces in the normal-shear stress space. These experimental results are useful to develop constitutive models of Nomex honeycombs under combined shear-compression.
Keywords
Nomex honeycombs; anisotropic behavior; initial yield sur-face.
Zhiwei Zhou, Zhihua Wang, Longmao Zhao and
Xuefeng Shu∗
Institute of Applied Mechanics and Biomedical Engineering, Taiyuan University of Technology Taiyuan 030024, China
Received 17 Apr 2012; In revised form 30 Apr 2012
∗Author email: shuxf@tyut.edu.cn
1 INTRODUCTION
load-ing conditions, especially combined shear-compression conditions with regard to out-of-plane direction.
The mechanical behavior of honeycombs under combined loads with regard to out-of-plane direction has been studied by some researchers. Petras and Sutcliffe [13] examined the failure behavior of sandwich beams with Nomex honeycomb cores subjected to combined loads. Mohr and Doyoyo [2] modified the standard Arcan rig to study the microstructural response of but-terfly shaped aluminum honeycomb specimens under combined loading. For further studies, Mohr and Doyoyo [12] employed a new universal biaxial testing apparatus to investigate the response of aluminum honeycomb under various combinations of large shear and compressive strains. Based on the experimentally measured stress–strain curves, Mohr and Doyoyo [12] pro-posed an elliptical initial yield surface and a linear crushing envelope for aluminum honeycomb. Note that the honeycomb specimens employed by the above-mentioned researchers [2, 12, 13] have only single in-plane orientation angle and thus the shear loads were applied along sin-gle direction. Hong et al [6, 7] devised two systems (so-called the independently controlled test fixture [6] and the inclined test fixture [7]) to extensively investigated the quasi-static crush behavior of aluminum honeycomb under combined shear-compression. A phenomeno-logical yield criterion for aluminum honeycomb specimens with different in-plane orientation angles was proposed in terms of the experimental normal crush and shear strengths under different loading conditions. In addition, the influence of the in-plane orientation angle on energy absorption rate was also defined. In a follow-up investigation, Hong et al [8] introduced an impact test apparatus in terms of their quasi-static method to perform dynamical biaxial experiments on aluminum honeycomb. Recently, Hou et al [9, 10] designed a large-diameter Nylon Split Hopkinson Pressure Bar system (SHPB) with beveled ends of different loading angles to investigate the crush behavior of aluminum honeycomb specimens under combined shear-compression. A significant strength enhancement was found at dynamic loading for both normal and shear behaviors with respect to the quasi-static case.
y
x
z
dt
x
F
Tθ
β
y
Figure 1 A schematic of Nomex honeycomb with hexagonal microstructure.
2 EXPERIMENTAL PROCEDURE
2.1 Material and specimen
Nomex hexagonal honeycomb was employed in this investigation. A schematic of Nomex hon-eycomb with hexagonal cellular microstructure is shown in Fig. 1. The hexagonal honhon-eycomb has a density of 72kg/m3with single wall thickness t = 0.065mm, the expansion angleθ=30○,
and the cell size d = 4.76mm. It has three material symmetry axes denoted as, as shown in Fig.1. Thez-direction, also known as the out-of-plane direction corresponds to the axes of the honeycomb cells, is the strongest material symmetry direction. The other two directions (xandy) are so-called in-plane directions referred as the ribbon direction and the width di-rection of honeycomb. The in-plane orientation angle β is defined as the angle between the in-plane material symmetry axex and the in-plane shear loadFT.
Type U specimens with dimension of 42.6 ×42.8 ×25.0mm in the directions of L W H re-spectively were used in the out-of-plane compression tests. Four types of honeycomb specimens with different in-plane orientation angles were designed in combined shear-compressive tests for investigating the influence of the in-plane orientation angle on the yield behavior under combined loads with regard to out-of-plane direction. The parameters of five types of speci-mens and the corresponding loading conditions are listed in Table 1. All honeycomb specispeci-mens were extracted from rectangular plates of Nomex honeycomb with dimension of 500 × 500 × 025mm in the directions of L W H respectively, as shown in Fig.2. It should be pointed out that there exists a small size difference among four types of specimens used in combined shear-compression tests due to ensuring the integrity of honeycomb cells in the extracting process. The influence of the size difference among four types of honeycomb specimens on experimental results will be detailed discussed in section 3.3.1.
2.2 Out-of-plane compression tests
The aim of the out-of-plane compression tests is to determine the compressive strength of Nomex honeycombs in relation to the plane direction. The test results under the out-of-plane compression will be compared with those under combined shear-compression of loading angle φ = 90○. The out-of-plane compression tests with the type U specimens were carried
y
x
u
B
A
C
D
FT
FT
FT
FT
w w
L
L
Figure 2 A schematic of the in-plane areas of five types of specimens Table 1 The parameters of five types of honeycomb specimens
Type L×W×H (mm3) In-plane orientation angles Loading conditions U 42.8×42.6×25.0 Out-of-plane compression
A 42.6×19.0×25.0 β=00 Out-of-plane combined shear-compression
B 42.8×17.9×25.0 β=30
0
Out-of-plane combined shear-compression C 42.6×19.0×25.0 β=600 Out-of-plane combined shear-compression
D 42.8×17.9×25.0 β=900 Out-of-plane combined shear-compression
Complete cell number Cell walls number Double cell walls number
85 293 90
35 132 45
36 128 45
35 132 44
36 128 38
at a constant displacement rate of 1mm/min and the loads and displacements were recorded during the entire process of loading. Tests were repeated 5 times and the compressive strength is determined from the average yield load divided by the load carrying area of specimen.
2.3 Combined shear-compression tests
In this section, the Arcan test rig originally designed to study the biaxial failure of unidirec-tional fiber-reinforced composites [1] is employed to investigate the yield behavior of Nomex honeycombs under combined shear-compression with respect to the out-of-plane direction. The rig consists of two pairs of plane semi-circular loading plates, as illustrated in Fig. 4. The two pairs of loading plates are connected to a universal material testing machine through clamped configuration with single loading pin. The array of pin holes in the loading plates allows the loading plates to be attached to the clamped configuration with single loading pin at different orientations. This allows a range of values of the loading angleφbetween the plane of specimen and the loading direction. It should be point out that in this study a cubic shape of modified Arcan specimens was used to carry out the experiments. Load carrying surface of the cube specimen was subjected to a uniform distribution of load in the whole experimental process and the initial plastic buckling appeared on the load carrying surface of the cube specimen that denotes the termination of elastic region and the onset of plastic collapse of honeycomb. Four types of honeycomb specimens with different in-plane orientation angles were extracted from the rectangular plates of honeycomb supplied by manufacturer and subsequently bonded to the steel intermediate grips using the Epoxy glue. Finally, the honeycomb specimens with the steel intermediate grips were set in a bonding fixtures, which applied a constant pressure on the specimens until they were ready for testing, as illustrated in Fig.5. The stress state of honeycomb specimen in the Arcan tig is shown in Fig. 4 and the normal stress and the shear stress of specimen is given by [11]:
σ= FN S =
F Sinφ
S (1)
τ = FT S =
F Cosφ
S (2)
Here, S represents the load carrying area of specimen.
The combined shear-compression tests were conducted by controlling the constant vertical displacement rate of 1mm/min using the universal material testing machine and the Arcan rig, as shown in Fig. 6. Tests were repeated 5 times for every loading angle.
3 EXPERIMENTAL RESULTS AND DISCUSSION
3.1 Out-of-plane compression response
F
Specimen
Clamped configuration
Φ
Loading pin
F
NF
TSpecimen
Figure 4 A schematic of the Arcan rig.
Figure 5 Preparation of type A and D specimens in a bonding fixture
(a) (b) (c)
Figure 6 The loading device and the Arcan rig: (a) pure shear test (φ=0○); (c) combined shear-compression test (φ=60○); (d) pure compression test (φ=90○)
Table 2 Compressive strength of type U specimens in out-of-plane compression tests
Type Load carrying Peak load Compressive
area (mm2) (N) strength (MPa)
U 1823.3 6092.1; 6033.4; 6051.1; 6081.4; 6100.1 3.34
3.2 Combined shear-compression response
3.2.1 Pure compression tests(φ=90○)
The characteristic vertical force versus displacement responses of the four types of specimens under combined load of loading angle φ=90○ are shown in Fig.8. Its general shape is approx-imately in agreement with those obtained from the out-of-plane compression tests in section 3.1. In the elastic region, the vertical force-displacement curve is initially linear, but becomes non-linear at the following stages due to elastic buckling of the cell walls. When the load reaches peak, the initial plastic buckling appears on load carrying surface of specimen that denotes the termination of elastic region and the onset of plastic collapse of honeycomb. After the peak, the load rapidly drops and subsequently remains at a nearly constant value as the displacement increases. In the post-peak region, specimen has developed several regular buck-les with some wavelength and the cell walls are progressively folded, as illustrated in Fig.9. In other words, the localized folding process of cell walls is reflected in force-displacement curve by small fuctuations around a nearly constant load plateau. The yield stress is determined by average peak load divided by the load carrying area of specimen, as listed in table 3. The yield stress difference between type A and C specimens which have the same dimensions and cell numbers is only 0.02 MPa, but the difference between type B and D specimens which also have the same dimensions and cell numbers reaches 0.08 MPa. This strength difference between type B and D specimens is caused by the difference of the proportion of double cell walls in all cell walls, as listed in table 1. It should be noted that the mechanical properties of commercial honeycombs usually have variations of ±5% from the mean value. The yield stress values of four types of honeycomb specimens are within the range of the compressive strength value of 3.33± 0.07MPa obtained from the out-of-plane compression tests in section 3.1. Therefore, the pure compression test results of four types of specimens are approximately consistent with those obtained from the out-of-plane compression tests in section 3.1 and the influence of dimensions difference among four types of specimens on the experimental results is not significant.
Table 3 Yield stress of four types of honeycomb specimens in pure compression
Type Load carrying area (mm2
(a) (b)
Figure 8 Vertical force-vertical displacement curves of four types of specimens under combined shear-compression test of loading angleφ=90○
Figure 9 Front view of type D specimen under combined shear-compression test of loading angleφ=90○
3.2.2 Pure shear tests (φ=0○)
A specimen. This experimental result seems rational since as the in-plane orientation angle increases, the resistive contribution of double thickness cell to the shear load decreases.
(a) (b)
Figure 10 Vertical force-vertical displacement curves of four types specimens under combined shear-compression test of loading angleφ=0○
Table 4 Yield stress of four types of honeycomb specimens in pure shear
Type Load carrying area (mm2
) Peak load (N) Yield stress (MPa) A 809.4 1834.3; 1802.1; 1711.4; 1774.7; 1740.4 2.19 B 766.1 1241.3; 1371.5; 1310.4; 1321.4; 1267.3 1.70 C 809.4 1071.4; 981.3; 1042.4; 951.4; 1093.5 1.27
D 766.1 782.6; 807.4; 831.4; 752.7; 771.4 1.03
3.2.3 Combined shear-compressive tests (φ= 10○ to 80○)
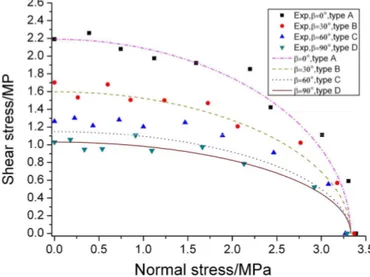
onset of brittle extension fracture of cell walls. A comparison of the top views of crushed type D specimens from combined shear-compressive tests is shown in Fig.12. The normal and shear stresses at the yield points are calculated from the average peak loads according to Eqs. (1) and (2), respectively. The measured peak loads and normal and shear stresses of four types of specimens at the yield points under different loading conditions are presented in Table 5. The calculated yield points of four types of specimens at every loading angle are plotted in the normal-shear stress space, as shown in Fig.13. It can be found that under conditions of the same loading angles, the normal and shear stresses of honeycomb decrease as the in-plane orientation angle increases. This results are well consistent to the results obtained from pure shear tests (φ=0○) in that the contribution of the double thickness cell walls to the shear resistance notable decreases as the in-plane orientation angle increases. For loading angles such as 10○ to 50○, the shear stresses of four types of specimens at yield points are all close to the pure shear strength, respectively. In other words, the load carrying capacities of four types of specimens under combined loads are restricted by the pure shear strength, respectively. For higher loading angle of 80○, the normal stresses of four types of specimens at yield points are close to the out-of-plane compression strength due to loading state dominated by compression. The deformation pattern of honeycomb specimens is similar to the pattern observed in pure compression tests(φ=90○).
(a) (b)
Figure 11 Vertical force-vertical displacement curves of four type specimens under combined shear-compression test of loading angleφ=50○
4 DETERMINATION OF THE MACROSCOPIC YIELD SURFACES
As cushioning structures, the failure patterns and the macroscopic stress distributions of hon-eycombs are complicated in working conditions. It is quite difficult to model the detailed microscopic deformation mechanisms of honeycombs. Therefore, a phenomenological yield cri-terion for honeycombs, evaluated from the measured results in combined shear-compression test, is now presented. In 1948, Hill proposed a criterion capable of accounting for anisotropic behavior of materials [5]. The well-known criterion is written as:
H(σxx−σyy)2+F(σyy−σzz)2+G(σzz−σxx)2+2Lσyz2 +2M σ
2
zx+2N σ
2
Table 5(a) Yield stresses of type A specimens under combined shear-compression
Loading angle Peak load (N) Yield stress (σ, τ) (MPa) 10 1890.4; 1794.5; 1756.4; 1804.2; 1843.7 (0.39, 2.26) 20 1690.2; 1759.2; 1849.3; 1902.2; 1615.6 (0.76, 2.08) 30 1781.4; 1684.7; 1954.1; 1920.7; 1743.4 (1.12, 1.98) 40 1889.4; 2074.1; 1997.4; 2018.4; 2044.2 (1.59, 1.92) 50 2085.3; 2307.5; 2218.7; 2186.4; 2554.6 (2.19, 1.85) 60 2479.1; 2034.5; 2010.5; 2287.1; 2545.3 (2.43, 1.42) 70 2581.4; 2499.6; 2689.5; 2504.7; 2681.3 (3.00, 1.11) 80 2689.5; 2770.3; 2720.5; 2734.7; 2667.5 (3.31, 0.60)
Table 5(b) Yield stresses of type B specimens under combined shear-compression
Loading angle Peak load (N) Yield stress (σ, τ) (MPa) 10 1040.5; 1291.8; 1316.4; 1160.8; 988.0 (0.26, 1.53) 20 1494.3; 1299.1; 1354.9; 1250.9; 1318.8 (0.60, 1.68) 30 1483.8; 1069.3; 1358.9; 1458.6; 1190.9 (0.85, 1.51) 40 1609.6; 1475.1; 1397.4; 1316.2; 1573.2 (1.24, 1.50) 50 1985.4; 1626.7; 1719.8; 1667.6; 1637.4 (1.73, 1.47) 60 1743.3; 1979.1; 1854.9; 1784.0; 1746.7 (2.06, 1.21) 70 2384.7; 2400.1; 2159.6; 2107.3; 2228.3 (2.89, 1.07) 80 2381.8; 2379.1; 2622.2; 2471.4; 2508.5 (3.18, 0.57)
Table 5(c) Yield stresses of type C specimens under combined shear-compression
Loading angle Peak load (N) Yield stress (σ, τ) (MPa) 10 1191.2; 1081.2; 960.9; 1002.1; 1054.6 (0.23, 1.30) 20 991.4; 1101.1; 939.8; 941.3; 1149.4 (0.43, 1.21) 30 1416.2; 999.6; 1188.1; 1061.3; 1219.3 (0.73, 1.28) 40 1285.2; 1184.2; 1304.7; 1281.0; 1240.9 (1.00, 1.20) 50 1754.6; 1497.9; 1557.8; 1606.1; 1342.6 (1.47, 1.25) 60 1697.5; 1735.4; 1904.5; 1857.2; 1631.9 (1.89, 1.10) 70 1984.2; 2203.6; 2168.5; 2047.3; 2208.9 (2.46, 0.91) 80 2600.4; 2492.3; 2478.6; 2734.7; 2349.0 (3.08, 0.56)
Table 5(d) Yield stresses of type D specimens under combined shear-compression
(a) (b)
Figure 12 Top views of type D specimens (a) for loading angleφ=80○, (b) for loading angleφ=20○
Figure 13 Yield points of four types of specimens under different loading conditions in the normal-shear stress space
The material constants H and N are introduced to account for anisotropy and can be determined from experiments. If σXT, σY T, and σZT are the yield strengths in the principal directions of anisotropy
F = 1 2( 1 σ2 Y T + 1 σ2 ZT − 1 σ2 XT
) G=
1 2( 1 σ2 ZT + 1 σ2 XT − 1 σ2 Y T )
H= 1 2( 1 σ2 XT + 1 σ2 Y T − 1 σ2 ZT
) L= 1 2(τS
Y Z)
2 M =
1 2(τS
ZX)
2 N =
1 2(τS
XY)
2
(4)
Where τY ZS , τZXS and τXYS are the yield strength with respect to the axes of anisotropy. Here,σxx,σyyandσzz are the normal stresses andσyz,σzxand σxy are the shear stresses with respect to the material symmetry axes x, y and z. In this investigation, loading conditions involve only out-of-plane combined shear and compressive stresses (σxx=σyy=σzz=0), the yield criterion can be rewritten as
σzz2 + σ2
ZT
(τY ZS )2σ 2
yz+ σ2
ZT
(τZXS )2σ 2
Note that the goal of this investigation is to determine the initial yield surface of honeycomb. Therefore, the normal and shear stresses in Eq. (5) can be displaced by the normal yield strength and the shear yield strengths defined by Eqs (1) and (2). Eq (5) can be written as
σzz2 +P τ
2
zy+Qτ
2
zx=σZT2 (6)
where P and Q are material parameters. Here, σzz is the normal strength in z direction, τzy and τzx are the shear strengths with regard to the material symmetry axes z–y and z–x, respectively, and σZT is the compressive strength with regard to the z direction determined by the out-of-plane compressive tests. Based on the experimental result,σZT= 3.33MPa. For a given in-plane orientation angle β, the in-plane shear strength τ can be decomposed into τzy and τzx with regard to the material symmetry axes z–x and z–y. Therefore, for a given set of the normal yield strength σ and the shear yield strengths τ, A quadratic curve in the normal-shear stress space was derived as
σ2+(Pcos2
β+Qsin2
β)τ2=σZT2 (7)
By fitting the experimental results of type A and D specimens with the least squares algo-rithm, the values ofP and Q can be identified to be 2.251 and 9.654, respectively. The yield surfaces for β = 30○ and 60○ based on the yield criterion in Eq (7) are plotted in Fig. 14 for
being compared to experimental results of type B and C specimens. The Scatters in Fig. 14 are the yield points of four types of specimens under the combined shear-compressive tests. By comparing the experimentally measured yield surfaces and the phenomenological yield criteria, it can be found that the experimental yield surface of type B specimens are approximately consistent with the theoretical yield surfaces, the phenomenological yield criteria slightly un-derestimates experimental yield strengths of type C specimens. But this deviation does not significantly influence the description for the anisotropic behavior of Nomex honeycombs.
5 CONCLUSIONS
Two different types of tests, i.e. the out-of-plane compression test and the combined shear-compression test with regard to out-of-plane direction, were conducted in order to investigate yield behavior of Nomex honeycombs. The compressive strength of honeycombs with regard to the out-of-plane direction was determinated by the out-of-plane compression tests. The combined shear-compression tests were conducted on four types of specimens with different in-plane orientation angles by using the universal material testing machine and the Arcan test rig. Two different failure modes, namely:the plastic buckling and extension fracture of cell wall, were observed under the combined shear-compression tests. The notable influence of the in-plane orientation angle on the experimental yield surfaces of honeycomb due to the existence of the double-thickness walls was validated. The experimental yield surfaces were compared with a phenomenological yield criterion capable of accounting for anisotropic behavior. The phenomenological yield criteria can properly describe the experimental yield surfaces of Nomex honeycombs. These experimental results are useful to develop constitutive models of Nomex honeycombs under combined shear-compression.
Acknowledgments This work is supported by the National Natural Science Foundation of
China(Grant No. 11172195), the international cooperative scientific project of StateShanxi (Grant No.2010081016) and Scientific project of CityplaceTaiyuan (Grant No.10011607). The financial contribution is gratefully acknowledged.
References
[1] M. Arcan, Z. Hashin, and A. Voloshin. Method to produce uniform plane stress states with applications to ber-reinforced materials. Experimental Mechanics, 18:141–146, 1978.
[2] M. Doyoyo and D. Mohr. Microstructural response of aluminum honeycomb to combined out-of-plane loading. Mechanics of Materials, 35:865–876, 2003.
[3] C.C. Foo, G.B. Chai, and L.K. Seah. Mechanical properties of nomex material and nomex honeycomb structure. Composite Structures, 80:588–594, 2007.
[4] L.J. Gibson and M.F. Ashby. Cellular solids: structure and properties. Cambridge University Press, Cambridge, 1997.
[5] R. Hill. A theory of the yielding and plastic flow of anisotropic metals. Inproceedings of the Royal Society of London, volume 193 ofA, pages 281–300, 1948.
[6] S.T. Hong, J. Pan, T. Tyan, and P. Prasad. Quasi-static crush behavior of aluminum honeycomb specimens under compression dominant combined loads.International Journal of Plasticity, 22:73–109, 2006.
[7] S.T. Hong, J. Pan, T. Tyan, and P. Prasad. Quasi-static crush behavior of aluminum honeycomb specimens under non-proportional compression-dominant combined load.International Journal of Plasticity, 22:1062–1088, 2006.
[8] S.T. Hong, J. Pan, T. Tyan, and P. Prasad. Dynamic crush behaviors of aluminum honeycomb specimens under compression dominant inclined loads. International Journal of Plasticity, 24:89–117, 2008.
[9] B. Hou, A. Ono, S. Abdennadher, S. Pattofatto, Y.L. Li, and H. Zhao. Impact behavior of honeycombs under combined shear-compression, part i: Experiments.International Journal of Solids and Structures, 48:687–697, 2011.
[10] B. Hou, A. Ono, S. Abdennadher, S. Pattofatto, Y.L. Li, and H. Zhao. Impact behavior of honeycombs under combined shear-compression, part ii: analysis.International Journal of Solids and Structures, 48:698–705, 2011.
[12] D. Mohr and M. Doyoyo. Experimental investigation on the plasticity of hexagonal aluminum honeycomb under multiaxial loading.Journal of Applied Mechanics, 71:375–385, 2004.
[13] A. Petras and M.P.F. Sutclie. Indentation failure analysis of sandwich beams. Composite structure, 50:311–318, 2000.