An effective thickness proposal for strength evaluation of
one-side pitted steel plates under uniaxial compression
Abstract
This paper presents the results of an investigation into the post-buckling behaviour and ultimate strength of imperfect pitted steel plates used in ship and other marine-related structures. A series of elastic-plastic large deflection finite element analyses is performed on pitted steel plates. The effects of pitting corrosion on one side of the plates are in-troduced into the finite element models. The effects on plate compressive strength as a result of parametric variation of the pitting corrosion geometry are evaluated. A proposal on the effective thickness is concluded in order to estimate the ultimate strength and explore the post-buckling behaviour of pitted steel plates under uniaxial compression.
Keywords
steel plate, pitting corrosion, uniaxial compression, effective thickness
Zorareh Hadj Mohammad Esmaeil Nouriaand Mohammad Reza Khedmatib,∗ and
Shok-oufeh Sadeghifardc
aDepartment of Marine Technology, Amirkabir
University of Technology, Tehran 15914, Iran bDepartment of Marine Technology, Amirkabir
University of Technology, Tehran 15914, Iran cDepartment of Marine Technology, Amirkabir
University of Technology, Tehran 15914, Iran
Received 17 Apr 2012; In revised form 27 Apr 2012
∗Author email: [email protected]
1 INTRODUCTION
Corrosion in marine structures is mainly observed in two distinct types, namely, general cor-rosion and pitting corcor-rosion. General corcor-rosion is the problem when the plate elements such as the hold frames of bulk carriers have no protective coating. Both surfaces of the plate may be corroded, in a pattern like the sea waves spectrum. Generally, pitting corrosion is defined as an extremely localised corrosive attack and sites of the corrosive attack are relatively small compared to the overall exposed surface [1].
Pitting occurs on the ship’s steel structures that are in contact with water (such as the bottom and side shell plating) or subject to wind and water conditions (such as the boot topping area) as well as in the tanks carrying liquid cargoes or ballast. Excessively deep pits can lead to perforation of the plate and possibly to serious pollution. Pitting does not occur in areas of plating that are not immersed in water and/or subject only to spray. Pitting corrosion of hold frames in way of cargo holds of bulk carriers which have coating such as tar epoxy paints is also reported and studied by Nakai et al.[15].
NOTATIONS
α Plate length
A Area
AR Aspect ratio of the plate
A0mm Coefficients in initial deflection function
Apit Pit area(= πD2pit
4 )
b Plate width
D Diameter
DOP Density of pitting(= npitApit
ab )2 dw Uniform reduction in thickness E Young modulus of material
H Pit depth
m Number of half-waves in longitudinal direction
n Number of half-waves in transverse direction
npit Number of pit(s)
ny Number of years of exposure
r1 , r2 Random numbers corresponding to the corroded surfaces of the plate
RDP Ratio of pit diameter to depth of pit(=Dpit
H )3 S Standard deviation of random thickness variations
t(=t0) Thickness of plate in uncorroded condition
tavg Average thickness(=VuncorrodedA−Vcorroded)4 teq Effective thickness
tn Equivalent uniform thickness of the corroded plate, aftern years of exposure
tp Thickness function in general corrosion model
Ux Displacement along X-axis
Uy Displacement along Y-axis
Uz Displacement along Z-axis
V Volume
Vcorroded Volume of the pits(=npit.Vpit)5
Vpit Volume of one pit(= 1 3Apit
1 Dpit.RDP)6
W Original weight of uncorroded plate
W0 Initial deflection function
W0max Maximum magnitude of initial deflection
Wn Actual weight of the corroded plate afternyears of exposure
ZU pSRF Z-coordinate of the upper surface of the plate
ZLowSRF Z-coordinate of the lower surface of the plate
v Poisson’s ratio of material
α Coefficient describing different parameters of the pitted plate
β Plate slenderness parameter(= b t
√σY
E )7
m Equivalent mean corrosion depth of the pitted plate
p Density of plate material
e Strain
y Material yield strain(=σY/E)8
σ Stress
σF inal Final strength
σY Material yield stress
σU Material ultimate stress
σcr Buckling strength of the plate
2 RESEARCH BACKGROUND ON THE STRENGTH OF CORRODED ELEMENTS
the conclusion that the most important parameters influencing the ultimate strength of the pitted stiffened plates under bi-axial compressive loads are the smallest sectional area and also density of pitting.
There have been also some research works on the strength of plates and stiffened plates suffering general corrosion. Mateus and Witz [14] investigated the effect of general corrosion on the post-buckling of plates using the uniform thickness reduction approach and a quasi-random thickness surface model. They revealed that the usual uniform thickness reduction approach to account for general corrosion effects is not adequate because plastic hinges formed due to plate surface irregularity slightly decreases its ultimate strength and significantly affects the post buckling behaviour of the plate. Teixeira and Guedes Soares [8, 23, 24] investigated the collapse behaviour and ultimate strength of plates with random spatial distributions of corroded thicknesses. They demonstrated the importance of the spatial representation of the corrosion by random fields as an alternative to the traditional approach, based on a uniform reduction of the plate thickness. Seo et al. [21] validated the equivalent plate thickness approach for ultimate strength analysis of stiffened panels with non-uniform plate thickness. Khedmati et al. [13] made an extensive numerical study on the strength of steel plates with both-sides randomly distributed with corrosion wastage under uniaxial compression. They also proposed an effective thickness formulation for strength assessment of these plates under uniaxial compression [12]. Nouri et al. [17] studied numerically the strength and collapse behaviour of stiffened plates with both-sides randomly distributed with corrosion wastage under uniaxial compression.
3 FINITE ELEMENT ANALYSIS (FEA)
3.1 Extent of the model
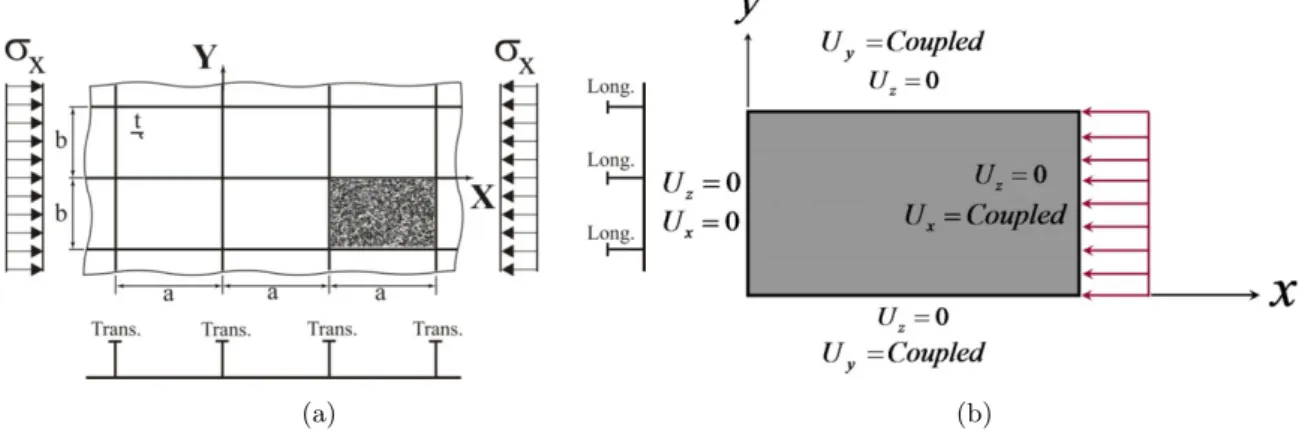
The plates in ships and offshore structures are continuous. Longitudinal stiffeners and trans-verse frames divide the surface of the plates into isolated regions, Fig. 1(a). Such regions, which are shaded in Fig. 1(a), are considered as the model extent in the analyses.
(a) (b)
Figure 1 (a) Extent of the model, (b) Boundary and loading conditions.
3.2 Loading and boundary conditions
As shown in Fig. 1(a), the plate is in fact of continuous nature. The continuous plate is divided into a number of local plate panels surrounded by longitudinal stiffeners and transverse frames. To consider the effects of longitudinal stiffeners and transverse frames in the behaviour of local plate panel model, proper boundary conditions are to be applied on it. The boundary conditions were common to all cases and represented those typically found in marine structures, Fig. 1(b).
Out-of-plane movement was restrained for all plate edges. The loaded edges (the two transverse edges) were kept straight mainly due to the continuity of plate and partly owing to the presence of stiff transverse frames. This has been demonstrated in the Fig. 1(b) with imposing “Ux=0” or “Ux=Coupled” condition on the nodes lying on the transverse edges of
3.3 Finite Element code, adopted element, mesh density and nonlinear parameters
The ANSYS version 11.0 was used in all FE analyses. A code was prepared in APDL (ANSYS Parametric Design Language) to facilitate the parametric modelling and analysis using ANSYS [2].
Plates are modelled by SHELL181 elements with elastic-plastic large deflection solution option. SHELL181 is suitable for analyzing thin to moderately-thick shell structures. It is a 4-node element with six degrees of freedom at each node: translations in the x, y, and z directions, and rotations about the x, y, and z-axes. SHELL181 is well-suited for linear, large rotation, and/or large strain nonlinear applications. Changes in shell thickness are accounted for in nonlinear analyses. In order to obtain reasonable results, a number of sensitivity analyses were carried out to find out the optimum mesh density and proper values of nonlinear analysis options. It was found that 40 longitudinal divisions and 20 transversal divisions are enough in order to discretise the plate. A more accurate discretisation with a refinement order of 9 was used to model the pits. Arc-length nonlinear method has been used to obtain loading and unloading patterns of the plates under compression.
A sample finite element discretisation for a plate with cone type pitting corrosion is rep-resented in Fig. 2. Each of the pits has a depth of Hpit and a base diameter of Dpit. The
number of pits isnpit. Other geometric characteristics of the pits are pit area (Apit), density
of pitting (DOP), ratio of pit diameter to the depth of the pit (RDP) and the volume of the pit (Vpit). The prepared code finds the position of the pits according to a rational procedure
and based on the chosen density of pitting (DOP). First of all, the code calculates area of each pit and finds number of total required pits to meet desired DOP. Then, the pits are generated in a systematic way considering their assumed dimensions and uniform distribution in length and width of plate.
(a) (b) (c)
Figure 2 (a) Scaled views of the Finite element discretisation of the pitted plate, (b) Magnified cross-sectional view of the pitted plate, (c) Zoomed view of the pitted plate.
3.4 Applied material properties
of 235.2MPa and 362.6MPa are respectively taken into account for NS and HTS steels. It is evident that strain-hardening effect has some influence on the nonlinear behaviour of plates. The degree of such an influence is a function of many factors including plate slenderness. In this study, material behaviour for plate was modelled in a bi-linear elastic-plastic manner with strain-hardening rate of E/65, Fig. 3. This value of strain-hardening rate was obtained through a large number of elastic-plastic large deflection analyses made by Khedmati [11].
Figure 3 Idealised bilinear model of stress-strain curve for material.
3.5 Initial imperfections
Figure 4 Real distribution of initial deflection or so-called thin-horse mode initial deflection [7, 11].
The actual mode of the initial deflection of the plate is very complex, Fig. 4 (Fujikubo et al. [6, 7]). This complex mode can be expressed by a double sinusoidal series as:
w0= ∞
∑
m=1 ∞
∑
n=1
A0mnsin mπx
a sin nπy
b (1)
Table 1 Coefficients of thin-horse mode initial deflection as a functions of plate aspect ratio [26].
a/b A01/t A02/t A03/t A04/t A05/t A06/t A07/t A08/t A09/t A010/t A011/t
1<a/b<√2 1.1158 -0.0276 0.1377 0.0025 -0.0123 -0.0009 -0.0043 0.0008 0.0039 -0.0002 -0.0011 √
2<a/b<√6 1.1421 -0.0457 0.2284 0.0065 0.0326 -0.0022 -0.0109 0.001 -0.0049 -0.0005 0.0027 √
6<a/b<√12 1.1458 -0.0616 0.3079 0.0229 0.1146 -0.0065 0.0327 0.000 0.000 -0.0015 -0.0074 √
12<a/b<√20 1.1439 -0.0677 0.3385 0.0316 0.1579 -0.0149 0.0743 0.0059 0.0293 -0.0012 0.0062 √
20<a/b<√30 1.1271 -0.0697 0.3483 0.0375 0.1787 -0.0199 0.0995 0.0107 0.0537 -0.0051 0.0256
with the increase in load except for the first term with one half-wave. In this case, only the first term (n=1) may play a dominant role, and the simpler form of the initial deflection can be used for the analysis as follows:
w0=
∞
∑
m=1
A0m1sin mπx
a sin πy
b (2)
Ueda and Yao [25] used only odd terms. Finally, Yao et al. [26] also introduced even terms into this mode, and the so-calledidealised thin-horse mode took the following form:
w0= 11
∑
m=1
A0m1sin mπx
a sin πy
b (3)
The initial deflection mode expressed by Eq. 3 is called idealised thin-horse mode, since the relevant deflection surface is similar in shape to the back of a thin horse. The coefficients of this mode are given in Table 1 (Yao et al. [26]) as functions of plate aspect ratio and its thickness. The maximum magnitude of initial deflection,w0max, is taken as:
w0 max=0.3β2t (4)
whereβ is the slenderness parameter of the plate and defined by:
β= b t
√σ
Y
E (5)
whereσYand E are yield stress and modulus of elasticity of the plate, respectively.
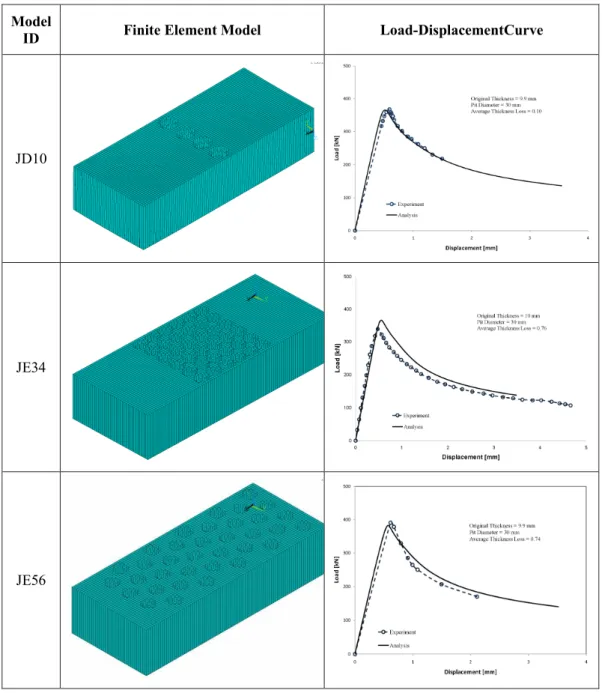
3.6 Validation
the difference in the values of the ultimate strength of the models as obtained by FEM and test varies from 1.8 percent (in case of JD10 and JE56 models) to 8 percent (in case of JE34 model). However, it should be emphasised that many items such as the exact layout of the pits on the surfaces of the models, initial deformation mode and mesh density affects highly their responses and may lead to large variations between FEM and test results.
Table 2 Description of the analysed cases for validation purpose
Table 3 Comparison between experimental and numerical ultimate strength values for the validation models Model ID (σU lt
σY ) ( σU lt
σY )F EM Difference (%)
JD10 0.506 0.497 -1.8
JE34 0.461 0.498 8.0
JE56 0.538 0.526 -2.2
(a) (b) (c)
Figure 5 (a) Test rig set up with test specimen used by Nakai et al. [1], (b) An example of test specimen (all dimensions in mm), (c) Pit distribution in different specimens.
In the case of JD10 model, where the number of pits is small and pits exist only on one side of the model, the ultimate strength is strongly affected by which side is the convex of the initial deflection mode.
Besides, when the number of pits is large and they are located on both surfaces of the model, as in the cases of JE34 or JE56 models, the ultimate strength gets smaller when the pits are locally concentrated at the middle part of the model. Another important aspect in such cases is that when the pits are localised at the middle part of the model, the ultimate strength is sensitive to the shape of initial deflection mode of the model. No information on the initial deflection of the models has been reported by Nakai et al. [15]. On the other hand, the finite element simulations for these three models were performed without considering the initial deflection for them. One of the main reasons behind the 8% difference in the FEM prediction of the ultimate strength and the relevant test result in the case of JE34 model can be considered as due to neglecting the effect of initial deflection of the model in the finite element simulation.
A comparison of the experimental and numerical load-displacement relationships for the validation models is given in Table 4. It can be simply realised that the FEM results are in relatively good agreement with the test results.
Table 5 Deformation mode and spread of plasticity for the validation models as obtained by FEM (magnification factor for deformation mode: 10).
4 PARAMETRIC STUDY
In order to study the effects of pitting corrosion on the response of axially loaded plates, different cases were considered. The cases included in the study are briefly explained as follows:
• Corroded plates withAR=2,t=10 mm,DOP=10%, 20%, 30%;D=20, 30 mm;RDP=4,
6, 8, 10 and made of HTS or NS steels
• Corroded plates withAR=3,t=10 mm,DOP=10%, 20%, 30%;D=20, 30 mm;RDP=4,
6, 8, 10 and made of HTS or NS steels
• Corroded plates withAR=2,t=14 mm,DOP=10%, 20%, 30%;D=20, 30 mm;RDP=4,
• Corroded plates withAR=3,t=14 mm,DOP=10%, 20%, 30%;D=20, 30 mm;RDP=4,
6, 8, 10 and made of HTS or NS steels
• Corroded plates withAR=2,t=18 mm,DOP=10%, 20%, 30%;D=20, 30 mm;RDP=4,
6, 8, 10 and made of HTS or NS steels
• Corroded plates withAR=3,t=18 mm,DOP=10%, 20%, 30%;D=20, 30 mm;RDP=4,
6, 8, 10 and made of HTS or NS steels
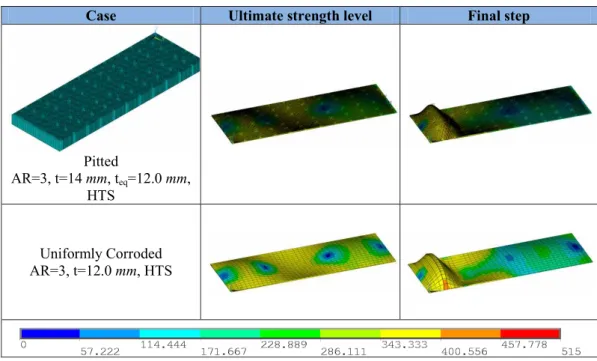
A numerical database including the characteristics of all cases and their corresponding finite element results is created in the background. Due to wide extent of the cases that were analysed in this research study, the results are shown only for some limited cases. Deformation mode and spread of plasticity for some pitted plates are shown in Tables 6, 7, 8 and 9 for two different strength levels. Also, average stress-average strain relationship for those pitted plates is represented by solid line in Figures 6, 7, 8 and 9. The number of half-waves in the ultimate strength modes of the plates is equal to the aspect ratio of the plates. It can be seen that the half-waves in the ultimate strength mode of the pitted plates are of regular form.
Table 6 Deformation mode and spread of plasticity for the plate of dimensions 2400×800 mm (AR=3),D=20
mm,DOP=20%,RDP=4, made of NS Steel (magnification factor for deformation mode: 10).
Table 7 Deformation mode and spread of plasticity for the plate of dimensions 2400×800 mm (AR=3),D=20
mm,DOP=30%,RDP=4, made of HTS Steel (magnification factor for deformation mode: 10).
Table 8 Deformation mode and spread of plasticity for the plate of dimensions 2400×800 mm (AR=3),D=30
Table 9 Deformation mode and spread of plasticity for the plate of dimensions 1600×800 mm (AR=2),D=30
mm,DOP=20%,RDP=10, made of NS Steel (magnification factor for deformation mode: 10).
Figure 7 Comparison of average stress-average strain relationships for a pitted plate (with AR=3, t=14 mm, D=20 mm, DOP=30%, RDP=4, tavg=13.5 mm,) and its equivalent uniformly corroded plate (with AR=3, teq=12.01 mm) made of HTS steel.
Figure 9 Comparison of average stress-average strain relationships for a pitted plate (with AR=2, t=10 mm, D=30 mm, DOP=20%, RDP=10, tavg=9.79 mm,) and its equivalent uniformly corroded plate (with AR=2, teq=9.51 mm) made of NS steel.
5 PROPOSAL ON EFFECTIVE THICKNESS
In order to reach an effective thickness proposal, first a series of elastic-plastic large deflection finite element analyses is performed on the uncorroded plates under longitudinal compression. The thickness of the plates ranges from 7.5mm to 19mm. The values of the ultimate strength and final strength (atε/εY =3) are extracted out of the finite element analyses. These strength
values are then normalised or nondimensionalised byσY, Fig. 10. Based on the results in Fig.
10, the following equations can be derived
σU lt/σY =1.4908e− 0.2968β
(6)
σF inal/σY =0.7570e−0.2022β (7)
On the other hand, the following formulation can be written for a pitted plate
Vcorroded=npit.Vpit (8)
and
tavg=
Vuncorroded−Vcorroded
A (9)
wheretavgrepresents the average thickness of the pitted plate based on the volume of the pits.
The value of tavg is calculated for each case and registered within the database of analyses.
In order to reach a preliminary formulation for the value of the equivalent thickness of the pitted plate, two conditions are considered to be fulfilled here. The first condition describes that the ultimate strength of the pitted plate is to be equal to the ultimate strength of the uncorroded plate given by Eq. (6). And also the other condition is equality of the final strength of the pitted plate with the final strength of the uncorroded plate given by Eq. (7). For each case of the analysed pitted plates in the database of the current research study, these two conditions are used in order to obtain the nearest possible value of the thickness for an uncorroded plate yielding approximately the same values of the strengths as the pitted plate. These values of the equivalent thicknesses are registered in the database. Figure 11 demonstrates the relationship between the values ofteqandtavg, which can be easily formulated
as
Figure 11 The relationship between strength values normalised by the value of yield strength and slenderness ratio for uncorroded plate.
In a trial and error attempt and based on the developed database of the pitted plates, a coefficientαis defined as below in order to establish a relationship between different parameters describing the status of any pitted plate
α=t1.11⎡⎢⎢⎢
⎢⎣
(Dpit Hpit)
0.05
AR0.05DOP0.03
⎤⎥ ⎥⎥
⎥⎦ (11)
The parameters and their powers included in the Eq. (11) are so adopted that a relationship between the coefficient αand effective thicknessteq can be extracted. Obtaining the values of αfor each case within the database, the following relationship can be easily written
teq=0.697α+0.47 (12)
The relationship between the values ofteqandαis shown in Fig. 12 from which the following
lower bound value for the teq can be obtained
Figure 12 The relationship between the values of and.
teq(lower Bound)=0.697α−0.7 (13)
Eqs. (12) or (13) can be used in order to obtain estimates of the equivalent thickness for a pitted plate. Besides, as an alternative way to do this, the value of equivalent mean corrosion depth of the pitted plate (µ) is determined as
µ=t−tavg (14)
Figure 13 shows the scatter of the values for µ , based on which the following relationship can be obtained in order to give an estimate of the effective thickness of the pitted plate
Figure 13 The relationship between the upper bound value of and.
where
µ(upper bound)=1.51207µ+1.67793 (16)
For each case of the pitted plates in Tables 6 to 9, the results for the equivalent uniformly corroded plates are also shown. There is a high degree of coincidence among the results for any of the pitted plates and its corresponding equivalent uniformly corroded plate. Also, a comparison between the average stress-average strain relationships for the pitted plates and their corresponding equivalent uniformly corroded plates is given in Figs. 6 to 9, for some limited cases. A very good agreement is demonstrated among them. This reveals the usefulness of the proposed equations for estimation of the equivalent thickness of the pitted plates.
6 CONCLUSIONS
in the strength analysis procedures of plated structures suffering pitting corrosion. This can be achieved through replacement of the pitted plates with their equivalent uncorroded plates. Although emphasize was concentrated on the in-plane uni-axial compressive loading of the pitted plates in this study, investigation of their behaviours under other types of the loads remains as future works.
References
[1] Asm international corrosion. asm handbook. 13, 2001.
[2] Ansys 11.0 reference manual, ansys inc., 2008.
[3] H.K.K. Amlashi and T. Moan. On the strength assessment of pitted stiffened plates under biaxial compression loading. InIn: 24th international conference on offshore mechanics and arctic engineering, Halkidiki, Greece, 2005.
[4] J.C. Daidola, J. Parente, I.R. Orisamolu, and K.T. Ma. Residual strength assessment of pitted plate panels. 1997.
[5] S. Saad Eldeen and C. Guedes Soares. Effect of pitting corrosion on the collapse strength of rectangular plates under axial compression. InProceedings of Analysis and Design of Marine Structures, pages 231–236, Potugal, 2009.
[6] M. Fujikubo, S. Harada, T. Yao, M.R. Khedmati, and D. Yanagihara. Estimation of ultimate strength of continuous stiffened panel under combined transverse thrust and lateral pressure, part 2: Continuous stiffened panel. Marine Structures, 18:411417, 2005.
[7] M. Fujikubo, T. Yao, M.R. Khedmati, S. Harada, and D. Yanagihara. Estimation of ultimate strength of continuous stiffened panel under combined transverse thrust and lateral pressure, part 1: Continuous plate. Marine Structures, 18:383410, 2005.
[8] Y. Huang, Y. Zhang, G. Liu, and Q. Zhang. Ultimate strength assessment of hull structural plate with pitting corrosion damnification under biaxial compression. Ultimate Strength of Plates with Random Fields of Corrosion, 4:363–370, 2008.
[9] Y. Huang, Y. Zhang, G. Liu, and Q. Zhang. Ultimate strength assessment of hull structural plate with pitting corrosion damnification under biaxial compression. Ocean Eng, 13:1503–1512, 2010.
[10] X. Jiang and C. Guedes Soares. Ultimate compressive capacity of mild steel plates with single and double side corrosion pits. InProceedings of the TEAM 2009, Kaohsiung, Taiwan, 30 November-3 December 2009.
[11] M.R. Khedmati. Ultimate strength of ship structural members and systems considering local pressure loads. PhD thesis, Graduate School of Engineering, Hiroshima University, September 2000.
[12] M.R. Khedmati, Z.H.M.E. Nouri, and M.M. Roshanali. An effective thickness proposal for strength evaluation of both-sides randomly corroded steel plates under uniaxial compression.Steel and Composite Structures. Accepted for Publication.
[13] M.R. Khedmati, Z.H.M.E. Nouri, and M.M. Roshanali. Strength of steel plates with both-sides randomly distributed with corrosion wastage under uniaxial compression. Thin Walled Struct, 49(2):325342, 2011.
[14] A.F. Mateus and J.A. Witz. On the buckling and post-buckling of corroded steel plates. 1998.
[15] T. Nakai, H. Matsushita, and N. Yamamoto. Effect of pitting corrosion on local strength of hold frames of bulk carriers (1st report). Mar Struct, 17:403–432, 2004.
[16] T. Nakai, H. Matsushita, and N. Yamamoto. Effect of pitting corrosion on local strength of hold frames of bulk carriers (2nd report) lateraldistortional buckling and local face buckling.Mar Struct, 17:612641, 2004.
[17] Z.H.M.E. Nouri, M.R. Khedmati, and M.M. Roshanali. Degradation of the compressive strength of unstiff-ened/stiffened steel plates due to both-sides randomly distributed corrosion wastage. Latin American Journal of Solids and Structures, 7(3):335–367, 2010.
[18] D. Ok, Y. Pu, and A. Incecik. Computation of ultimate strength of locally corroded unstiffened plates under uniaxial compression.Mar Struct, 20:100114, 2007.
[20] J.K. Paik, J.M. Lee, and M.J. Ko. Ultimate shear strength of plate elements with pit corrosion wastage.Thin Walled Struct, 42:11611176, 2004.
[21] J.K. Seo, B.J. Kim, H.S. Ryu, Y.C. Ha, and J.K. Paik. Validation of the equivalent plate thickness approach for ultimate strength analysis of stiffened panels with non-uniform plate thickness. Thin Walled Struct, 49:753–761, 2011.
[22] Dunbar TE and et al. A computational investigation of the effects of localized corrosion on plates and stiffened panels. Mar Struct, 17(5):385402, 2004.
[23] A.P. Teixeira and C. Guedes Soares. Probabilistic modelling of the collapse behaviour of plates with random corrosion fields. InProceedings of the 2005 Conference on Numerical Methods in Engineering, pages 4–7, Granada, Spain, SEMNI, July 2005.
[24] A.P. Teixeira and C. Guedes Soares. Probabilistic modelling of the ultimate strength of plates with random fields of corrosion. InProceedings of the 5th Computational Stochastic Mechanics Conference (5CSM), pages 21–23, Rhodes-Greece, June 2006.
[25] Y. Ueda and T. Yao. The influence of complex initial deflection on the behaviour and ultimate strength of rectangular plates in compression. J. of Const. Steel Research, 5:265–302, 1985.
[26] T. Yao, P.I. Nikolov, and Y. Miyagawa. Influence of welding imperfections on stiffness of rectangular plates under thrust. In K. Karlsson, L.E. Lindgren, and M. Jonsson, editors,Proc. of IUTAM Sump. on Mechanical Effects of Welding, pages 261–268. Springer-Verlag, 1992.

![Figure 4 Real distribution of initial deflection or so-called thin-horse mode initial deflection [7, 11].](https://thumb-eu.123doks.com/thumbv2/123dok_br/18884550.423516/7.892.190.660.605.805/figure-real-distribution-initial-deflection-called-initial-deflection.webp)
![Table 1 Coefficients of thin-horse mode initial deflection as a functions of plate aspect ratio [26]](https://thumb-eu.123doks.com/thumbv2/123dok_br/18884550.423516/8.892.140.801.149.226/table-coefficients-horse-initial-deflection-functions-plate-aspect.webp)

![Figure 5 (a) Test rig set up with test specimen used by Nakai et al. [1], (b) An example of test specimen (all dimensions in mm), (c) Pit distribution in different specimens.](https://thumb-eu.123doks.com/thumbv2/123dok_br/18884550.423516/10.892.255.685.182.460/figure-specimen-example-specimen-dimensions-distribution-different-specimens.webp)