*e-mail: [email protected]
1. Introduction
Amorphous alloys or metallic glasses are a relatively new class of materials with a speciic combination of technologically interesting properties. These materials are characterized by the absence of formation of a regular crystal structure, and thus have a structural coniguration similar to that of frozen liquid, where the process of nucleation and growth of a crystalline phase have been kinetically supplanted1,2.
This structural coniguration provides some properties that are frequently superior to those of crystalline materials, e.g., higher mechanical strength, improved magnetic, and/or electrical properties, and increased corrosion resistance.
The amorphous or glassy state is thermodynamically unstable and is structurally susceptible to devitriication when heated above the crystallization temperature (Tx), or when subjected to prolonged isothermal treatments below Tx. The process of devitriication of certain alloys can be controlled to favor the formation of a nanocrystalline structure or to obtain only a small fraction of crystallized material, with nanoparticles precipitated and incorporated into the residual amorphous phase. Various alloys that have such nanostructures or nanocrystals embedded in the matrix of an amorphous microstructure show better mechanical properties than those of alloys in the pure amorphous state. Thus, studies of controlled devitriication have attracted much interest in various research areas including physics, chemistry and materials science3.
Such improved properties that are dependent on the microstructure have been studied exhaustively based on knowledge of the kinetics of crystallization of amorphous alloys allied to techniques such as microscopy and X-ray diffraction (DRX) analysis. Kinetic analyses can be performed using thermal analysis techniques such as isothermal or non-isothermal Differential Scanning Calorimetry (DSC)4.
Considering the importance of both thermal stability and microstructural evolution during controlled devitriication on the resulting properties of amorphous alloys, the purpose of this work was to characterize the crystallization of the amorphous Ti57.4Cu33.4Ni9.2 alloy from the kinetic standpoint and based on a structural analysis by DSC, DRX and by transmission electron microscopy (TEM). The kinetic analysis was performed using the Kissinger method5.
The Ti-based bulk metallic glasses offer a combination of high speciic strength, low density and relative low cost as well as other advantages of BMGs6-8. Ti-based metallic glasses presented yield stresses of up to 2200 MPa, which are much higher than the corresponding values for typical commercial Ti-based alloys in the range of 1000 MPa9. The good glass former Ti57.4Cu33.4Ni9.2 was selected based on two distinct criteria: (i) the minimum topological instability criterion (λ-criterion) and (ii) the average difference in the alloy’s electronegativity, and assuming a synergistic effect between them10-13. The topological instability parameter (λ) can be calculated from atomic radii or molar volumes of the compounds with the expression12:
Crystallization Behavior of Amorphous Ti
51.1Cu
38.9Ni
10.0Alloy
Marcio Andreato Batista Mendesa*, Claudio Shyinti Kiminamib, Walter José Botta Filhob, Claudemiro Bolfarinib, Marcelo Falcão de Oliveirac, Michael Joseph Kaufmand
aDepartamento de Engenharia de Materiais, Universidade Federal Tecnológica do Paraná – UTFPR,
Av. dos Pioneiros, 3131, CEP 86036-370, Londrina, PR, Brazil
bDepartamento de Materiais, Universidade Federal de São Carlos – UFSCar, São Carlos, SP, Brazil
cDepartamento de Engenharia de Materiais, Aeronáutica e Automobilística,
Universidade de São Paulo – USP, São Carlos, SP, Brazil
dDepartament of Metallurgical and Materials Engineering, Colorado School of Mines,
Colorado, United States of America
Received: November 11, 2014; Revised: November 11, 2015
A good glass former, Ti57.4Cu33.4Ni9.2, was selected using the topological instability criterion (lambda criterion) and the average electronegativity approach. The crystallization behavior and microstructural development of amorphous melt-spun ribbons of this new composition in response to heat treatment were investigated using a combination of differential scanning calorimetry (DSC), transmission electron microscopy (TEM) and X-ray diffraction (XRD). The results indicate that the crystallization of the Ti57.4Cu33.4Ni9.2 alloy takes place through of three exothermic reactions with the nucleation of TiCu, Ti2Cu and Ti2Ni. The kinetics of crystallization were investigated by DSC, and the kinetic parameters were determined using Kissinger’s method.
i i 0 Vm 1 Vm
λ ≅ χ∑ − (1)
where χi is the molar fraction of any component element in a given stoichiometric compound (or simple metal), Vmi is the molar volume of the solute elements and Vm0 is the molar volume of the compound. On the other side, the average in electronegativity among the elements of an alloy is directly related to its formation enthalpy (∆H) and its glass stability5.
2. Experimental Procedures
A Ti57.4Cu33.4Ni9.2 ingot was prepared by non-consumable arc melting of mixtures of pure Ti (99.97 wt.%), Ni (99.9 wt.%) and Cu (99.997 wt.%) in a Ti-gettered, high-purity argon atmosphere. The alloy was remelted under a high purity argon atmosphere in a quartz tube and injected through a nozzle onto a Cu wheel (200 mm diameter) rotating at a peripheral velocity of 30 ms-1 to produce rapidly-solidiied ribbons by melt-spinning. The ribbons, with a width of ~ 2 mm and a thickness of about 20 microns, exhibited qualitatively a bending ductility of 180° and were characterized by X-ray diffraction (XRD) using Cu-Kα radiation (Philips X-Pert) and by transmission electron microscopy (Philips CM12 TEM with EDAX EDS). The crystallization process was evaluated using DSC (Netzsch 200 Maya F3) at heating rates of 5, 10, 20 and 40 K/min under an argon gas low. To investigate the structural transformations by X-ray diffraction and by TEM, the melt-spun ribbons were heated from room temperature to different temperatures according to the DSC result (683, 713, 748, 788 K, 833 K and 973 K) in a DSC (without isothermal holding periods). The TEM specimens were prepared by twin-jet electropolishing in a solution of 66% methanol and 33% nitric acid at 243 K (25 V and 50 mA) and by argon ion milling in a Gatan dual ion mill (~1 mA and 6 kV).
3. Results and Discussion
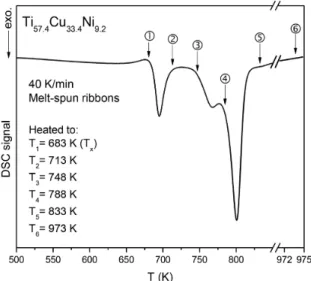
Figure 1 presents the DSC thermogram of the alloy, indicating the temperature at which each heat treatment was performed. This igure depicts a three-stage devitriication process. Figure 2 shows the X-ray diffractograms after each heat treatment. It can be seen that the crystallization of the amorphous alloy was observed above 748 K with simultaneous precipitation of TiCu, Ti2Cu and Ti2Ni. However, in view of the large energy released in the third exothermic peak of the DSC thermogram, the amount of residual amorphous phase at this temperature of 748 K is still large. The melt-spun ribbons are fully crystallized above 833 K and contain the same TiCu, Ti2Cu and Ti2Ni phases.
From the XRD patterns exhibited in Figure 2, the irst and second heat treatments (T1 = 683 K and T2 = 713 K) present a diffused peak characteristic of amorphous structures. In the third treatment (T3 = 748 K) it is observed the formation of the TiCu, Ti2Cu and Ti2Ni phases, which probably were nucleated in the irst exothermic reaction (peak 1 of the thermogram) and were not detected in the X-ray diffraction analysis due to its reduced size. However, this heat treatment at 748 K was performed near of the second exothermic peak, which may have provided suficient energy for the growth
Figure 1. DSC thermogram of the ribbon, indicating the temperatures selected for the heat treatments.
of these nucleated phases. Finally, in the last heat treatment (T6 = 973 K), in which the amorphous alloy was completely crystallized, it is observed the presence of the same phases: Ti2Cu (I4/mmm), TiCu (P4/nmm) and Ti2Ni (Fd3m).
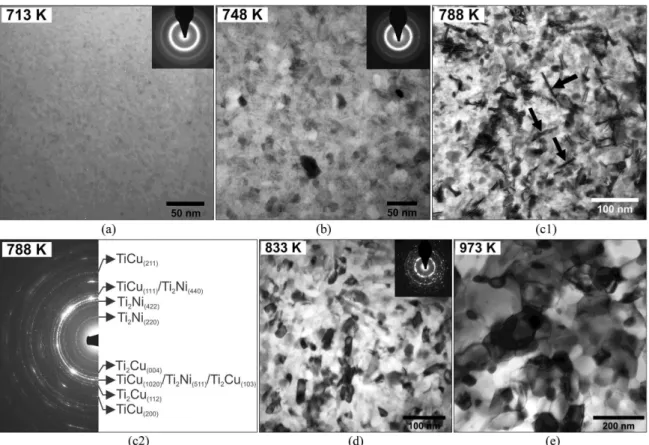
Figure 3 shows the bright-ield TEM micrographs and the corresponding SAPDs of the crystallization process. In (a) it is shown the micrographs of the second heat treatment, revealing an amorphous structure, in accordance with the X-ray analysis. In the next heat treatment shown in Figure 3b (T3 = 748 K), it is observed the presence of a nanocrystalline structure with grains larger than the previously heat treated sample; besides, the selected area diffraction pattern (SADP) shows rings pattern characteristic of an nanocrystalline material. The fourth heat treatment (T4 = 788 K) is exhibited in Figure 3c1 and c2, where it is observed larger grains and more well-deined rings patterns in the SADP, which were identiied as Ti2Cu, Ti2Ni and TiCu, in accordance with the X-ray analysis. Figure 3c1 also shows the same morphological characteristics of Guinier-Preston (GP) zones (indicated by arrows) previously reported by Ishida & Sato14 for compositions of the Ti
51.5Ni48.5-xCux (x =
0-15.4) system; however, more studies are needed to conirm this observation in the present work. Figure 3d shows the micrograph of the sample heated to 833 K, where it is observed larger grains (~45 nm) and it is also possible to verify the rings pattern in the SADP with the same characteristic of the previously sample (Figure 3c2), indicating the presence of the same crystallized phases (Ti2Cu, Ti2Ni and TiCu). Finally, Figure 3e shows the sample heated to 973 K, approximately 150 K above the last crystallization peak, and the structure consisted of the same three phases previously crystallized.
Figure 2. Diffractogram of the ribbon heated to: 683, 713, 748, 833 and 973 K.
however, further analysis is required for conirming this type of devitriication. Figure 4b exhibits the microdiffraction patterns of the region and, in order to compare, it is also shown the microdiffraction patterns of the sample heated to 788 K (see Figure 3c2), revealing the presence of the same phases in both heat-treated samples.
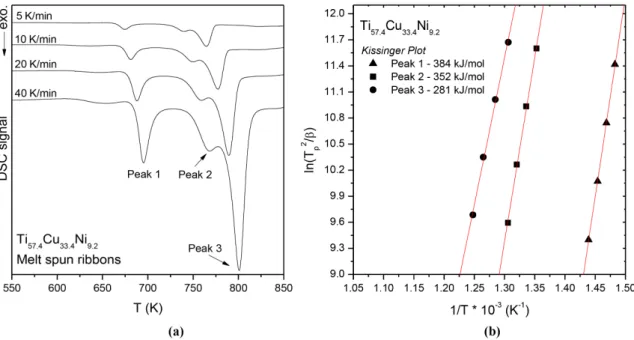
The DSC thermograms and thermal parameters of the crystallization process of the Ti51.1Cu38.9Ni10.0 glass obtained at different heating rates are shown in Figure 5a and
Table 1, respectively. Upon heating, the melt-spun ribbons exhibited three exothermic crystallization peaks as well as an endothermic reaction of structural relaxation, which characterizes the glass transition temperature (Tg). The glass transition temperature and both exothermic peaks shift to higher values with increasing heating rates, indicating the presence of kinetic effects. Figure 5b illustrates the result of applying the Kissinger method to each exothermic peak, where it is shown that the activation energy EA of the two
Figure 5. (a) DSC thermogram of the as-quenched ribbon at continuous heating rates of 5, 10, 20 and 40 K/min; (b) Kissinger plot of ln(Tp2/β) vs 1/T.
irst reactions is roughly the same, indicating that a similar nucleation and growth process occurs in the irst and second exothermic reactions, whereas a dominant growth process occurs in the third reaction. These activation energy values are in agreement with previous reports in literature15,16.
4. Conclusions
The results indicate that the crystallization of the Ti57.4Cu33.4Ni9.2 alloy takes place through of three exothermic reactions with the nucleation of TiCu, Ti2Cu and Ti2Ni, occurring during the stages of crystallization. In the irst stage of crystallization, it occurs with a high nucleation Table 1. Thermal parametersa obtained from the thermal analyses.
β (K/min) Tg (K) Tx (K) T1 (K) T2 (K) T3 (K) H1 (J/g) H2b (J/g)
5 627.1 664.2 674.4 739.0 765.5 –18.5 –98.6
10 635.9 671.0 680.9 748.5 778.3 –20.1 –102.3
20 646.4 677.8 687.7 757.3 790.6 –21.3 –103.0
40 650.9 685.6 694.9 765.8 801.3 –23.5 –106.4
aGlass transition temperature (T
g); Crystallization onset temperature (Tx); temperatures at the exothermic peaks (T1 and T2); transformation enthalpies (H1 and H2); heating rate (β).
bTotal of second and third exothermic peaks.
rate, resulting in a nanoscale microstructure. On the other hand, the heat-treated sample at 680 K for 1 h, before the crystallization temperature (Tx), suggests a eutectic-like lamellar structure with the presence of the TiCu, Ti2Cu and Ti2Ni phases. The results also indicate that a similar nucleation and growth process occurs in the irst and second exothermic reactions, whereas a dominant growth process occurs in the third reaction.
Acknowledgements
The authors would like to thank FAPESP and CNPq for inancial research support.
References
1. Wang WH, Dong C and Shek CH. Bulk metallic glasses. Materials Science and Engineering R Reports. 2004; 44(2-3):45-89. http://dx.doi.org/10.1016/j.mser.2004.03.001.
2. Klement K, Willens RW and Duwez P. Non-crystalline structure in solidified gold-silicon alloys. Nature. 1960; 187(4740):869-870. http://dx.doi.org/10.1038/187869b0.
3. Louzguine-Luzgin DV and Inoue A. Nano-devitrification of glassy alloys. Journal of Nanoscience and Nanotechnology. 2005; 5(7):999-1014. http://dx.doi.org/10.1166/jnn.2005.158. PMid:16108420.
4. Starink MJ. Analysis of aluminium based alloys by calorimetry: quantitative analysis of reactions and reaction kinetics.
International Materials Reviews. 2004; 49(3–4):191-226. http:// dx.doi.org/10.1179/095066004225010532.
5. Kissinger HE. Reaction kinetics differential thermal analysis.
Analytical Chemistry. 1957; 29(11):1702-1706. http://dx.doi. org/10.1021/ac60131a045.
6. Ma C, Ishihara S, Soejima H, Nishiyama N and Inoue A.
Formation of new Ti-based metallic glassy alloys. Materials Transactions. 2004; 45(5):1802-1806. http://dx.doi.org/10.2320/ matertrans.45.1802.
7. Sheng WB. Correlations between critical section thickness and glass-forming ability criteria of Ti-based bulk amorphous alloys. Journal of Non-Crystalline Solids. 2005; 351(37-39):3081-3086. http://dx.doi.org/10.1016/j.jnoncrysol.2005.07.021.
8. Gargarella P, Pauly S, Song KK, Hu J, Barekar NS, Khoshkhoo
MS, et al. Ti-Cu-Ni shape memory bulk metallic glass composites.
Acta Materialia. 2012; 61(1):151-162. http://dx.doi.org/10.1016/j. actamat.2012.09.042.
9. Oliveira MF, Pereira FS, Ramasco BT, Kiminami CS, Botta WJ and Bolfarini C. Glass formation of alloys selected by lambda
and electronegativity criteria in the Ti–Zr–Fe–Co system. Journal of Alloys and Compounds. 2010; 495(2):316-318. http://dx.doi.org/10.1016/j.jallcom.2009.10.255.
10. Sá Lisboa RD, Bolfarini C, Botta WJF and Kiminami CS. Topological instability as a criterion for design and selection of aluminum-based glass-former alloys. Applied Physics Letters. 2005; 86(21):211904. http://dx.doi.org/10.1063/1.1931047.
11. Kiminami CS, Sá Lisboa RD, Oliveira MF, Bolfarini C and Botta WJ. Topological instability as a criterion for design and selection of easy glass-former compositions in Cu-Zr based systems. Materials Transactions. 2007; 48(7):1739-1742. http://dx.doi.org/10.2320/matertrans.MJ200745.
12. Oliveira MF, Pereira FS, Bolfarini C, Kiminami CS and Botta WJ. Topological instability, average electronegativity difference and glass forming ability of amorphous alloys. Intermetallics. 2009; 17(4):183-185. http://dx.doi.org/10.1016/j.intermet.2008.09.013. 13. Botta WJ, Pereira FS, Bolfarini C, Kiminami CS and Oliveira
MF. Topological instability and electronegativity effects on the glass-forming ability of metallic alloys. Philosophical Magazine Letters. 2008; 88(11):785-791. http://dx.doi. org/10.1080/09500830802375622.
14. Ishida A and Sato M. Microstructures of crystallized Ti51.5Ni48.5−xCux (x = 23.4–37.3) thin films. Intermetallics. 2011; 19(7):900-907. http://dx.doi.org/10.1016/j.intermet.2011.02.005.
15. Yang YJ, Xing DW, Shen J, Sun JF, Wei SD, He HJ, et al.
Crystallization kinetics of a bulk amorphous Cu–Ti–Zr–Ni alloy investigated by differential scanning calorimetry. Journal of
Alloys and Compounds. 2006; 415(1-2):106-110. http://dx.doi. org/10.1016/j.jallcom.2005.07.062.
16. Patel AT and Pratap A. Kinetics of crystallization of Zr52Cu18Ni14Al10Ti6