ABSTRACT
Histologic grading and nucleolar organizer regions
in oral squamous cell carcinomas
João Adolfo Costa HANEMANN1, Marta MIYAZAWA2, Mireile São Geraldo dos Santos SOUZA3
1- DDS, PhD, Professor, Department of Stomatology, Federal University of Alfenas, Alfenas, MG, Brazil. 2- DDS, PhD, Department of Stomatology, Bauru School of Dentistry, University of São Paulo, Bauru, SP, Brazil.
3- DDS, PhD, Department of Oral Pathology, Dental School, Integrated Federal Colleges of Diamantina, Diamantina, MG, Brazil.
Corresponding address: Dr. João Adolfo Costa Hanemann - Universidade Federal de Alfenas - Disciplina de Estomatologia - Rua Gabriel Monteiro da Silva, 700 - 37130-000 - Alfenas - Minas Gerais - Brasil - Phone: +55-35-3299-1430 - Fax: +55-35-3299-1062 - e-mail: [email protected]
Received: July 28, 2009 - Modiication: March 22, 2010 - Accepted: September 9, 2010
O
bjective: The purposes of this study were to histologically assess different types of oral squamous cell carcinoma and the silver-binding nucleolar organizer region (AgNOR) morphology in neoplastic cells, as well as to quantify the number of AgNORs in each type of carcinoma in order to relate AgNOR count and histologic grading. Material and Methods: Twenty-eight cases of oral squamous cell carcinoma were divided into 4 groups, namely well-differentiated, moderately differentiated, poorly differentiated, and undifferentiated. For NOR study, 3-µm-thick sections were stained with 50% aqueous silver nitrate solution. The predominant microscopic pattern of NORs was determined. Quantitative analyses of NORs were obtained of all cells present on each histological ield using a 0.025 mm2eyepiece graticule. Different histological ields were analyzed until the total number of NORs was 120 cells for each tumor. Kruskall-Wallis test was applied to compare the groups of sample data at a signiicance level of p=0.05. Results: The mean number of AgNORs per nucleus was 3.20 for the well-differentiated group, 5.33 for the moderately differentiated one, 8.27 for the poorly differentiated one, and 10.08 for the undifferentiated one. AgNOR count was signiicantly different (p<0.05) among all of the studied groups. Conclusion: AgNOR staining technique seems to be a useful diagnostic tool since differences in AgNOR numeric values can be identiied in the different types of oral squamous cell carcinoma. This technique is easy to handle and inexpensive, thus justifying its large use in histopathology.
Key words: Oral cancer. Nucleolar organizer regions. Histologic grading.
INTRODUCTION
A persistent dilemma for histopathologists and clinicians resides in determining the malignancy grade of tumors. Traditionally, this determination has been based on evaluation of subjective aspects such as size and nuclear irregularity, loss of polarity, mitotic index and neoplastic invasion. However, more practical and reliable methods are required. Several histopathological grading systems for oral squamous cell carcinoma (OSCC) have been proposed. Nowadays, the most accepted is the
one proposed by Anneroth, Batsakis and Luna4 (1997) since it evaluates malignant cells and the relationship between the tumor and the underlying connective tissue.
Due to the close relationship between nucleolar
organizer regions (NORs) and cellular activity, NOR size and number can reflect or predict cell proliferation, transformation, or evident malignancy12,14,20,23,24. Recently, NORs have received special attention from pathologists and techniques for NOR research have been widely studied by histopathologists6,14. The silver-staining technique of argyrophilic nucleolar organizer regions (AgNORs) is
simple, reproducible, and very speciic. The number of AgNORs in the nucleus may relect the activation
Taking into account that OSCC presents different
histological grade and that chromosome number and NORs are substantially altered in malignant cells, the purposes of this paper were to histologically assess different OSCC types and NOR morphology in malignant cells, as well as to quantify, through appropriate techniques, the number of NORs in each type of the studied carcinoma.
MATERIAL AND METhODS
Twenty-eight samples of OSCC, recorded at the Anatomic Pathology Laboratory Archives of the Dental School of the Integrated Federal Colleges of Diamantina (9 cases) and the Dental School of
the Pontiical Catholic University of Minas Gerais
(19 cases) from 1986 to 1999, were obtained.
Five-µm-thick histologic sections were stained with
hematoxylin and eosin (He) and analyzed under light microscopy. Tumor histological grade was
determined according to Anneroth, Batsakis and
Luna4 (1987) criteria.
For NOR study, 3-µm-thick sections were
submitted to the technique proposed by Ploton, et al.13 (1986). The sections were deparafinized by a rinse in xylene for 30 min at 57°C, then left at room temperature for 20 min, and initially dehydrated in 100% alcohol. The slides were immersed in acetic acid/ethanol solution (1:3) for 5 min, and washed with 100% alcohol. Subsequently, they were removed and left to dry. After, the slides were washed with 70% ethanol during 5 min and with distilled water. The 50% aqueous silver nitrate solution was mixed in 2 g/dL gelatin solution dissolved in 1g/dL aqueous formic acid in a 1:2 proportion. This solution was dropped on the sections which were incubated in humid chamber at 45°C for 30 min. After vigorous wash with distilled water at 45°C, the sections were dehydrated with
ethanol in increasing concentrations, cleared with xylene, and mounted using Permount®.
The predominant microscopic pattern of NORs distribution was determined for each studied tumor group. For quantitative analysis of NORs, images from each field were obtained from a Studar binocular light microscope with immersion lens and
1,000x inal magniication. The number of NORs
in the nuclei was obtained of all cells present on
each histological ield using a 0.025 mm2 eyepiece graticule.
Different histological ields were analyzed until
the total number of NORs was 120 cells for each tumor. This procedure was repeated by the same pathologist, obtaining 2 counts of 120 cells by tumor, and the average number of NORs/nuclei for each case was calculated. When several NORs were closely interspaced, they were counted as
one structure. Kruskall-Wallis test was applied to compare the groups of sample data at a signiicance
level of p=0.05.
RESULTS
Clinical data obtained from medical records showed that, according to the tumor site, nine cases were located on the alveolar ridge, seven on
the loor of mouth, three on the lower lip, two on
the retromolar area, two on the oral tongue, two on the hard palate, one on the gingiva, and one on the buccal mucosa. Only in one case the site was
unknown. The age of the patients at the time of
neoplasm diagnosis ranged from 38 to 84 years old. Regarding to the gender, 20 were male and eight were female. From the studied patients, 12 were
white, nine mulattoes, six black, and the race of one patient was unknown.
AgNORs were seen through light microscope
inside the cell nuclei as black to brownish dots,
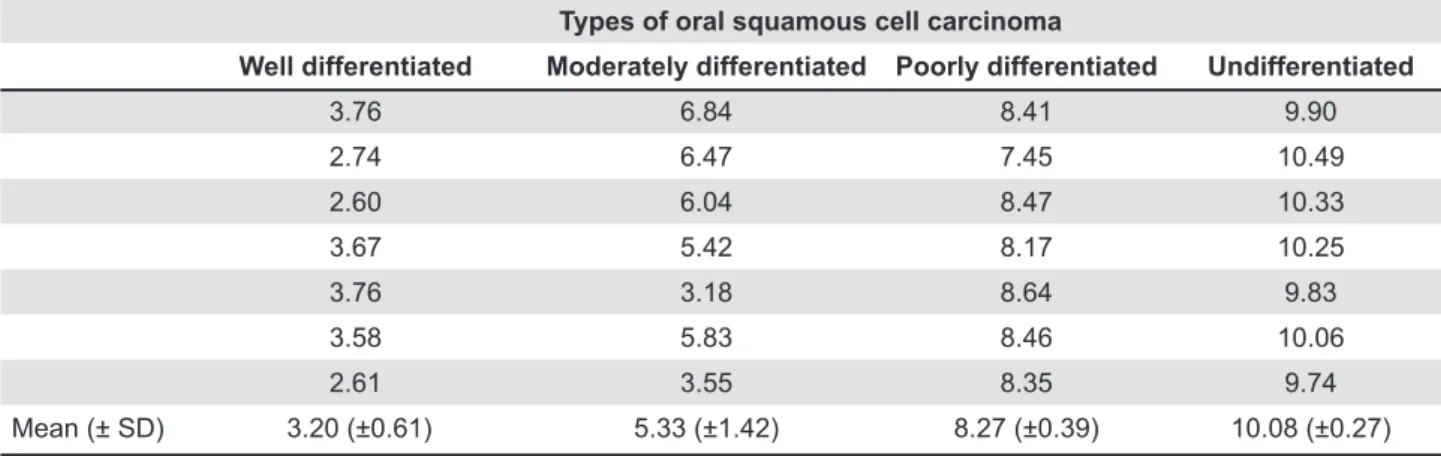
Types of oral squamous cell carcinoma
Well differentiated Moderately differentiated Poorly differentiated Undifferentiated
3.76 6.84 8.41 9.90
2.74 6.47 7.45 10.49
2.60 6.04 8.47 10.33
3.67 5.42 8.17 10.25
3.76 3.18 8.64 9.83
3.58 5.83 8.46 10.06
2.61 3.55 8.35 9.74
Mean (± SD) 3.20 (±0.61) 5.33 (±1.42) 8.27 (±0.39) 10.08 (±0.27)
Table 1- Mean number of nucleolar organizer regions (NORs)/nucleous in the oral squamous cell carcinoma groups (Kruskal-Wallis test)
(SD= standard deviation); Kruskal-Wallis calculated value: 23.9664; X2 value for three free degrees: 23.9700; Probability
Compared samples (two by two comparisons)
Mean differences Critical values (p) p value
0.05 0.01 0.001
WDxMD 47.143 32.261 43.718 58.535 p=0.01
WDxPD 128.571 32.261 43.718 58.535 p=0.001
WDxUD 198.571 32.261 43.718 58.535 p=0.001
MDxPD 81.429 32.261 43.718 58.535 p=0.001
MDxUD 151.429 32.261 43.718 58.535 p=0.001
PDxUD 70.000 32.261 43.718 58.535 p=0.001
Table 2- Comparison between average numbers of oral squamous cell carcinoma groups analysed by Kruskal-Wallis test
WD: well-differentiated; MD: moderately differentiated; PD: poorly differentiated; UD: undifferentiated.
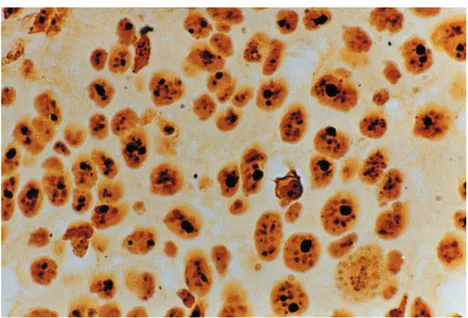
Figure 1- Microscopic aspect of a well-differentiated oral squamous cell carcinoma (OSCC) presenting few nucleolar organizer regions (NORs)/nucleus (1,000x)
since the yellow staining allowed easy visualization of individual NORs. The number and diameter of the NORs, usually round in shape, were variable and either diffusely distributed all over the nuclear area or grouped in a wide, round and less intensely stained structure. The grouped AgNORs had smaller diameter and were more variable in amount than those diffusely distributed.
The number of AgNORs in every OSCC studied is shown in Table 1. The mean number of AgNORs per
nucleus was 3.20 (±0.61) for the well-differentiated group (Figure 1), 5.33 (±1.42) for the moderately differentiated one (Figure 2), 8.27 (±0.39) for the poorly differentiated one (Figure 3), and 10.08 (±0.27) for the undifferentiated one (Figure 4).
Kruskal-Wallis test showed a statistically signiicant
difference (p=0.01) among the mean numbers of AgNORs in each studied group. There were also
statistically signiicant differences (p=0.01) for all
two-by-two comparisons of groups (Table 2).
DISCUSSION
Oral cancer is a major public health issue worldwide and it remains a highly lethal and
disiguring disease3. Despite considerable advances in the diagnostic and therapeutic techniques17, OSCC continues to present a poor prognosis with an estimated 5-year survival rate of only 56% in the United States and Western europe10. Moreover, both the incidence and mortality of OSCC have increased over the past decades. Knowledge of the prognostic Figure 3- Poorly differentiated oral squamous cell carcinoma (OSCC) presenting great amount and highly stained nucleolar organizer regions (NORs) (1,000x)
factors at the beginning of treatment can be crucial in determining the appropriate therapy for each patient. Although various biological and molecular factors have been proposed as prognostic factors in OSCC, so far these factors had no impact on routine clinical care. Comprehensive histopathologic staging of pathological specimens is still an important determinant of postoperative management and prognosis prediction5.
The understanding of the molecular basis of this variability should lead to the development of targeted therapies as well as to improvement in diagnosis specificity and sensitivity. Histopathological assessment of formalin-fixed biopsy tissue and surgical resection specimens remains the cornerstone of cancer diagnosis and pathological staging in routine clinical practice. In recent years,
standard protocols for reporting head and neck
cancer have been widely used and these have improved the general level of the pathological assessment22.
Nucleolus is the location where ribosome RNA (rRNA) is transcribed. In general, the nucleoli of cancer cells are larger and greater in number as compared with normal cells, and contain DNA loops called NORs encoding rRNA production. During cell division, the nucleolus localizes at the secondary constriction of acrocentric chromosomes, where the argyrophilic nonhistone proteins, namely AgNORs, are also located23. In the past few years, a great body of research has been conducted on the potential diagnostic and prognostic applications
of AgNOR staining. The quantiication of interphase AgNORs can represent a useful tool for cell kinetics
evaluation. Interphase AgNOR accumulation in cells entering the mitotic cycle is associated with an increased request of ribosomal biogenesis. It
is widely known that protein synthesis is faster
in rapidly dividing cells when compared with the slowly proliferating ones. Therefore, an increase in the nucleolar structures (AgNORs), where rRNA
synthesis takes place, is expected. For these
reasons, the AgNOR parameter has been proposed
as a reliable marker for the assessment of the
rapidity of cell proliferation in routinely processed histological samples2.
In the present study, there were signiicant
differences among the mean numbers of AgNORs in each studied group (p=0.01) and for all
two-by-two comparisons of groups. The signiicance
level between well differentiated and moderately differentiated groups was 1% (p=0.01), while it was 0.1% (p=0.001) between other groups, thus confirming the existence of differences in cell proliferation among the four studied groups. The increase in the number of AgNORs in malignant tumors may be explained due to the fact that aneuploidy increases as chromosome number
alteration enlarges. Coric, et al.7 (2007) studied
the prognostic signiicance of DNA cytometry in
combination with AgNOR investigation in 62 cases
of laryngeal SCC, and found a signiicant correlation
between mean number of AgNOR per nucleus and percentage of aneuploidy. In addition, clinical stage and percentage of aneuploidy correlated with survival.
Although previous studies have estimated AgNORs only counting the number of particles6,8,11,14,23, Ruschoff et al.15 (1990) showed that morphometric study allowed a more precise determination of
the inluence that many factors have over silver
stained NORs. Besides, Teixeira et al.19 (1996) demonstrated that the size of AgNORs was more consistently related to the cell proliferative state than a simple counting of their number.
CONCLUSION
AgNOR staining technique seems to be a useful diagnostic tool since differences in AgNOR
numeric values could be identiied in the different
types of OSCC. This technique is easy to handle and inexpensive, thus justifying its large use in histopathology. However, it should be well standardized, mainly the fixation method and staining time, in order to eliminate factors that
could inluence the number of AgNORs in the cell
nuclei. For these reasons, the use of morphometric
methods (image analysis) could avoid the mistake
produced by the union of the particles.
REFERENCES
1- Adeyemi BF, Kolude BM, Akang EE, Lawoyin-Moghadam JO.
A study of the utility of silver nucleolar organizer regions in categorization and prognosis of salivary gland tumors. Oral Surg Oral Med Oral Pathol Oral Radiol endod. 2006;102:513-20. 2- Alaeddini M, Khalili M, Tirgary F, etemad-Moghadam S. Argyrophilic proteins of nucleolar organizer regions (AgNORs) in salivary gland mucoepidermoid carcinoma and its relation to histological grade. Oral Surg Oral Med Oral Pathol Oral Radiol endod. 2008;105:758-62.
3- Al-Rawi NH, Talabani NG. Squamous cell carcinoma of the oral cavity: a case series analysis of clinical presentation and histological grading of 1,425 cases from Iraq. Clin Oral Invest. 2008;122:15-8.
4- Anneroth G, Batsakis J, Luna M. Review of the literature and
a recommended system of malignancy grading in oral squamous cell carcinomas. Scand J Dent Res. 1987;95:229-49.
5- Arduino PG, Carrozzo M, Chiecchio A, Broccolotti R, Tirone F, Borra e, et al. Clinical and histopathologic independent prognostic factors in oral squamous cell carcinoma: a retrospective study of 334 cases. J Oral Maxillofac Surg. 2008;66:1570-9.
6- Chattopadhyay A, Ray JG. AgNOR cut-point to distinguish mild and moderate epithelial dysplasia. J Oral Pathol Med. 2008;37:78-82.
7- Coric M, Ladika-Davidovic B, Bumber Z, Danic D, Vuletic
8- Crocker J, Boldy DAR, Egan MJ. How should we count AgNORs?
Proposals for a standardized approach. J Pathol. 1989;158:185-8. 9- epivatianos A. evaluation of nucleolar organizer region associated proteins in oral squamous cell carcinoma. Ann Dent. 1994;53:33-6.
10- Moore SR, Johnson NW, Pierce AM, Wilson DF. The epidemiology of mouth cancer: a review of global incidence. Oral Dis. 2000;6:65-74.
11- Piffkò J, Bànkfalvi A, Ofner D, Bryne M, Rasch D, Joos U, et
al. Prognostic value of histobiological factors (malignancy grading and AgNOR content) assessed at the invasive tumour front of oral squamous cell carcinomas. Br J Cancer. 1997;74:1543-6.
12- Piffkò J, Bànkfalvi A, Ofner D, Rasch D, Joos U, Schimid KW.
Standardized AgNOR analysis of the invasive tumour front in oral squamous cell carcinomas. J Pathol. 1997;182:450-6.
13- Ploton D, Menager M, Jeannesson P, Himber G, Pigeon F, Adnet JJ. Improvement in the staining and visualization of the argyrophilic proteins of the nucleolar organizer region at the optical level. Histochem J. 1986;18:5-14.
14- Ray JG, Chattopadhyay A, Caplan DJ. Usefulness of AgNOR counts in diagnosing epithelial dysplasia. J Oral Pathol Med. 2003;32:71-6.
15- Rüschoff J, Plate KH, Contractor H, Kern S, Zimmermann R,
Thomas C. evaluation of nucleolus organizer regions (NORs) by automatic image analysis: a contribution to standardization. J Pathol. 1990;161:113-8.
16- Schwint Ae, Savino TM, Lanfranchi He, Marschoff e, Cabrini RL, Itoiz Me. Nucleolar organizer regions in lining epithelium adjacent to squamous cell carcinoma of human oral mucosa. Cancer. 1994;73:2674-9.
17- Shaw RJ, McGlashan G, Woolgar JA, Lowe D, Brown JS, Vaughan eD, et al. Prognostic importance of site in squamous cell carcinoma of the buccal mucosa. Br J Oral Maxillofac Surg. 2009;47:356-9.
18- Suto T, Sugai T, Nakamura S, Funato O, Nitta H, Sasaki R, et
al. Assessment of the expression of p53, MIB-1 (Ki-67 antigen), and argyrophilic nucleolar organizer regions in carcinoma of the extrahepatic bile duct. Cancer. 1998;82:86-95.
19- Teixeira G, Antonangelo L, Kowalski LP, Saldiva P, Ferraz A,
Silva Filho G. Argyrophilic nucleolar organizer regions staining is
useful in predicting recurrence-free interval in oral tongue and loor
of mouth squamous cell carcinoma. Am J Surg. 1996;172:684-8.
20- Warnakulasuriya KA, Johnson NW. Nucleolar organizer region (NOR) distribution as a diagnostic marker in oral keratosis,
dysplasia and squamous cell carcinoma. J Oral Pathol Med. 1993;22:77-81.
21- Wolanski KD, Whitaker D, Shilkin KB, Henderson DW. The use of
epithelial membrane antigen and silver-stained nucleolar organizer regions testing in the differential diagnosis of mesothelioma from benign reactive mesothelioses. Cancer. 1998;82:583-90. 22- Woolgar JA, Triantafyllou A. Pitfalls and procedures in the histopathological diagnosis of oral and oropharyngeal squamous cell carcinoma and a review of the role of pathology in prognosis. Oral Oncol. 2009;45:361-85.
23- Yue L, Iwai M, Furuta I. evaluation of argyrophilic nucleolar organizer regions in tongue squamous cell carcinomas. Oral Oncol. 1999;35:70-6.
24- Xie X, Clausen OP, Sudbö J. Diagnostic and prognostic value