ABSTRACT:Objective: To describe the solutions adopted in the multiple steps of the use of multivariate techniques to obtain a dietary pattern (DP) concerning: the objective of the studies, the selection of the method for measuring food intake, the criteria for grouping the foods, the number of food groups used, the number of DP obtained, and the nomenclature criteria. Methods: The articles were selected from MEDLINE and Lilacs scientiic databases using the following keywords: “dietary patterns” versus “factor analysis”; “principal components analysis”; “cluster analysis” and “reduced regression rank.” The initial search resulted in 1,752 articles. After inclusion and exclusion criteria, 189 publications were selected. Results: The following aspects were relevant among the studies: the prevalence of the principal component analysis (PCA); the prevalence of the use of 4 to 5 DPs in the studies of association with health outcomes; the use of 30 or more food groups from the food frequency questionnaire (FFQ); the prevalence of studies that associated DPs with health outcomes and socioeconomic factors; and the heterogeneity of criteria used throughout the analytical stages of the multivariate techniques. Conclusion: The heterogeneity between the publications concentrates on the criteria for food grouping, the nomenclature, and the number of dietary patterns calculated, which varied depending on the number of food groups present in these analyses. To understand, apply, and explore in full, the multivariate techniques has become necessary in order to improve the reliability of the results and, consequently, to improve the relationships with health outcomes and socioeconomic factors.
Keywords: Principal component analysis. Factor analysis, statistical. Multivariate analysis. Cluster analysis. Food consumption. Feeding behavior.
Dietary patterns: a literature review of the
methodological characteristics of the
main steps of the multivariate analyzes
Padrões alimentares estimados por técnicas multivariadas: uma revisão
da literatura sobre os procedimentos adotados nas etapas analíticas
Camila Aparecida Borges
I, Ana Elisa Rinaldi
I, Wolney Lisboa Conde
II,
Giulia Marcelino Mainardi
III, Dora Behar
IV, Betzabeth Slater
IIIGraduate Program in Nutrition in Public Health, School of Public Health, Universidade de São Paulo – São Paulo (SP), Brazil. IIDepartment of Nutrition, School of Public Health, Universidade de São Paulo – São Paulo (SP), Brazil.
IIIGraduate Program in Nutrition in Public Health, School of Public Health, Universidade de São Paulo – São Paulo (SP), Brazil. IVTechnical Support in Research, School of Public Health, Universidade de São Paulo – São Paulo (SP), Brazil.
Corresponding author: Camila Aparecida Borges. Avenida Doutor Arnaldo, 715, Departamento de Nutrição, 2o andar, CEP: 01246-904, São Paulo, SP, Brasil. E-mail: [email protected]
Conlict of interests: nothing to declare – Financial support: Coordination for the Improvement of Higher Education Personnel (CAPES)
INTRODUCTION
Multivariate analysis techniques are increasingly being used for inferences on the
die-tary pattern (DP) in nutritional epidemiology
1-3. The DP is biologically important, because
it summarizes the total diet, taking into account that the foods are consumed in complex
combinations, with interactions and synergies between dietary constituents, and that the
balance between the components of protective and risk foods may be important to
deter-mine the associations between diet and diseases
4.
Epidemiologically, the expression of nutrition as a DP widens the view on the food
intake of the population by:
•
allowing the identiication of trends and the characterization of groups with similar
eating behaviors
2;
•
identifying the introduction of new eating habits
5;
•
recognizing the cultural aspects of food and the food diversity in the different
geographic regions
5;
•
understanding the speciic relationships between characteristic DPs and the morbidity
and mortality proile in the population
6,7;
•
allowing the development of dietary guidelines for populations adopting the foods,
and not only the nutrients, as a reference
6,8.
In several studies, the DP denominated as western, unhealthy, or processed is
charac-terized by including foods such as soft drinks, sweets, and processed foods and has been
RESUMO: Objetivo: Descrever as soluções adotadas nas múltiplas etapas de utilização das técnicas multivariadas para obtenção de padrão alimentar (PA) no que tange: ao objetivo dos estudos, à escolha do método de aferição do consumo alimentar, aos critérios de grupamento dos alimentos, à quantidade de grupos alimentares utilizada, ao número de PA extraído e aos critérios para nomenclatura. Métodos: Foram selecionadas publicações das bases MEDLINE e Lilacs tendo como descritores: “padrão alimentar” versus “análise fatorial”; “análise de componentes principais”; “análise de cluster” e “reduced regression rank”. A busca inicial resultou em 1.752 artigos, que após critérios de inclusão e exclusão somaram 189 publicações. Resultados: Foram relevantes entre os estudos os seguintes aspectos: a predominância da análise de componentes principais (ACP); a predominância no uso de 4 a 5 PAs nos estudos de associação com desfechos de saúde; o uso de 30 ou mais grupos de alimentos provenientes do Questionário de Frequência Alimentar (QFA); a predominância de estudos que associaram PAs com desfechos de saúde e fatores socioeconômicos; a heterogeneidade de critérios adotados ao longo das etapas analíticas das técnicas multivariadas. Conclusão: A heterogeneidade entre as publicações se concentra nos critérios de agrupamento dos alimentos, na nomenclatura e no número de padrões alimentares extraídos, que variou em função do número de grupos alimentares presentes nas análises. Entender, aplicar e explorar em sua totalidade as técnicas multivariadas tem se tornado necessário para melhorar a coniabilidade dos resultados e, consequentemente, aprimorar as relações com desfechos de saúde e fatores socioeconômicos.
associated with a lower quality of life of the populations in diferent cultures. On the other
hand, the DP denominated as healthy, traditional, Mediterranean, and prudent is
characte-rized by the presence of cereals, fruits, vegetables, and typical products of each culture and
has been associated with a better quality of life
8-17.
Four multivariate techniques are frequently used to identify a DP: principal component
analysis (PCA), factor analysis (FA), reduced regression rank (RRR), and cluster analysis
18.
In the PCA and FA, the structure of the relationships is established between the original
varia-bles that are expressed in latent variavaria-bles, which synthesize the spectrum of food variance
of the population
19. The estimate of the DP from PCA and FA assumes the dimensionality
reduction principle of the number of foods or food groups usually consumed by a
popula-tion, and the data were collected by food frequency questionnaire (FFQ), 24-hour diet recall
(24HR), or dietary records
19. In the cluster analysis, the structure of the analyzed relations
occurs between individuals, identifying groups of mutually exclusive persons (clusters)
according to the food intake
20,21. The RRR technique analyzes multiple health outcomes
simultaneously as a function of food intake to compose the DPs
3.
The estimate of a DP by multivariate techniques is a complex procedure that involves
multiple phases
22: the method of measuring food intake, the criteria and references in the
constitution of the food groups, the type of multivariate analysis more appropriate to the data
set, and the objectives of the investigation. The DP number was calculated to represent the
maximum variance explained by the initial set of data, the criteria for the extraction of DP
(
eigenvalue
> 1, scree plot, among others), the degree of correlation between the food groups
and the DP, the type of rotation (orthogonal and oblique)
23, and the form of characterizing the
DP (nomenclature)
4. Such decisions, not harmonic in most studies, limit the comprehension
of the patterns and hinder its generalization or extrapolation to other contexts
24. The increase
in scientiic production about DP demands literature reviews structured according to
concep-tual and operational aspects, which may contribute to the standardization of multiple stages,
in order to provide a broad comparability between the studies. Therefore, this review had
as an objective to describe the solutions adopted in the multiple steps of the use of
multiva-riate techniques to obtain the DP regarding: the purpose of the studies, the selection of the
method of measuring food intake, the criteria for grouping the foods, the quantity of food
groups used, the calculated DP number, and the nomenclature criteria.
METHODS
CRITERIA OF SEARCH AND SELECTION OF THE ARTICLES
The literature review comprised a guiding question: how did the authors organize the
procedures used in the multivariate analysis to estimate the DP?
component analysis” AND “food pattern”; “principal component analysis” AND “eating
pattern”; “factor analysis” AND “dietary pattern”; “factor analysis” AND “food pattern”;
“factor analysis” AND “eating pattern”; “RRR” AND “dietary pattern”; “RRR” AND “food
pattern”; “RRR” AND “eating pattern”; “cluster” AND “dietary pattern”; “cluster” AND
“food pattern”; “cluster” AND “eating pattern”. The keywords were selected in the
data-base Health Sciences Descriptors (DeCS: http://decs.bvs.br/).
CRITERIA FOR INCLUSION AND EXCLUSION OF ARTICLES
The inclusion criteria were Portuguese, English, or Spanish languages; period: from 1980
to 2012; human beings as target audience; and original articles with the purpose to describe
and/or associate the DP with health outcomes or socioeconomic factors.
The exclusion criteria were publications that extracted the DP using other statistical
tech-niques; publications with the objective to discuss methodological aspects of the multivariate
techniques; publications that mixed behavioral patterns (physical activity, sedentariness, and
smo-king) with DP; duplicate articles (same article in two diferent languages or same article selected
from diferent descriptors); systematic and nonsystematic reviews, meta-analysis, clinical trials, and
comparison between multivariate techniques; publications without suicient information on the
aspects assessed in this review; and publications not found in full. These exclusion criteria
inten-ded to focus the work on original studies that used multivariate techniques in the data analysis.
After the irst sorting, the selected publications were analyzed by four researchers, each
of them responsible for only one type of multivariate technique (PCA, FA, RRR, and cluster
analysis). Then, two researchers reassessed all the publications by comparing and selecting
each according to the predetermined criteria. The reevaluation followed this sequence: title,
abstract, full text, literature selection, and author citation, during which no new results of
complementary publications were generated.
INFORMATION COLLECTED IN THE PUBLICATIONS
<4, 4 to 5, 6 to 7, >7 DP or clusters, when it came to cluster analysis); and DP nomenclature
(qualitative labels, based on the names of the foods, nutritional composition, and multiple).
RESULTS
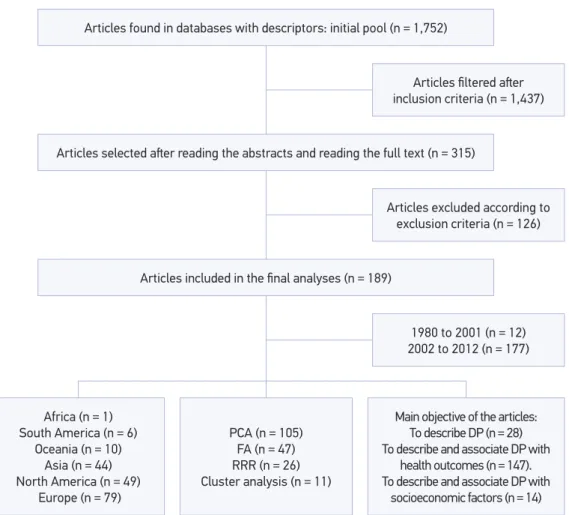
Of the 189 analyzed publications, 56% (n = 105) mentioned the PCA technique to
obtain the DP. Of the total publications, 42% (n = 79) were made in European countries,
26% (n = 49) in North American countries, and remaining 32% in Asian countries, South
America countries, African countries, and Oceanian countries. Regarding the main
objec-tive of the articles, 78% (n = 147) described the DP and associated it with health outcomes,
the others only carried out a descriptive/exploratory study of the DP and or associated it
with socioeconomic factors (Figure 1).
DP: dietary pattern; PCA: principal component analysis; FA: Factorial analysis; RRR: reduced regression rank. Articles found in databases with descriptors: initial pool (n = 1,752)
Articles selected ater reading the abstracts and reading the full text (n = 315)
Articles iltered ater inclusion criteria (n = 1,437)
Articles excluded according to exclusion criteria (n = 126)
1980 to 2001 (n = 12) 2002 to 2012 (n = 177) Articles included in the inal analyses (n = 189)
Africa (n = 1) South America (n = 6)
Oceania (n = 10) Asia (n = 44) North America (n = 49)
Europe (n = 79)
PCA (n = 105) FA (n = 47) RRR (n = 26) Cluster analysis (n = 11)
Main objective of the articles: To describe DP (n = 28) To describe and associate DP with
health outcomes (n = 147). To describe and associate DP with
socioeconomic factors (n = 14)
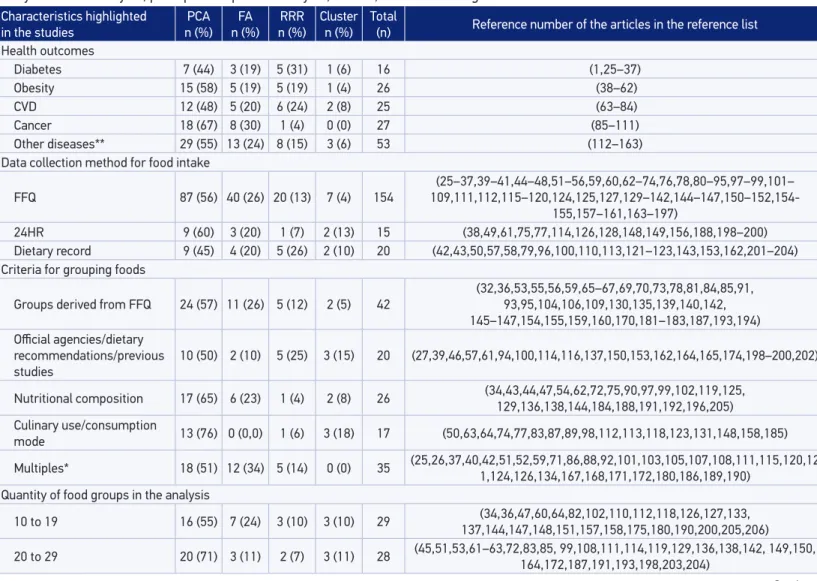
The publications found in the period from 2002 to 2012 accounted for 94% of the
total publications. This information shows an increase of 15.7 times in the number
of publications when compared with the period from 1980 to 2001. The growing use
of multivariate analyses in nutritional epidemiology publications was similar in the five
continents (Figure 2).
In Table 1, the main characteristics drawn from publications and their respective
referen-ces in the reference list of the text are summarized. Among the 147 articles that described
and associated the DP with health outcomes, 64% (n = 94) used chronic noncommunicable
diseases (CNCDs) as the outcome, of which 28% were obesity (n = 26), 27% CVD (n = 25),
29% cancer (n = 27), and 17% diabetes mellitus (n = 16) (Figure 1). Of the 147 publications
that described the DP and associated it with health outcomes, there was a prevalence in the
selection of the PCA technique in 55% of the cases (n = 81).
Of the total of analyzed articles, 81% (n = 154) used the FFQ as data collection
method for food intake. Concerning the criteria used to group the foods obtained from
collecting food intake data (step before the input of data in the multivariate
techni-ques), 22% (n = 42) used preexisting groups from the FFQ, 14% (n = 26) adopted as a
criterion the nutritional composition, 26% (n = 46) did not present any information
about the used criteria, and remaining 38% (n = 75) reported: official agencies/dietary
Figure 2. Evolution of the publications involving multivariate analysis for the constitution of dietary
patterns in nutritional epidemiology in the period from 1980 to 2012.
35
Year of publication
1980 1985 1990 1995 2000 2005 2010 2015
30
25
20
15
Number of articles per y
ear
10
5
Characteristics highlighted in the studies
PCA
n (%)
FA
n (%)
RRR
n (%)
Cluster
n (%)
Total
(n) Reference number of the articles in the reference list
Health outcomes
Diabetes 7 (44) 3 (19) 5 (31) 1 (6) 16 (1,25–37)
Obesity 15 (58) 5 (19) 5 (19) 1 (4) 26 (38–62)
CVD 12 (48) 5 (20) 6 (24) 2 (8) 25 (63–84)
Cancer 18 (67) 8 (30) 1 (4) 0 (0) 27 (85–111)
Other diseases** 29 (55) 13 (24) 8 (15) 3 (6) 53 (112–163)
Data collection method for food intake
FFQ 87 (56) 40 (26) 20 (13) 7 (4) 154
(25–37,39–41,44–48,51–56,59,60,62–74,76,78,80–95,97–99,101–
109,111,112,115–120,124,125,127,129–142,144–147,150–152,154-155,157–161,163–197)
24HR 9 (60) 3 (20) 1 (7) 2 (13) 15 (38,49,61,75,77,114,126,128,148,149,156,188,198–200)
Dietary record 9 (45) 4 (20) 5 (26) 2 (10) 20 (42,43,50,57,58,79,96,100,110,113,121–123,143,153,162,201–204)
Criteria for grouping foods
Groups derived from FFQ 24 (57) 11 (26) 5 (12) 2 (5) 42 (32,36,53,55,56,59,65–67, 69,70,73,78,81,84,85,91,93,95,104,106,109,130,135,139,140,142, 145–147,154,155,159,160,170,181–183,187,193,194) Oicial agencies/dietary
recommendations/previous studies
10 (50) 2 (10) 5 (25) 3 (15) 20 (27,39,46,57,61,94,100,114,116,137,150,153,162,164,165,174,198–200,202)
Nutritional composition 17 (65) 6 (23) 1 (4) 2 (8) 26 (34,43,44,47,54,62,72,75,90,97,99,102,119,125,
129,136,138,144,184,188,191,192,196,205) Culinary use/consumption
mode 13 (76) 0 (0,0) 1 (6) 3 (18) 17 (50,63,64,74,77,83,87,89,98,112,113,118,123,131,148,158,185)
Multiples* 18 (51) 12 (34) 5 (14) 0 (0) 35 (25,26,37,40,42,51,52,59,71,86,88,92,101,103,105,107,108,111,115,120,121,124,126,134,167,168,171,172,180,186,189,190)
Quantity of food groups in the analysis
10 to 19 16 (55) 7 (24) 3 (10) 3 (10) 29 137,144,147,148,151,157,158,175,180,190,200,205,206) (34,36,47,60,64,82,102,110,112,118,126,127,133,
20 to 29 20 (71) 3 (11) 2 (7) 3 (11) 28 (45,51,53,61–63,72,83,85, 99,108,111,114,119,129,136,138,142, 149,150,164,172,187,191,193,198,203,204)
Table 1. Classiication of the articles identiied in the review according to the main characteristics analyzed and the type of multivariate
analysis: factor analysis, principal component analysis, cluster, and reduced regression rank.
Characteristics highlighted in the studies
PCA
n (%)
FA
n (%)
RRR
n (%)
Cluster
n (%)
Total
(n) Reference number of the articles in the reference list
30 to 39 30 (52) 19 (33) 7 (12) 2 (3) 58 (25,26,32,40,41,48,50,52,54,56,59,65,69,74–76,78,79,81,86,88,90,92–94,98,101,103–105,121,123,128,135,141,146,152,154, 160–163,166,176,178,183–186,188,189,192,196,197,199)
≥40 39 (53) 18 (24) 14 (19) 3 (4) 74
(27–31,33,35,37–39,42–44,46,55,57,58,66–68,70,71,73,77,80,84,87,89,91, 95–97,100,106,107,109,113,115–117,120,122,124,125,
130–132,134,139,140,143,145,153,155,156,159,165, 167–171,173,174,177,179,181,182,194,195,202) Number of calculated dietary patterns
<4 62 (55) 29 (26) 18 (16) 3 (3) 112
(25–37,39,40,43,44,50–52,54,57, 60,63,64,66–68, 70,74–76,78,79,81– 83,86–88,90,91, 94–98,101–103,105,106,108,111,115,116,118,122,125,
127,128,131–133, 135–139, 144,145,147,149–152, 154–157,159–161,164,166,168,169,172,173,175,176,178,183,184,
186–192,195,197,202,203,205,206)
4 to 5 34 (58) 14 (24) 6 (10) 5 (8) 59 (41,42,45,47,48,53,55,56,59,61,62,69,71,73,77, 85,89,92,93,99,100,104,112,113,117,119–121,123,124,129,130,134,140,142,143,146,148,153, 158,162,163,165,167,170,171,174,177,179–181,185,193,194,199,204) 6 to 7 6 (50) 2 (17) 2 (17) 2 (17) 12 (38,46,58,65,107,110,114,141,182,196,200)
> 7 3 (50) 2 (33) 0 (0) 1 (17) 6 (72,80,84,109,126,198)
Standard nomenclature
Qualitative labels 55 (65) 18 (21) 5 (6) 6 (7) 84
(31,33,36-37,40,42,44–47,51,55,57,60,63–66,68,74,78, 81–83,86,87,90,91,96,97,103,105,108,111,112,115,118,120,125, 131–133,135,138–140,142,145–147,150–152,155,157–159,161,164–166, 168,170,174–176,178,179,183,184,186–188,190–193,198,199,204,205) On the basis of the
names of the foods 25 (42) 14 (24) 17 (29) 3 (5) 59
(26,27,29,30,32,34,35,38,39,43,50,52,54,56, 58,59,61, 62,67,72, 76,79,80,84,85,89,94,98,100–102, 104,106,107,110,116,117,122, 126–129,137,149,153,154,173, 177,180,188,189,195,196,200,202,203,206)
Nutritional composition 3 (43) 2 (29) 2 (27) 0 (0) 7 (75,95,99,141,167,197)
Multiples* 22 (56) 13 (33) 2 (5) 2 (5) 39 130,134,136,143,144,148,156,160,162,163,169,171,172,181,182,185,192,194)(28,36,41,48,53,69–71,73,77,88,92,93,109,113,114,119,121,123,124,
PCA: principal component analysis; FA: factor analysis; RRR: reduced regression rank; CVD: cardiovascular diseases; FFQ: Food Frequency Questionnaire; 24HR: 24-hour dietary recall. *Combination of two or more criteria within the same characteristic. **Risk of skin lesion by arsenic; anthropometric alterations; plasma adiponectin levels; risk of pre-eclampsia; growth of newborns; asthma; anemia; C-reactive protein; constipation; osteoporosis; hyperactivity; risk of stroke; Alzheimers disease; risk of spina biida in newborns; mortality; mental health (depression, stress, attention deicit’, and bipolar disorder); and more than one health outcome.
recommendations, culinary use/consumption mode and multiple criteria. With respect
to the total of food groups included in the analyses, 70% (n = 132) reported working
with 30 or more food groups (Table 1).
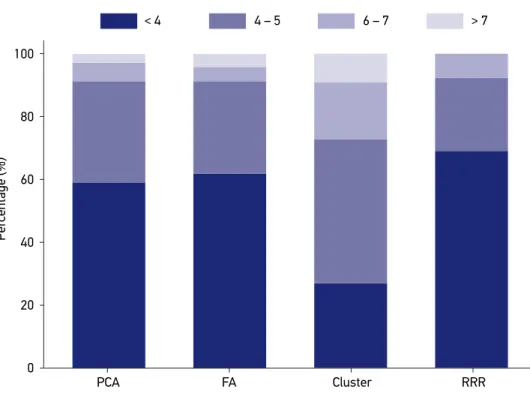
In the techniques where there is multiple attribution of components per
indivi-dual (PCA, FA, and RRR), the calculation of up to 4 components was prevalent and
reached 59% (n = 62) of the total of articles that have addressed these techniques.
In the cluster analysis, when there is only one attribution of component per
indivi-dual, the extraction of 4 to 7 components per analysis reached 73% of the analyzed
articles (Figure 3).
In the DP nomenclature, the qualitative labels category (for instance, traditional,
heal-thy, and western) was used in 44% of studies (n = 84); the name of the foods category (for
instance: fruits, meats, cereals, breads, legumes, and vegetables), in 31% (n = 59); the
nutri-tional composition categories (for example, ibers, trans fat, fatty acids, and vitamins), or
multiple criteria were used in 24% of the studies (n = 46) (Table 1).
Cluster: cluster analysis. The number of dietary patterns calculated using the RRR technique depends on the number of outcomes included in the analysis.
PCA: principal component analysis; FA: factor analysis; RRR: reduced regression rank. FA
PCA Cluster RRR
4 – 5
< 4 6 – 7 > 7
100
80
60
40
Per
centage (%)
20
0
DISCUSSION
In the period between 1980 and the irst half of the 1990s, the frequency of the
stu-dies on DP remained relatively low, even with good quality publications. In 1998, Slattery
et al.,
207introduced the FA to obtain DP and its association with colon cancer, raising the
provocative question “can eating patterns characterize the risk of diet
versus
disease better
than isolated nutrients and foods?”
The scope of the use of multivariate analysis enables us to give a partial answer to this
question, because the description of dietary patterns and their relationship with health
out-comes intensiies from the 2000s on. This expansion occurs in parallel with the evolution
of the epidemiological proile, in which the frequency of multicausal diseases linked to
nutrition has an increasingly relevant role in nutritional epidemiology. The review carried
out by Hu
2contributed to disseminate and encourage the use of DP analysis through
mul-tivariate techniques as an alternative and a complementary approach in the research of the
association between diet and CNCDs.
From the authors’ knowledge, this is the irst review that discussed how authors
organi-zed the procedures used in the multivariate analysis to estimate the DP. The main indings
of this review were: predominant use of PCA and FA; use of 4 to 5 factors when the DP is
associated with health outcomes; use of 30 or more food groups from the FFQ; prevalence
of association studies of DP
versus
health outcomes or socioeconomic factors; and
hetero-geneity of the criteria adopted along these steps.
The PCA and the FA are different multivariate techniques regarding the exploration
of the variability and the foundation of the estimator; nevertheless, they are usually
quoted without respecting the methodological differences that distinguish them
208.
Owing to the deterministic nature of the PCA, the estimated dietary patterns
repre-sent the spectrum of the eating behavior in a given population. This estimate is based
on the premise that the instruments and the data collection process must have a
ran-dom error and of small magnitude
2. The probabilistic nature of FA, in its turn, enables
the analytical treatment of the error embedded in the data survey, a relevant aspect
when we resort to dietary questionnaires to translate the dietary behavior of
popu-lations
209. The RRR has the particularity of allowing the selection of the DP to occur
directly from the maximization of the association between the dietary variables and the
markers of the outcome of interest
206,210. The cluster analysis can be methodologically
distinguished from the others by having as an objective to group the individuals into
hierarchical clusters according to the level of dissimilarity between the components of
the diets of the individuals
211.
composition, groups previously classiied by oicial agencies, government nutritional
recom-mendations, and foods drawn from national surveys.
The analytical design and the number of selected variables involve subjectivity and
arbitrariness of the researcher and cause multivariate analysis to be of diicult
repro-ducibility, to the detriment of the comparability across studies. The inclusion of a large
number of uncorrelated variables may have an erroneous efect on the determination
of the variance explained by that DP, while the elimination of variables in order to
sim-plify the factor structure can lead to mistaken conclusions
24. In the studied publications,
the use of 30 or more groups of food was veriied, probably because 76% of the articles
assessed food intake through FFQs, which, in most cases, have a large number of food
items and/or groups, enabling later, in the multivariate analysis, greater precision and
accuracy of the obtained DP
212.
The number of food groups included in the multivariate techniques interferes greatly
in the proportion of the variance explained by the factors and the number of factors to
be retained, especially by the latent root criterion (
eigenvalue
). The greater the explained
variance, the better is the understanding of the diversity and complexity of the nutrition
of the analyzed population
19.
In this review, the studies that associated DP with CVD and cancer have used fewer
than four DPs to explain the possible relations of risk or protection, while those that
asso-ciated obesity with DP used four to ive factors. Studies carried out by Schulze et al.
213and Brennan et al.
214found that the use of up to three factors enables good associations
with health outcomes. In the cluster analysis, Newby and Tucker
4found good
associa-tions with CNCDs in the presence of two to eight clusters, a fact that was observed in
this review. The number of obtained DPs is linked to the percentage of variance
explai-ned by them, and the aim is to explain the higher variance of the initial set of data with
a minimal number of factors or clusters
215.
For the studies that designated qualitative label to the DP, we veriied an empirical basis
in the sense of inding meaning in the available scientiic information. Thus, it was
possi-ble to ind a similarity in the type of food that composed these patterns. Patterns named
as “traditional” contained preparations more prevalent of the diet of the country where
the study was conducted. Those labeled as “healthy pattern” and “prudent pattern”
contai-ned vegetables, fruits, whole grains, ish, low-fat dairy products, chicken, and soybean and
byproducts. The label “Mediterranean pattern” is characterized by grouping pasta, rice, ish,
legumes, vegetable oils, skim milk, salads, fruit, wine, and cucumber, while the “western
pattern” is characterized by soft drinks, pizza, hamburger, processed meats, sugary drinks,
whole milk, precooked foods, reined grains, bacon, and ham.
three languages (English, Portuguese, and Spanish) for the search process, which may
also have reduced the number of publications found. However, the authors conducted
a survey in these two bases using the same descriptors of the study, without language
restriction, and it was verified that the loss of publications owing to language would
not exceed 5%. The third is related to the fact that, even if constructed broadly, the
initial question does not address typically operational aspects for constructing DP, for
example, types of rotation, methods used in the calculation of DP, qualitative or
quan-titative variable, and sample size, among others.
The use of multivariate techniques has advanced in the last decade, highlighting the
impor-tance of the standardization of the published information. In this review, we veriied cases where
the DP was characterized and interpreted according to the most prevalent nutrients among the
food groups that compose it
43,60,107,153,216. This form of interpretation focused on a single nutrient
or set of nutrients that mischaracterize the DP, to the extent that it ceases to evaluate the
com-plexity of the diet expressed by the combination of foods. A favorable evidence to the full use of
the DP and its interpretation based on the foods that compose it, and contrary to the tradition of
selecting nutrients more associated with the outcome, is the tendency of increase in the variance
explained by the patterns as the detailing of the dietary information decreases
215.
CONCLUSION
The use of the multivariate techniques in nutritional epidemiology has increased in
recent decades mainly owing to the need to learn and represent the food intake in its
com-plex form, taking into account the interaction between the nutrients present in the foods.
We veriied, among the publications, the prevalence of the techniques in which the
struc-ture of relations is based on variables (PCA and FA) and not on individuals (cluster). In this
review, the heterogeneity of the studies concentrates mainly on the criteria for grouping the
foods that preceded the use of multivariate techniques and on the criteria for naming the
calculated DPs. The grouping of the foods directly afects the number of calculated patterns
and the interpretation and elucidation of the association of the DP with health outcomes.
To understand, apply, and explore in full, the multivariate techniques have become
neces-sary to improve the reliability of the analytical studies about DP and, hence, to reine the
relations with health outcomes and socioeconomic factors.
ACKNOWLEDGEMENTS
ETHICS COMMITTEE
The study is part of C.A.B’s doctoral project, which was submitted to the Research Ethics
Committee of the School of Public Health at Universidade de São Paulo, and, because it uses
secondary databases, does not require approval (CAAE 0129.0.207.000-11/process no. 2315).
1. Hofmann K, Schulze MB, Schienkiewitz A, Nöthlings U, Boeing H. Application of a new statistical method to derive dietary patterns in nutritional epidemiology. Am J Epidemiol 2004; 159(10): 935-44.
2. Hu FB. Dietary pattern analysis: a new direction in nutritional epidemiology. Curr Opin Lipidol 2002; 13(1): 3-9.
3. Van Dam RM. New approaches to the study of dietary patterns. Br J Nutr 2005; 93(5): 573-4.
4. Newby PK, Tucker KL. Empirically derived eating patterns using factor or cluster analysis: A Review. Nutr Rev 2004; 62(5): 177-203
5. Tucker KL. Dietary patterns, approaches, and multicultural perspective. Appl Physiol Nutr Metab Physiol Appliquée Nutr Métabolisme 2010; 35(2): 211-8.
6. Kant AK. Dietary patterns and health outcomes. J Am Diet Assoc. 2004;104(4):615-35.
7. Michels KB, Schulze MB. Can dietary patterns help us detect diet? Disease associations? Nutr Res Rev 2005; 18(2): 241-8.
8. Katz DL, Meller S. Can we say what diet is best for health? Annu Rev Public Health 2014; 35: 83-103.
9. Liese AD, Weis KE, Schulz M, Tooze JA. Food intake patterns associated with incident type 2 diabetes. Diabetes Care 2009; 32(2): 263-8.
10. Berg CM, Lappas G, Strandhagen E, Wolk A, Torén K, Rosengren A, et al. Food patterns and cardiovascular disease risk factors: the Swedish INTERGENE research program. Am J Clin Nutr 2008; 88(2): 289-97.
11. Esmaillzadeh A, Azadbakht L. Major dietary patterns in relation to general obesity and central adiposity among Iranian women. J Nutr 2008; 138(2): 358-63.
12. Uglem S, Stea TH, Frølich W, Wandel M. Body weight, weight perceptions and food intake patterns. A cross-sectional study among male recruits in the Norwegian National Guard. BMC Public Health 2011; 11: 343.
13. Yannakoulia M, Ntalla I, Papoutsakis C, Farmaki AE, Dedoussis GV. Consumption of vegetables, cooked meals, and eating dinner is negatively associated with overweight status in children. J Pediatr 2010; 157(5): 815-20.
14. Panagiotakos D, Pitsavos C, Chrysohoou C, Palliou K, Lentzas I, Skoumas I, et al. Dietary patterns and 5-year incidence of cardiovascular disease: a multivariate analysis of the ATTICA study. Nutr Metab Cardiovasc Dis NMCD 2009; 19(4): 253-63.
15. Fung TT, Willett WC, Stampfer MJ, Manson JAE, Hu FB. Dietary patterns and the risk of coronary heart disease in women. Arch Intern Med 2001; 161(15): 1857.
16. Demetriou CA, Hadjisavvas A, Loizidou MA, Loucaides G, Neophytou I, Sieri S, et al. The mediterranean dietary pattern and breast cancer risk in Greek-Cypriot women: a case-control study. BMC Cancer 2012; 12: 113.
17. Sichieri R. Dietary patterns and their associations with obesity in the Brazilian city of Rio de Janeiro. Obesity 2002; 10(1): 42-8.
18. Moeller SM, Reedy J, Millen AE, Dixon LB, Newby PK, Tucker KL, et al. Dietary patterns: challenges and opportunities in dietary patterns research an Experimental Biology workshop, April 1, 2006. J Am Diet Assoc 2007; 107(7): 1233-9.
19. Hair JF Jr, Black WC, Babin BJ. Multivariate Data Analysis. 7th ed. Paperback; 2009. ISBN-10: 0138132631
20. Wirfält AE, Jefery RW. Using cluster analysis to examine dietary patterns: nutrient intakes, gender, and weight status difer across food pattern clusters. J Am Diet Assoc 1997; 97(3): 272-9.
21. Akin JS, Guilkey DK, Popkin BM, Fanelli MT. Cluster analysis of food consumption patterns of older Americans. J Am Diet Assoc 1986; 86(5): 616.
22. Costello AB, Osborne J. Best practices in exploratory factor analysis: four recommendations for getting the most from your analysis. Practical Assessment, Research & Evaluation 2014; 10(7): 9.
24. Martínez ME, Marshall JR, Sechrest L. The Arbitrary Nature Of The Factor Analytical Process. Am J Epidemiol 1998; 148(1): 17-9
25. Fung TT SM. Dietary patterns, meat intake, and the risk of type 2 diabetes in women. Arch Intern Med 2004; 164(20): 2235-40.
26. Schulze MB, Hoffmann K, Manson JE, Willett WC, Meigs JB, Weikert C, et al. Dietary pattern, inlammation, and incidence of type 2 diabetes in women. Am J Clin Nutr 2005; 82(3): 675-84.
27. Heidemann C, Hofmann K, Spranger J, Klipstein-Grobusch K, Möhlig M, Pfeifer AFH, et al. A dietary pattern protective against type 2 diabetes in the European Prospective Investigation into Cancer and Nutrition (EPIC)--Potsdam Study cohort. Diabetologia 2005; 48(6): 1126-34.
28. Mizoue T, Yamaji T, Tabata S, Yamaguchi K, Ogawa S, Mineshita M, et al. Dietary patterns and glucose tolerance abnormalities in Japanese men. J Nutr 2006; 136(5): 1352-8.
29. McNaughton SA, Mishra GD, Brunner EJ. Dietary patterns, insulin resistance, and incidence of type 2 diabetes in the Whitehall II Study. Diabetes Care 2008; 31(7): 1343-8.
30. Kim H-S, Park S-Y, Grandinetti A, Holck PS, Waslien C. Major dietary patterns, ethnicity, and prevalence of type 2 diabetes in rural Hawaii. Nutr Burbank Los Angel Cty Calif 2008; 24(11-12): 1065-72.
31. Lau C, Toft U, Tetens I, Carstensen B, Jørgensen T, Pedersen O, et al. Dietary patterns predict changes in two-hour post-oral glucose tolerance test plasma glucose concentrations in middle-aged adults. J Nutr 2009; 139(3): 588-93.
32. Liese AD, Weis KE, Schulz M, Tooze JA. Food intake patterns associated with incident type 2 diabetes. Diabetes Care 2009; 32(2): 263-8.
33. Qi L, Cornelis MC, Zhang C, van Dam RM, Hu FB. Genetic predisposition, Western dietary pattern, and the risk of type 2 diabetes in men. Am J Clin Nutr 2009; 89(5): 1453-8.
34. Villegas R, Yang G, Gao Y-T, Cai H, Li H, Zheng W, et al. Dietary patterns are associated with lower incidence of type 2 diabetes in middle-aged women: the Shanghai Women’s Health Study. Int J Epidemiol 2010; 39(3): 889-99.
35. Odegaard AO, Koh W-P, Butler LM, Duval S, Gross MD, Yu MC, et al. Dietary patterns and incident type 2 diabetes in chinese men and women: the singapore chinese health study. Diabetes Care 2011; 34(4): 880-5.
36. Iimuro S, Yoshimura Y, Umegaki H, Sakurai T, Araki A, Ohashi Y, et al. Dietary pattern and mortality in Japanese elderly patients with type 2 diabetes mellitus: does a vegetable- and ish-rich diet improve mortality?
An explanatory study. Geriatr Gerontol Int 2012; 12 Suppl 1: 59-67.
37. Malik VS, Fung TT, van Dam RM, Rimm EB, Rosner B, Hu FB. Dietary patterns during adolescence and risk of type 2 diabetes in middle-aged women. Diabetes Care 2012; 35(1): 12-8.
38. Newby PK, Muller D, Hallfrisch J, Andres R, Tucker KL. Food patterns measured by factor analysis and anthropometric changes in adults. Am J Clin Nutr 2004; 80(2): 504-13.
39. Schulz M, Nöthlings U, Hoffmann K, Bergmann MM, Boeing H. Identification of a Food Pattern Characterized by High-Fiber and Low-Fat Food Choices Associated with Low Prospective Weight Change in the EPIC-Potsdam Cohort. J Nutr 2005; 135(5): 1183-9.
40. Schulze MB, Fung TT, Manson JE, Willett WC, Hu FB. Dietary patterns and changes in body weight in women. Obes Silver Spring Md 2006; 14(8): 1444-53.
41. Newby PK, Weismayer C, Akesson A, Tucker KL, Wolk A. Longitudinal changes in food patterns predict changes in weight and body mass index and the efects are greatest in obese women. J Nutr 2006; 136(10): 2580-7.
42. Murtaugh MA, Herrick JS, Sweeney C, Baumgartner KB, Guiliano AR, Byers T, et al. Diet composition and risk of overweight and obesity in women living in the southwestern United States. J Am Diet Assoc 2007; 107(8): 1311-21.
43. Johnson L, Mander AP, Jones LR, Emmett PM, Jebb SA. Energy-dense, low-iber, high-fat dietary pattern is associated with increased fatness in childhood. Am J Clin Nutr 2008; 87(4): 846-54.
44. Esmaillzadeh A, Azadbakht L. Major dietary patterns in relation to general obesity and central adiposity among Iranian women. J Nutr. 2008;138(2): 358-63.
45. Shi Z, Hu X, Yuan B, Hu G, Pan X, Dai Y, et al. Vegetable-rich food pattern is related to obesity in China. Int J Obes 2005 2008;32(6): 975-84.
46. Uusitalo U, Arkkola T, Ovaskainen M-L, Kronberg-Kippilä C, Kenward MG, Veijola R, et al. Unhealthy dietary patterns are associated with weight gain during pregnancy among Finnish women. Public Health Nutr 2009; 12(12): 2392-9.
47. Kjøllesdal MR, Holmboe-Ottesen G, Wandel M. Frequent use of staff canteens is associated with unhealthy dietary habits and obesity in a Norwegian adult population. Public Health Nutr 2011;14(1): 133-41.
49. Manios Y, Kourlaba G, Grammatikaki E, Androutsos O, Ioannou E, Roma-Giannikou E. Comparison of two methods for identifying dietary patterns associated with obesity in preschool children: the GENESIS study. Eur J Clin Nutr 2010; 64(12): 1407-14.
50. Wosje KS, Khoury PR, Claytor RP, Copeland KA, Hornung RW, Daniels SR, et al. Dietary patterns associated with fat and bone mass in young children. Am J Clin Nutr 2010; 92(2): 294-303.
51. Cunha DB, de Almeida RMVR, Sichieri R, Pereira RA. Association of Dietary Patterns with BMI and Waist Circumference in a Low-Income Neighbourhood in Brazil. Br J Nutr 2010; 104(06): 908-13.
52. Cho YA, Shin A, Kim J. Dietary patterns are associated with body mass index in a Korean population. J Am Diet Assoc 2011; 111(8): 1182-6.
53. Shi Z, Yuan B, Hu G, Dai Y, Zuo H, Holmboe-Ottesen G. Dietary pattern and weight change in a 5-year follow-up among Chinese adults: results from the Jiangsu Nutrition Study. Br J Nutr 2011; 105(7): 1047-54.
54. Boggs DA, Palmer JR, Spiegelman D, Stampfer MJ, Adams-Campbell LL, Rosenberg L. Dietary patterns and 14-y weight gain in African American women. Am J Clin Nutr 2011; 94(1): 86-94.
55. Cutler GJ, Flood A, Hannan PJ, Slavin JL, Neumark-Sztainer D. Association between major patterns of dietary intake and weight status in adolescents. Br J Nutr 2012; 108(2): 349-56.
56. Lin H, Bermudez OI, Tucker KL. Dietary patterns of Hispanic elders are associated with acculturation and obesity. J Nutr 2003; 133(11): 3651-7.
57. Ambrosini GL, Emmett PM, Northstone K, Howe LD, Tilling K, Jebb SA. Identification of a dietary pattern prospectively associated with increased adiposity during childhood and adolescence. Int J Obes 2012; 36(10): 1299-305.
58. Fialkowski MK, McCrory MA, Roberts SM, Tracy JK, Grattan LM, Boushey CJ. Dietary patterns are associated with dietary recommendations but have limited relationship to BMI in the Communities Advancing the Studies of Tribal Nations Across the Lifespan (CoASTAL) cohort. Public Health Nutr 2012; 15(10): 1948-58.
59. Kim J-H, Lee JE, Jung I-K. Dietary pattern classiications and the association with general obesity and abdominal obesity in Korean women. J Acad Nutr Diet 2012; 112(10): 1550-9.
60. Van den Berg L, Henneman P, Willems van Dijk K, Delemarre-van de Waal H, Oostra B, van Duijn C, et al. Heritability of dietary food intake patterns. Acta Diabetol 2013; 50(5): 721-26.
61. Kim J, Jo I, Joung H. A rice-based traditional dietary pattern is associated with obesity in Korean adults. J Acad Nutr Diet 2012; 112(2): 246-53.
62. Maskarinec G, Novotny R, Tasaki K. Dietary Patterns Are Associated with Body Mass Index in Multiethnic Women. J Nutr 2000; 130(12): 3068-72.
63. Osler M, Helms Andreasen A, Heitmann B, Høidrup S, Gerdes U, Mørch Jørgensen L, et al. Food intake patterns and risk of coronary heart disease: a prospective cohort study examining the use of traditional scoring techniques. Eur J Clin Nutr 2002; 56(7): 568-74.
64. Quatromoni PA, Copenhafer DL, Demissie S, D’Agostino RB, O’Horo CE, Nam B-H, et al. The internal validity of a dietary pattern analysis. The Framingham Nutrition Studies. J Epidemiol Community Health 2002; 56(5): 381-8.
65. Kerver JM, Yang EJ, Bianchi L, Song WO. Dietary patterns associated with risk factors for cardiovascular disease in healthy US adults. Am J Clin Nutr 2003; 78(6): 1103-10.
66. Villegas R, Salim A, Collins MM, Flynn A, Perry IJ. Dietary patterns in middle-aged Irish men and women deined by cluster analysis. Public Health Nutr 2004; 7(8): 1017-24.
67. Hofmann K, Zyriax B-C, Boeing H, Windler E. A dietary pattern derived to explain biomarker variation is strongly associated with the risk of coronary artery disease. Am J Clin Nutr 2004; 80(3): 633-40.
68. Nettleton JA, Schulze MB, Jiang R, Jenny NS, Burke GL, Jacobs DR. A priori-deined dietary patterns and markers of cardiovascular disease risk in the Multi-Ethnic Study of Atherosclerosis (MESA). Am J Clin Nutr 2008; 88(1): 185-94.
69. Akesson A, Weismayer C, Newby PK, Wolk A. Combined effect of low-risk dietary and lifestyle behaviors in primary prevention of myocardial infarction in women. Arch Intern Med 2007; 167(19): 2122-7.
70. Shimazu T, Kuriyama S, Hozawa A, Ohmori K, Sato Y, Nakaya N, et al. Dietary patterns and cardiovascular disease mortality in Japan: a prospective cohort study. Int J Epidemiol 2007; 36(3): 600-9.
71. Dibello JR, Kraft P, McGarvey ST, Goldberg R, Campos H, Baylin A. Comparison of 3 methods for identifying dietary patterns associated with risk of disease. Am J Epidemiol 2008; 168(12): 1433-43.
72. Panagiotakos D, Pitsavos C, Chrysohoou C, Palliou K, Lentzas I, Skoumas I, et al. Dietary patterns and 5-year incidence of cardiovascular disease: a multivariate analysis of the ATTICA study. Nutr Metab Cardiovasc Dis NMCD 2009; 19(4): 253-63.
74. Nettleton JA, Matijevic N, Follis JL, Folsom AR, Boerwinkle E. Associations between dietary patterns and low cytometry-measured biomarkers of inlammation and cellular activation in the Atherosclerosis Risk in Communities (ARIC) Carotid Artery MRI Study. Atherosclerosis 2010; 212(1): 260-7.
75. Kesse-Guyot E, Vergnaud A-C, Fezeu L, Zureik M, Blacher J, Péneau S, et al. Associations between dietary patterns and arterial stifness, carotid artery intima-media thickness and atherosclerosis. Eur J Cardiovasc Prev Rehabil Of J Eur Soc Cardiol Work Groups Epidemiol Prev Card Rehabil Exerc Physiol 2010; 17(6): 718-24.
76. Liese AD, Nichols M, Hodo D, Mellen PB, Schulz M, Gof DC, et al. Food intake patterns associated with carotid artery atherosclerosis in the Insulin Resistance Atherosclerosis Study. Br J Nutr 2010; 103(10): 1471-9.
77. Hamer M, Mishra GD. Dietary patter ns and cardiovascular risk markers in the UK Low Income Diet and Nutrition Survey. Nutr Metab Cardiovasc Dis NMCD 2010; 20(7): 491-7.
78. Fung TT, Willett WC, Stampfer MJ, Manson JAE, Hu FB. Dietary patterns and the risk of coronary heart disease in women. Arch Intern Med 2001; 161(15): 1857.
79. Meyer J, Döring A, Herder C, Roden M, Koenig W, Thorand B. Dietary patterns, subclinical inlammation, incident coronary heart disease and mortality in middle-aged men from the MONICA/KORA Augsburg cohort study. Eur J Clin Nutr 2011; 65(7): 800-7.
80. Daniel CR, Prabhakaran D, Kapur K, Graubard BI, Devasenapathy N, Ramakrishnan L, et al. A cross-sectional investigation of regional patterns of diet and cardio-metabolic risk in India. Nutr J 2011; 10: 12.
81. Guo H, Niu K, Monma H, Kobayashi Y, Guan L, Sato M, et al. Association of Japanese dietary pattern with serum adiponectin concentration in Japanese adult men. Nutr Metab Cardiovasc Dis NMCD 2012; 22(3): 277-84.
82. Yap RWK, Shidoji Y, Hon WM, Masaki M. Association and interaction between dietary pattern and VEGF receptor-2 (VEGFR2) gene polymorphisms on blood lipids in Chinese Malaysian and Japanese adults. Asia Pac J Clin Nutr 2012; 21(2): 302-11.
83. Osler M, Heitmann BL, Gerdes LU, Jorgensen LM, Schroll M. Dietary patterns and mortality in Danish men and women: a prospective observational study. Br J Nutr 2001; 85(2): 219-25.
84. Nicklas TA, Webber LS, Thompson B, Berenson GS. A multivariate model for assessing eating patterns and their relationship to cardiovascular risk factors: the Bogalusa Heart Study. Am J Clin Nutr 1989; 49(6): 1320-7.
85. Markaki I, Linos D, Linos A. The inluence of dietary patterns on the development of thyroid cancer. Eur J Cancer Oxf Engl 2003; 39(13): 1912-9.
86. Fung T, Hu FB, Fuchs C, Giovannucci E, Hunter DJ, Stampfer MJ, et al. Major dietary patterns and the risk of colorectal cancer in women. Arch Intern Med 2003; 163(3): 309-14.
87. Kim MK, Sasaki S, Sasazuki S, Tsugane S, Japan Public Health Center-based Prospective Study Group. Prospective study of three major dietary patterns and risk of gastric cancer in Japan. Int J Cancer J Int Cancer 2004; 110(3): 435-42.
88. Mizoue T, Yamaji T, Tabata S, Yamaguchi K, Shimizu E, Mineshita M, et al. Dietary patterns and colorectal adenomas in Japanese men: the Self-Defense Forces Health Study. Am J Epidemiol 2005; 161(4): 338-45.
89. Balder HF, Goldbohm RA, van den Brandt PA. Dietary patterns associated with male lung cancer risk in the Netherlands Cohort Study. Cancer Epidemiol Biomark Prev Publ Am Assoc Cancer Res Cosponsored Am Soc Prev Oncol 2005; 14(2): 483-90.
90. Meyerhardt JA, Niedzwiecki D, Hollis D, Saltz LB, Hu FB, Mayer RJ, et al. Association of dietary patterns with cancer recurrence and survival in patients with stage III colon cancer. JAMA 2007; 298(7): 754-64.
91. Campbell PT, Sloan M, Kreiger N. Dietary patterns and risk of incident gastric adenocarcinoma. Am J Epidemiol 2008; 167(3): 295-304.
92. Sant M, Allemani C, Sieri S, Krogh V, Menard S, Tagliabue E, et al. Salad vegetables dietary pattern protects against HER-2-positive breast cancer: a prospective Italian study. Int J Cancer J Int Cancer 2007; 121(4): 911-4.
93. Hirose K, Matsuo K, Iwata H, Tajima K. Dietary patterns and the risk of breast cancer in Japanese women. Cancer Sci 2007; 98(9): 143-8.
94. Schulz M, Hoffmann K, Weikert C, Nöthlings U, Schulze MB, Boeing H. Identiication of a dietary pattern characterized by high-fat food choices associated with increased risk of breast cancer: the European Prospective Investigation into Cancer and Nutrition (EPIC)-Potsdam Study. Br J Nutr 2008; 100(5): 942-6.
95. De Stefani E, Bofetta P, Fagundes RB, Deneo-Pellegrini H, Ronco AL, Acosta G, et al. Nutrient patterns and risk of squamous cell carcinoma of the esophagus: a factor analysis in uruguay. Anticancer Res 2008; 28(4C): 2499-506.
96. Cottet V, Touvier M, Fournier A, Touillaud MS, Lafay L, Clavel-Chapelon F, et al. Postmenopausal breast cancer risk and dietary patterns in the E3N-EPIC prospective cohort study. Am J Epidemiol 2009; 170(10): 1257-67.
98. Pham T-M, Fujino Y, Kikuchi S, Tamakoshi A, Matsuda S, Yoshimura T. Dietary patterns and risk of stomach cancer mortality: the Japan collaborative cohort study. Ann Epidemiol 2010; 20(5): 356-63.
99. Edefonti V, Bravi F, Garavello W, La Vecchia C, Parpinel M, Franceschi S, et al. Nutrient-based dietary patterns and laryngeal cancer: evidence from an exploratory factor analysis. Cancer Epidemiol Biomark Prev Publ Am Assoc Cancer Res Cosponsored Am Soc Prev Oncol 2010; 19(1): 18-7.
100. Mishra GD, dos Santos Silva I, McNaughton SA, Stephen
A, Kuh D. Energy intake and dietary patterns in childhood and throughout adulthood and mammographic density: results from a British prospective cohort. Cancer Causes Control 2011; 22(2): 227-35.
101. Biel RK, Friedenreich CM, Csizmadi I, Robson PJ,
McLaren L, Faris P, et al. Case-control study of dietary patterns and endometrial cancer risk. Nutr Cancer 2011; 63(5): 673-86.
102. Zhang C-X, Ho SC, Fu J-H, Cheng S-Z, Chen Y-M,
Lin F-Y. Dietary patterns and breast cancer risk among Chinese women. Cancer Causes Control 2011; 22(1): 115-24.
103. Buck K, Vrieling A, Flesch-Janys D, Chang-Claude
J. Dietary patterns and the risk of postmenopausal breast cancer in a German case-control study. Cancer Causes Control 2011; 22(2): 273-82.
104. Demetriou CA, Hadjisavvas A, Loizidou MA, Loucaides
G, Neophytou I, Sieri S, et al. The mediterranean dietary pattern and breast cancer risk in Greek-Cypriot women: a case-control study. BMC Cancer 2012; 12: 113.
105. Piyathilake CJ, Badiga S, Kabagambe EK, Azuero A,
Alvarez RD, Johanning GL, et al. A dietary pattern associated with LINE-1 methylation alters the risk of developing cervical intraepithelial neoplasia. Cancer Prev Res Phila Pa 2012; 5(3): 385-92.
106. Bradshaw PT, Siega-Riz AM, Campbell M, Weissler
MC, Funkhouser WK, Olshan AF. Associations between dietary patterns and head and neck cancer: the Carolina head and neck cancer epidemiology study. Am J Epidemiol 2012; 175(12): 1225-33.
107. Schulze MB, Hofmann K, Kroke A, Boeing H. Dietary
patterns and their association with food and nutrient intake in the European Prospective Investigation into Cancer and Nutrition (EPIC)-Potsdam study. Br J Nutr 2001; 85(3): 363-3.
108. Terry P, Hu FB, Hansen H, Wolk A. Prospective study
of major dietary patterns and colorectal cancer risk in women. Am J Epidemiol 2001; 154(12): 1143-9.
109. Randall E, Marshall JR, Graham S, Brasure J. Patterns
in food use and their associations with nutrient intakes. Am J Clin Nutr 1990; 52(4): 739-45.
110. Zhuo XG, Watanabe S. Factor analysis of digestive cancer
mortality and food consumption in 65 Chinese counties. J Epidemiol Jpn Epidemiol Assoc 1999; 9(4): 275-84.
111. Terry P, Suzuki R, Hu FB, Wolk A. A prospective
study of major dietary patterns and the risk of breast cancer. Cancer Epidemiol Biomark Prev Publ Am Assoc Cancer Res Cosponsored Am Soc Prev Oncol 2001; 10(12): 1281-5.
112. Millen BE, Quatromoni PA, Nam B-H, O’Horo CE,
Polak JF, D’Agostino RB. Dietary patterns and the odds of carotid atherosclerosis in women: the Framingham Nutrition Studies. Prev Med 2002; 35(6): 540-7.
113. Newby PK, Muller D, Hallfrisch J, Qiao N, Andres
R, Tucker KL. Dietary patterns and changes in body mass index and waist circumference in adults. Am J Clin Nutr 2003; 77(6): 1417-25.
114. Ledikwe JH, Smiciklas-Wright H, Mitchell DC, Miller
CK, Jensen GL. Dietary patterns of rural older adults are associated with weight and nutritional status. J Am Geriatr Soc 2004; 52(4): 589-95.
115. Fung TT, Stampfer MJ, Manson JE, Rexrode KM,
Willett WC, Hu FB. Prospective study of major dietary patterns and stroke risk in women. Stroke J Cereb Circ 2004; 35(9): 2014-9.
116. Weikert C, Hofmann K, Dierkes J, Zyriax B-C,
Klipstein-Grobusch K, Schulze MB, et al. A homocysteine metabolism-related dietary pattern and the risk of coronary heart disease in two independent German study populations. J Nutr 2005; 135(8): 1981-8.
117. Moreira P, de Almeida MDV, Sampaio D. Cognitive restraint
is associated with higher intake of vegetables in a sample of university students. Eat Behav 2005; 6(3): 229-37.
118. Waijers PMCM, Ocké MC, van Rossum CTM, Peeters
PHM, Bamia C, Chloptsios Y, et al. Dietary patterns and survival in older Dutch women. Am J Clin Nutr 2006; 83(5): 1170-6.
119. Panagiotakos DB, Pitsavos C, Skoumas Y, Stefanadis
C. The association between food patterns and the metabolic syndrome using principal components analysis: The ATTICA Study. J Am Diet Assoc 2007; 107(6): 979-87.
120. McCann SE, McCann WE, Hong C-C, Marshall JR,
Edge SB, Trevisan M, et al. Dietary patterns related to glycemic index and load and risk of premenopausal and postmenopausal breast cancer in the Western New York Exposure and Breast Cancer Study. Am J Clin Nutr 2007; 86(2): 465-71.
121. Okubo H, Sasaki S, Murakami K, Kim MK, Takahashi
122. McNaughton SA, Mishra GD, Stephen AM, Wadsworth MEJ. Dietary patterns throughout adult life are associated with body mass index, waist circumference, blood pressure, and red cell folate. J Nutr 2007; 137(1): 99-105.
123. Okubo H, Sasaki S, Horiguchi H, Oguma E, Miyamoto
K, Hosoi Y, et al. Dietary patterns associated with bone mineral density in premenopausal Japanese farmwomen. Am J Clin Nutr 2006; 83(5): 1185-92.
124. Masala G, Ceroti M, Pala V, Krogh V, Vineis P, Sacerdote
C, et al. A dietary pattern rich in olive oil and raw vegetables is associated with lower mortality in Italian elderly subjects. Br J Nutr 2007; 98(2): 406-15.
125. Esmaillzadeh A, Kimiagar M, Mehrabi Y, Azadbakht L,
Hu FB, Willett WC. Dietary patterns, insulin resistance, and prevalence of the metabolic syndrome in women. Am J Clin Nutr 2007; 85(3): 910-8.
126. Yannakoulia M, Yiannakouris N, Melistas L, Kontogianni
MD, Malagaris I, Mantzoros CS. A dietary pattern characterized by high consumption of whole-grain cereals and low-fat dairy products and low consumption of reined cereals is positively associated with plasma adiponectin levels in healthy women. Metabolism 2008; 57(6): 824-30.
127. Schröder H, Vila J, Marrugat J, Covas M-I. Low energy
density diets are associated with favorable nutrient intake proile and adequacy in free-living elderly men and women. J Nutr 2008; 138(8): 1476-1.
128. McNaughton SA, Ball K, Mishra GD, Crawford DA.
Dietary patterns of adolescents and risk of obesity and hypertension. J Nutr 2008; 138(2): 364-70.
129. Lutsey PL, Stefen LM, Stevens J. Dietary intake and
the development of the metabolic syndrome: the Atherosclerosis Risk in Communities study. Circulation 2008; 117(6): 754-61.
130. Nanri A, Yoshida D, Yamaji T, Mizoue T, Takayanagi
R, Kono S. Dietary patterns and C-reactive protein in Japanese men and women. Am J Clin Nutr 2008; 87(5): 1488-96.
131. Konstantinova SV, Tell GS, Vollset SE, Ulvik A, Drevon
CA, Ueland PM. Dietary patterns, food groups, and nutrients as predictors of plasma choline and betaine in middle-aged and elderly men and women. Am J Clin Nutr 2008; 88(6): 1663-9.
132. McNaughton SA, Mishra GD, Brunner EJ. Food
patterns associated with blood lipids are predictive of coronary heart disease: the Whitehall II study. Br J Nutr 2009; 102(4): 619-24.
133. Vujkovic M, Steegers EA, Looman CW, Ocké MC, Van
der Spek PJ, Steegers-Theunissen RP. The maternal Mediterranean dietary pattern is associated with a reduced risk of spina biida in the ofspring. BJOG Int J Obstet Gynaecol 2009; 116(3): 408-15.
134. Brantsaeter AL, Haugen M, Samuelsen SO, Torjusen
H, Trogstad L, Alexander J, et al. A dietary pattern characterized by high intake of vegetables, fruits, and vegetable oils is associated with reduced risk of preeclampsia in nulliparous pregnant Norwegian women. J Nutr 2009; 139(6): 1162-8.
135. Oddy WH, Robinson M, Ambrosini GL, O’Sullivan
TA, de Klerk NH, Beilin LJ, et al. The association between dietary patterns and mental health in early adolescence. Prev Med 2009; 49(1): 39-44.
136. Nafar M, Noori N, Jalali-Farahani S, Hosseinpanah F,
Poorrezagholi F, Ahmadpoor P, et al. Mediterranean diets are associated with a lower incidence of metabolic syndrome one year following renal transplantation. Kidney Int 2009; 76(11): 1199-206.
137. Gustaw-Rothenberg K. Dietary patterns associated
with Alzheimer’s disease: population based study. Int J Environ Res Public Health 2009; 6(4): 1335-40.
138. Vujkovic M, de Vries JH, Dohle GR, Bonsel GJ, Lindemans
J, Macklon NS, et al. Associations between dietary patterns and semen quality in men undergoing IVF/ICSI treatment. Hum Reprod Oxf Engl 2009; 24(6): 1304-12.
139. Nanri A, Kimura Y, Matsushita Y, Ohta M, Sato M,
Mishima N, et al. Dietary patterns and depressive symptoms among Japanese men and women. Eur J Clin Nutr 2010; 64(8): 832-9.
140. Bakolis I, Hooper R, Thompson RL, Shaheen SO.
Dietary patterns and adult asthma: population-based case-control study. Allergy 2010; 65(5): 606-15.
141. Gu Y, Nieves JW, Stern Y, Luchsinger JA, Scarmeas
N. Food combination and Alzheimer disease risk: a protective diet. Arch Neurol 2010; 67(6): 699–706.
142. Shi Z, Hu X, Yuan B, Pan X, Dai Y, Holmboe-Ottesen
G. Association between dietary patterns and anaemia in adults from Jiangsu Province in Eastern China. Br J Nutr 2006; 96(5): 906-12.
143. Hamer M, McNaughton SA, Bates CJ, Mishra GD.
Dietary patterns, assessed from a weighed food record, and survival among elderly participants from the United Kingdom. Eur J Clin Nutr 2010; 64(8): 853-61.
144. Yakub M, Iqbal MP, Iqbal R. Dietary patterns are
associated with hyperhomocysteinemia in an urban Pakistani population. J Nutr 2010; 140(7): 1261-6.
145. Jacka FN, Pasco JA, Mykletun A, Williams LJ, Hodge
AM, O’Reilly SL, et al. Association of Western and traditional diets with depression and anxiety in women. Am J Psychiatry 2010; 167(3): 305-11.
146. Hardcastle AC, Aucott L, Fraser WD, Reid DM,
147. Chatzi L, Melaki V, Sarri K, Apostolaki I, Roumeliotaki T, Georgiou V, et al. Dietary patterns during pregnancy and the risk of postpartum depression: the mother-child “Rhea” cohort in Crete, Greece. Public Health Nutr 2011; 14(9): 1663-70.
148. Keding GB, Msuya JM, Maass BL, Krawinkel MB.
Dietary patterns and nutritional health of women: the nutrition transition in rural Tanzania. Food Nutr Bull 2011; 32(3): 218-26.
149. Noh HY, Song YJ, Lee JE, Joung H, Park MK, Li SJ,
et al. Dietary patterns are associated with physical growth among school girls aged 9-11 years. Nutr Res Pract 2011; 5(6): 569-77.
150. Timmermans S, Steegers-Theunissen RPM, Vujkovic
M, Bakker R, den Breeijen H, Raat H, et al. Major dietary patterns and blood pressure patterns during pregnancy: the Generation R Study. Am J Obstet Gynecol 2011; 205(4): 337.e1-12.
151. Zhang FF, Morabia A, Carroll J, Gonzalez K, Fulda
K, Kaur M, et al. Dietary patterns are associated with levels of global genomic DNA methylation in a cancer-free population. J Nutr 2011; 141(6): 1165-71.
152. Howard AL, Robinson M, Smith GJ, Ambrosini GL, Piek JP,
Oddy WH. ADHD is associated with a “Western” dietary pattern in adolescents. J Atten Disord 2011; 15(5): 403-11.
153. McNaughton SA, Wattanapenpaiboon N, Wark JD,
Nowson CA. An energy-dense, nutrient-poor dietary pattern is inversely associated with bone health in women. J Nutr 2011; 141(8): 1516-23.
154. Pierce BL, Argos M, Chen Y, Melkonian S, Parvez F,
Islam T, et al. Arsenic exposure, dietary patterns, and skin lesion risk in bangladesh: a prospective study. Am J Epidemiol 2011; 173(3): 345-54.
155. Jacka FN, Pasco JA, Mykletun A, Williams LJ, Nicholson
GC, Kotowicz MA, et al. Diet quality in bipolar disorder in a population-based sample of women. J Afect Disord 2011; 129(1-3): 332-7.
156. Grieger JA, Scott J, Cobiac L. Dietary patterns and
breast-feeding in Australian children. Public Health Nutr 2011; 14(11): 1939-47.
157. Cho YA, Kim J, Cho ER, Shin A. Dietary patterns and the
prevalence of metabolic syndrome in Korean women. Nutr Metab Cardiovasc Dis 2011; 21(11): 893-900.
158. Smithers LG, Brazionis L, Golley RK, Mittinty
MN, Northstone K, Emmett P, et al. Associations between dietary patterns at 6 and 15 months of age and sociodemographic factors. Eur J Clin Nutr 2012; 66(6): 658-66.
159. Hodge A, Almeida OP, English DR, Giles GG, Flicker L.
Patterns of dietary intake and psychological distress in older Australians: beneits not just from a Mediterranean diet. Int Psychogeriatr 2013; 25(3): 456-66.
160. Weng T-T, Hao J-H, Qian Q-W, Cao H, Fu J-L, Sun Y,
et al. Is there any relationship between dietary patterns and depression and anxiety in Chinese adolescents? Public Health Nutr 2012; 15(4): 673-82.
161. Yu F-J, Huang M-C, Chang W-T, Chung H-F, Wu
C-Y, Shin S-J, et al. Increased ferritin concentrations correlate with insulin resistance in female type 2 diabetic patients. Ann Nutr Metab 2012; 61(1): 32-40.
162. Hong S, Song Y, Lee KH, Lee HS, Lee M, Jee SH, et
al. A fruit and dairy dietary pattern is associated with a reduced risk of metabolic syndrome. Metabolism 2012; 61(6): 883-90.
163. Azadbakht L, Esmaillzadeh A. Dietary patterns and
attention deicit hyperactivity disorder among Iranian children. Nutr Burbank Los Angel Cty Calif 2012; 28(3): 242-9.
164. Sichieri R, Castro JFG, Moura AS. Fatores associados ao
padrão de consumo alimentar da população brasileira urbana. Cad Saúde Pública 2003; 19: S47-53.
165. Martikainen P, Brunner E, Marmot M. Socioeconomic
diferences in dietary patterns among middle-aged men and women. Soc Sci Med 2003; 56(7): 1397-410.
166. Sánchez-Villegas A, Delgado-Rodríguez M,
Martínez-González MA, De Irala-Estévez J, Seguimiento Universidad de Navarra group. Gender, age, socio-demographic and lifestyle factors associated with major dietary patterns in the Spanish Project SUN (Seguimiento Universidad de Navarra). Eur J Clin Nutr 2003; 57(2): 285-92.
167. Hofmann K, Schulze MB, Schienkiewitz A, Nöthlings
U, Boeing H. Application of a New Statistical Method to Derive Dietary Patterns in Nutritional Epidemiology. Am J Epidemiol 2004; 159(10): 935-44.
168. Northstone K, Emmett P. Multivariate analysis of
diet in children at four and seven years of age and associations with socio-demographic characteristics. Eur J Clin Nutr 2005; 59(6): 751-60.
169. Yang EJ, Kerver JM, Song WO. Dietary patterns of
Korean Americans described by factor analysis. J Am Coll Nutr 2005; 24(2): 115-21.
170. Alves ALS, Olinto MTA, Costa JSD da, Bairros FS de,
Balbinotti MAA. [Dietary patterns of adult women living in an urban area of Southern Brazil]. Rev Saúde Pública 2006; 40(5): 865-73.
171. Pala V, Sieri S, Masala G, Palli D, Panico S, Vineis P, et
al. Associations between dietary pattern and lifestyle, anthropometry and other health indicators in the elderly participants of the EPIC-Italy cohort. Nutr Metab Cardiovasc Dis 2006; 16(3): 186-201.
172. Weismayer C, Anderson JG, Wolk A. Changes in the
173. Nettleton JA, Steffen LM, Schulze MB, Jenny NS, Barr RG, Bertoni AG, et al. Associations between markers of subclinical atherosclerosis and dietary patterns derived by principal components analysis and reduced rank regression in the Multi-Ethnic Study of Atherosclerosis (MESA). Am J Clin Nutr 2007; 85(6): 1615-25.
174. Northstone K, Emmett PM, Rogers I. Dietary patterns
in pregnancy and associations with nutrient intakes. Br J Nutr 2008; 99(2): 406-15.
175. Sánchez-Villegas A, Toledo E, Bes-Rastrollo M,
Martín-Moreno JM, Tortosa A, Martínez-González MA. Association between dietary and beverage consumption patterns in the SUN (Seguimiento Universidad de Navarra) cohort study. Public Health Nutr 2009; 12(3): 351-8.
176. Serra-Majem L, Bes-Rastrollo M, Román-Viñas B, Pfrimer
K, Sánchez-Villegas A, Martínez-González MA. Dietary patterns and nutritional adequacy in a Mediterranean country. Br J Nutr 2009; 101 Suppl 2: S21-8.
177. Cutler GJ, Flood A, Hannan P, Neumark-Sztainer D.
Major patterns of dietary intake in adolescents and their stability over time. J Nutr 2009; 139(2): 323-8.
178. Ambrosini GL, Oddy WH, Robinson M, O’Sullivan
TA, Hands BP, de Klerk NH, et al. Adolescent dietary patterns are associated with lifestyle and family psycho-social factors. Public Health Nutr 2009; 12(10): 1807-15.
179. Northstone K, Emmett PM. Dietary patterns of men
in ALSPAC: associations with socio-demographic and lifestyle characteristics, nutrient intake and comparison with women’s dietary patterns. Eur J Clin Nutr 2010; 64(9): 978-86.
180. Chen G-W, Ding W-H, Ku H-Y, Chao H-R, Chen H-Y,
Huang M-C, et al. Alkylphenols in human milk and their relations to dietary habits in central Taiwan. Food Chem Toxicol Int J Publ Br Ind Biol Res Assoc 2010; 48(7): 1939-44.
181. Kjøllesdal MR, Holmboe-Ottesen G, Mosdøl A, Wandel
M. The relative importance of socioeconomic indicators in explaining diferences in BMI and waist: hip ratio, and the mediating efect of work control, dietary patterns and physical activity. Br J Nutr 2010; 104(8): 1230-40.
182. Mishra GD, McNaughton SA, Ball K, Brown WJ,
Giles GG, Dobson AJ. Major dietary patterns of young and middle aged women: results from a prospective Australian cohort study. Eur J Clin Nutr 2010; 64(10): 1125-33.
183. Langsetmo L, Poliquin S, Hanley DA, Prior JC, Barr
S, Anastassiades T, et al. Dietary patterns in Canadian men and women ages 25 and older: relationship to demographics, body mass index, and bone mineral density. BMC Musculoskelet Disord 2010; 11: 20.
184. Rezazadeh A, Rashidkhani B, Omidvar N. Association
of major dietary patterns with socioeconomic and lifestyle factors of adult women living in Tehran, Iran. Nutr Burbank Los Angel Cty Calif 2010; 26(3): 337-41.
185. Olinto MTA, Willett WC, Gigante DP, Victora CG.
Sociodemographic and lifestyle characteristics in relation to dietary patterns among young Brazilian adults. Public Health Nutr 2011; 14(1): 150-9.
186. Hare-Bruun H, Togo P, Andersen LB, Heitmann BL.
Adult Food Intake Patterns Are Related to Adult and Childhood Socioeconomic Status. J Nutr 2011; 141(5): 928-34.
187. Bibiloni M del M, Martínez E, Llull R, Pons A, Tur JA.
Western and Mediterranean dietary patterns among Balearic Islands’ adolescents: socio-economic and lifestyle determinants. Public Health Nutr 2012; 15(4): 683-92.
188. Charreire H, Kesse-Guyot E, Bertrais S, Simon C, Chaix
B, Weber C, et al. Associations between dietary patterns, physical activity (leisure-time and occupational) and television viewing in middle-aged French adults. Br J Nutr 2011; 105(6): 902-10.
189. Lee JE, Kim J-H, Son SJ, Ahn Y, Lee J, Park C, et al.
Dietary pattern classiications with nutrient intake and health-risk factors in Korean men. Nutr Burbank Los Angel Cty Calif 2011; 27(1): 26-33.
190. Cho ER, Shin A, Lim S-Y, Kim J. Dietary patterns and
their associations with health behaviours in Korea. Public Health Nutr 2011; 14(2): 356-64.
191. Nobre LN, Lamounier JA, Franceschini SCC. Padrão
alimentar de pré-escolares e fatores associados. J Pediatr (Rio J) 2012; 88(2): 129-36.
192. Mullie P, Aerenhouts D, Clarys P. Demographic,
socioeconomic and nutritional determinants of daily versus non-daily sugar-sweetened and artificially sweetened beverage consumption. Eur J Clin Nutr 2012; 66(2): 150-5.
193. Mohammadifard N, Sarrafzadegan N, Nouri F, Sajjadi
F, Alikhasi H, Maghroun M, et al. Using factor analysis to identify dietary patterns in Iranian adults: Isfahan Healthy Heart Program. Int J Public Health 2012; 57(1): 235-41.
194. Elstgeest LEM, Mishra GD, Dobson AJ. Transitions
in living arrangements are associated with changes in dietary patterns in young women. J Nutr 2012; 142(8): 1561-7.
195. Villegas R, Xiang YB, Cai H, Elasy T, Cai Q, Zhang