Raman spectroscopic study of the mineral qingheiite
Na
2
(Mn
2+
,Mg,Fe
2+
)
2
(Al,Fe
3+
)(PO
4
)
3
, a pegmatite phosphate
mineral from Santa Ana pegmatite, Argentina
Ray L. Frost
a,⇑, Yunfei Xi
a, Ricardo Scholz
b, Andrés López
a, Caio Moreira
b, Jorge Carvalho de Lena
b aChemistry Discipline, Faculty of Science and Technology, Queensland University of Technology, GPO Box 2434, Brisbane, Queensland 4001, Australia b
Geology Department, School of Mines, Federal University of Ouro Preto, Campus Morro do Cruzeiro, Ouro Preto, MG 35,400-00, Brazil
h i g h l i g h t s
We have studied the pegmatite phosphate mineral qingheiite. The formula was determined as
Na1:39ðMn1:42;Mg0:87;Fe 2þ
0:64;
Zn0:01ÞP2:94ðAl0:43;Fe 3þ
0:35ÞP0:78
ðPO4Þ2:99.
The Raman spectra shows the phosphate anion is very strongly distorted.
The presence of water was
determined by infrared spectroscopy.
g r a p h i c a l
a b s t r a c t
a r t i c l e
i n f o
Article history:
Received 12 November 2012 Received in revised form 5 March 2013 Accepted 7 May 2013
Available online 30 May 2013
Keywords: Phosphate Qingheiite Pegmatite Raman spectroscopy Infrared spectroscopy
a b s t r a c t
The pegmatite mineral qingheiite Na2(Mn2+,Mg,Fe2+)2(Al,Fe3+)(PO4)3has been studied by a combination
of SEM and EMP, Raman and infrared spectroscopy. The studied sample was collected from the Santa Ana pegmatite, Argentina. The mineral occurs as a primary mineral in lithium bearing pegmatite, in asso-ciation with beausite and lithiophilite. The Raman spectrum is characterized by a very sharp intense Raman band at 980 cm1assigned to the PO3
4 symmetric stretching mode. Multiple Raman bands are observed in the PO3
4 antisymmetric stretching region, providing evidence for the existence of more than one phosphate unit in the structure of qingheiite and evidence for the reduction in symmetry of the phosphate units. This concept is affirmed by the number of bands in the m4andm2bending regions. No intensity was observed in the OH stretching region in the Raman spectrum
but significant intensity is found in the infrared spectrum. Infrared bands are observed at 2917, 3195, 3414 and 3498 cm1are assigned to water stretching vibrations. It is suggested that some water is
coor-dinating the metal cations in the structure of qingheiite.
Ó2013 Elsevier B.V. All rights reserved.
Introduction
Qingheiite is a rare Na, Mn and Al phosphate mineral and belongs to the wyllieite group. This mineral group shows general
chemical formula given as: Na2(M1)(M2)(X)(PO4)6, where M1 can
be occupied by Mn and Fe; M2 by Fe, Mg and Mn and X by Al and Fe. The group also includes a number of minerals such as
bobfergusonite, ferrorosemaryite, ferrowyllieite, qingheiite-(Fe2+)
and rosemaryite[1].
Qingheiite is the Mg end-member of the wyllieite subgroup and is typically found in granitic pegmatites. The chemical formula can
be written as Na2(Mn2+,Mg,Fe2+)2(Al,Fe3+)(PO4)3. The mineral
crystallizes in the monoclinic crystal system, space groupP21/b,
1386-1425/$ - see front matterÓ2013 Elsevier B.V. All rights reserved. http://dx.doi.org/10.1016/j.saa.2013.05.048
⇑Corresponding author. Tel.: +61 7 3138 2407; fax: +61 7 3138 1804. E-mail address:[email protected](R.L. Frost).
Contents lists available atSciVerse ScienceDirect
Spectrochimica Acta Part A: Molecular and
Biomolecular Spectroscopy
unit cell parameter:a= 11.85 Å,b= 12.41 Å,c= 6.42 Å,b= 114.45°,
V= 859.45 Å3. The mineral was discovered in a muscovite-bearing
granitic pegmatite of Qinghe County, Altai Prefecture, Uygur
Autonomous Region of Xinjiang, China[2]. Despite the type
local-ity, qingheiite was also described from Santa Ana pegmatite,
Argentina[3], and Sowie Mountains, Poland[4].
Raman spectroscopy has proven very useful for the study of minerals. Indeed Raman spectroscopy has proven most useful for the study of secondary minerals as often occurs with minerals con-taining phosphate groups. In the infrared study of triploidite, a ba-sic manganese phosphate, S.D. Ross (in Framer’s treatise page 383)
reports the infrared spectrum with the (
m
1) at 957 cm1, (m
3) at1090, 1058, 1030 and 1010 cm1, (
m
2) at 420 cm1and the
m
4modeat 595, 570, 486 cm1[5–7]. An hydroxyl stretching wavenumber
of 3509 cm1 was given. In the Raman spectroscopic study of
strengite, in the region below 400 cm1, Frost and Weier[8,9]
de-scribed the metal stretching vibrations for FeO and also the OFeO bending modes.
The objective of this research is to report the vibrational spectra of qingheiite and to relate the spectra to the molecular structure of the mineral. Chemical characterization was done with support of Electron Probe Micro Analysis (EMP).
Experimental
Occurrence, samples description and preparation
The qingheiite sample studied in this work was collected from the Santa Ana pegmatite, Argentina. The mineral occurs as a pri-mary mineral in lithium bearing pegmatite, in association with beausite and lithiophilite. The mineral occurs as millimetric to cen-timetric veins in a matrix beauzite and lithiophilite exsolution. Qingheiite shows deep green color and vitreous luster. The sample was incorporated in the mineral collection of the Geology Depart-ment of the Federal University of Ouro Preto, Minas Gerais, Brazil, with sample code SAA-095. The Santa Ana pegmatite is located in the Cerro La Torre pegmatite group, Totoral pegmatite field of the Pampean pegmatite province. A detailed geological and
mineralog-ical study of the pegmatite was carried out by Galliski et al.[3].
The qingheiite sample was gently crushed and to remove con-taminant phases, the fragments were carefully hand-picked using a Stereomicroscope Leica Model EZ4. The fragments were prepared to be analyzed by different methods. The qingheiite sample was phase analyzed by X-ray diffraction. Scanning electron microscopy in the EDS mode (SEM/EDS) was applied to support the mineralog-ical characterization.
Scanning electron microscopy (SEM)
Experiments and analyses involving electron microscopy were performed in the Center of Microscopy of the Universidade Federal
de Minas Gerais, Belo Horizonte, Minas Gerais, Brazil (http://
www.microscopia.ufmg.br).
A fragment of a qingheiite single crystal was prepared in a car-bon tape. Due to the low vacuum conditions the sample was not metalized. Secondary Electron and Backscattering Electron images were obtained using a JEOL JSM-6360LV equipment. Qualitative and semi-quantitative chemical analysis in the EDS mode were performed with a ThermoNORAN spectrometer model Quest and was applied to support the mineral characterization.
Electron microprobe analysis (EMP)
EMP was performed in a qingheiite single crystal. The chemical analysis was done using a Jeol JXA8900R with four WDS
spectrometers at the Physics Department of the Federal University of Minas Gerais, Belo Horizonte. For each selected element the fol-lowing standards were applied: Mn (rhodonite), Fe (magnetite), Ca
(Ca2P2O7), Mg (MgO), Zn (Sphalerite), Na (Albite) and P (Ca2P2O7).
Samples of qingheiite embedded in an epoxy resin were coated with a thin layer of evaporated carbon. The EMP analysis was performed at 15 kV of accelerating voltage and beam current of 10 nA.
Raman spectroscopy
Crystals of qingheiite were placed on a polished metal surface on the stage of an Olympus BHSM microscope, which is equipped
with 10, 20, and 50objectives. The microscope is part of a
Renishaw 1000 Raman microscope system, which also includes a monochromator, a filter system and a CCD detector (1024 pixels). The Raman spectra were excited by a Spectra-Physics model 127 He–Ne laser producing highly polarized light at 633 nm and
col-lected at a nominal resolution of 2 cm1 and a precision of
±1 cm1in the range between 200 and 4000 cm1. Repeated
acqui-sitions on the crystals using the highest magnification (50) were
accumulated to improve the signal to noise ratio of the spectra.
Raman Spectra were calibrated using the 520.5 cm1 line of a
silicon wafer. The Raman spectrum of at least 10 crystals was col-lected to ensure the consistency of the spectra.
Infrared spectroscopy
Infrared spectra were obtained using a Nicolet Nexus 8700 FTIR spectrometer with a Smart Endurance single bounce diamond ATR
cell. Spectra over the 4000–525 cm1range were obtained by the
co-addition of 128 scans with a resolution of 4 cm1and a mirror
veloc-ity of 0.6329 cm/s. Spectra were co-added to improve the signal to noise ratio. The infrared spectra are given in Supplementary information.
Spectral manipulation such as baseline correction/adjustment and smoothing were performed using the SpectraCalc software pack-age GRAMS (Galactic Industries Corporation, NH, USA). Band compo-nent analysis was undertaken using the Jandel ‘Peakfit’ software package that enabled the type of fitting function to be selected and allows specific parameters to be fixed or varied accordingly. Band fit-ting was done using a Lorentzian–Gaussian cross-product function with the minimum number of component bands used for the fitting process. The Gaussian–Lorentzian ratio was maintained at values greater than 0.7 and fitting was undertaken until reproducible results
were obtained with squared correlations ofr2greater than 0.995.
Results and discussion
Chemical characterization
SEM image of qingheiite is shown inFig. 1. The quantitative
chemical analysis of qingheiite mineral (sample SAA-095) is
pre-sented inTable 1. Composition is the result of measurements by
EMP in the WDS mode. Fe2+and Fe3+were calculated by
stoichiom-etry and the chemical formula was calculated on the basis of 12 oxygen atoms on the structure. The chemical composition
indi-cates a partial substitution of Mn by Mg, Fe2+and Zn. Chemical
for-mula can be expressed as:
Na1:39ðMn1:42;Mg0:87;Fe 2þ
0:64
;Zn0:01ÞR2
:94ðAl0:43;Fe 3þ
0:35ÞR0:78ðPO4Þ2:99
Vibrational spectroscopy
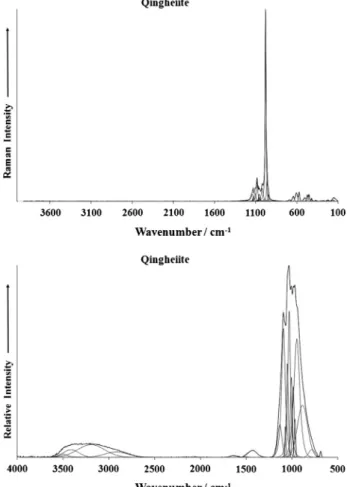
The Raman spectrum of qingheiite in the 100–4000 cm1
spec-tral range is illustrated inFig. 1a. This figure shows the position
and relative intensities of the Raman bands of qingheiite. It is noted that there are large parts of the spectrum where no intensity is ob-served. Thus, the spectrum is subdivided into sections based upon the particular type of vibration. It is noted that there is no intensity in the OH stretching region. The infrared spectrum of qingheiite
over the 500–4000 cm1spectral range is reported inFig. 1b. This
spectrum displays the position and relative intensity of the infra-red bands of qingheiite. It is noted that some significant intensity exists in the OH stretching region. This spectrum may then be sub-divided into sections based upon the type of vibration being studied.
Table 1
Chemical composition of qingheiite. FeO and Fe2O3 calculated by stoichiometry. Formula calculated on the basis of 12 O atoms.
Constituent wt.% Number of cations Range (wt.%)
P2O5 45.67 2.99 45.28–46.48
Na2O 9.26 1.39 9.02–9.56
MnO 21.76 1.42 21.08–22.02
MgO 7.42 0.87 7.34–7.67
FeO 4.95 0.64 Calculated by stoichiometry
CaO 0.71 0.06 0.64–0.80
ZnO 0.16 0.01 0.05–0.27
Al2O3 4.70 0.43 4.61–4.81
Fe2O3 5.96 0.35 Calculated by stoichiometry
Total 100.63
Fig. 2.(a) Raman spectrum of qingheiite over the 800–1400 cm1spectral range.
(b) Infrared spectrum of qingheiite over the 500–1300 cm1spectral range. Fig. 3.(a) Raman spectrum of qingheiite over the 300–800 cm
The Raman spectrum of qingheiite in the 800–1400 cm1
spec-tral range is shown inFig. 2a. The spectrum is dominated by a very
sharp intense Raman band at 980 cm1. This band is assigned to
the PO3
4 symmetric stretching mode. The band is not perfectly
symmetric and shoulder bands may be resolved at 945 and
964 cm1. These bands may also be assigned to the phosphate
symmetric stretching vibration. The observation of these two bands provides evidence for the non-equivalence of the phosphate units in the molecular structure of qingheiite. In the spectral region
1000–1200 cm1, complexity is found with quite a number of
overlapping bands. Raman bands are observed at 1021, 1047,
1058, 1083, 1106, 1130, 1136 and 1140 cm1. These bands are
as-signed to the PO3
4 antisymmetric stretching modes. The
observa-tion of so many bands provides support for the multiple symmetric stretching mode. Further, the number of bands provides evidence that the symmetry of the phosphate units is reduced.
The infrared spectrum of qingheiite in the 500–1300 cm1
spec-tral range is illustrated in Fig. 2b. The infrared spectral profile
shows great complexity and is composed of a significant number of overlapping bands. Infrared bands at 1007, 1030, 1051, 1074,
1094 and 1134 cm1 are attributed to the PO3
4 antisymmetric
stretching modes. The number of bands is in harmony with the
number of Raman bands observed inFig. 2a. The infrared band at
986 cm1may be assigned to the PO3
4 symmetric stretching mode.
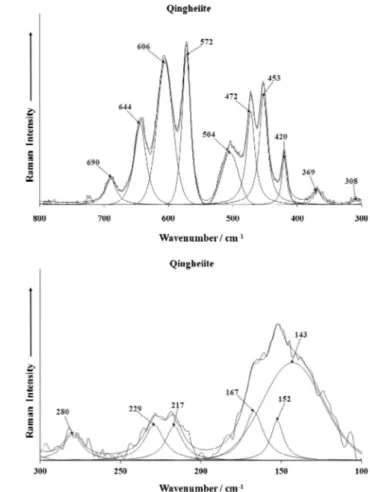
The Raman spectrum of qingheiite in the 300–800 cm1and in
the 100–300 cm1spectral range are reported inFig. 3a and b. The
first spectrum may be decomposed into sections. The first section
is between 500 and 700 cm1. This region is where the
out-of-plane bending modes are found. The bands at 572, 606, 644 and
690 cm1 are assigned to the
m
4 bending modes. The second
section is the region between 400 and 520 cm1. This spectral
re-gion is where the in-plane bending modes are observed. Raman
bands are found at 420, 453, 472 and 504 cm1and are assigned
to the
m
2bending modes. The third section is the region between300 and 400 cm1. This spectral region is where the metal–oxygen
stretching vibrations are found. The observation of multiple bands
in the
m
4andm
2bending region supports the concept of a reductionin symmetry of the phosphate units in the qingheite structure. This suggests the structure of the phosphate anion is distorted. Perhaps, this is not unexpected because of the complexity of the formula of
qingheite Na2(Mn2+,Mg,Fe2+)–(Al,Fe3+)(PO4)3. Raman bands in the
far low wavenumber region (Fig. 4b) are simply described as lattice
modes.
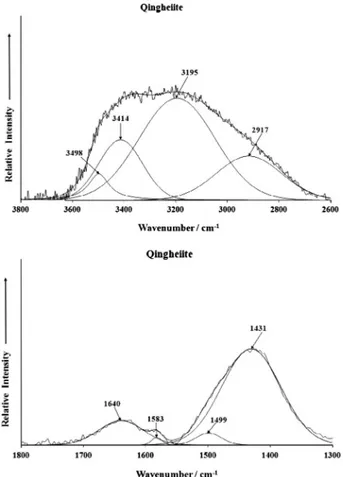
The infrared spectrum of qingheite in the 2600–3800 cm1
spectral range is displayed inFig. 4a and the infrared spectrum of
qingheiite in the 1300–1800 cm1 spectral range is shown in
Fig. 4b. It is noted that no intensity was observed in these spectral
regions in the Raman spectrum. A broad envelope is observed in
Fig. 4a. Infrared bands are found at 2917, 3195, 3414 and
3498 cm1. These bands are attributed to water stretching
vibra-tions. The water is adsorbed on the surface of the qingheiite and may interact with the phosphate units. Infrared bands are observed
in the 1300–1800 cm1 spectral range at 1431, 1499, 1583 and
1640 cm1. This latter band is assigned to the water bending mode.
Conclusions
Phosphate minerals are commonly found in pegmatites, of these wide range of minerals are the phosphate minerals of which qingheiite is an example. Qingheiite is a rare Na, Mn and Al phosphate mineral. The studied sample was collected from the Santa Ana pegmatite, Argentina. The mineral occurs as a primary mineral in lithium bearing pegmatite, in association with beusite and lithiophilite. The mineral is a multi cation anhydrous
phos-phate mineral of formula Na2(Mn2+,Mg,Fe2+)2(Al,Fe3+)(PO4)3. We
have studied this mineral by using a combination of SEM/EPA, Ra-man and infrared spectroscopy. EMP analysis shows chemical for-mula expressed as
Na1:39ðMn1:42;Mg0:87;Fe 2þ
0:64;Zn0:01ÞR2
:94ðAl0:43;Fe 3þ
0:35ÞR0:78ðPO4Þ2:99:
The vibrational spectra of qingheiite have been studied and related to the mineral structure. The Raman spectrum is characterized by a
very sharp intense Raman band at 980 cm1assigned to the PO3
4
symmetric stretching mode. Multiple Raman bands are observed
in the PO3
4 antisymmetric stretching region, providing evidence
for the existence of more than one phosphate unit in the structure of qingheiite and evidence for the reduction in symmetry of the phosphate units. This concept is affirmed by the number of bands
in the
m
4andm
2bending regions. Interestingly, no intensity wasob-served in the OH stretching region in the Raman spectrum but sig-nificant intensity is found in the infrared spectrum.
Acknowledgments
The financial and infra-structure support of the Queensland University of Technology, Chemistry discipline is gratefully acknowledged. The Australian Research Council (ARC) is thanked for funding the instrumentation. The authors would like to acknowledge the Center of Microscopy at the Universidade Federal
de Minas Gerais (http://www.microscopia.ufmg.br) for providing
the equipment and technical support for experiments involving electron microscopy. R. Scholz thanks to CNPq – Conselho Nacional de Desenvolvimento Científico e Tecnológico (Grant No. 306287/ 2012-9).
Fig. 4.(a) Infrared spectrum of qingheiite over the 2600–4000 cm1spectral range. (b) Infrared spectrum of qingheiite over the 1300–1800 cm1spectral range.
Appendix A. Supplementary material
Supplementary data associated with this article can be found, in
the online version, athttp://dx.doi.org/10.1016/j.saa.2013.05.048.
References
[1] M.E. Back, J.A. Mandarino, Fleischer’s Glossary of Mineral Species, 10th ed., Mineralogical Record, Tucson, 2008.
[2]Z. Ma, N. Shi, Z. Peng, Sci. Sinica B26 (1983) 876–884.
[3]M.A. Galliski, J.C. Oyarzabal, M.F. Marquez-Zavalia, R. Chapman, Can. Min. 47 (2009) 1213–1223.
[4]M. Łodzin´ski, M. Sitarz, EUCMOS, Spectrosc. App. Archaeol., Arts, Geol. Miner. (2008).
[5]R.L. Frost, Y. Xi, S.J. Palmer, K. Tan, G.J. Millar, J. Mol. Struct. 1011 (2012) 128– 133.
[6]R.L. Frost, Y. Xi, R. Scholz, F.M. Belotti, Trans. Met. Chem. 37 (2012) 777–782. [7]R.L. Frost, Y. Xi, R. Scholz, F.M. Belotti, L.E. Lagoeiro, Phys. Chem. Miner. 39
(2012) 803–810.
[8]R.L. Frost, Spectrochim. Acta 60A (2004) 1439–1445.