Raman and infrared spectroscopic characterization of beryllonite, a sodium and
beryllium phosphate mineral – implications for mineral collectors
Ray L. Frost
a,⇑, Yunfei Xi
a, Ricardo Scholz
b, Fernanda M. Belotti
c, Luiz Alberto Dias Menezes Filho
daSchool of Chemistry, Physics and Mechanical Engineering, Science and Engineering Faculty, Queensland University of Technology, GPO Box 2434, Brisbane Queensland 4001, Australia bGeology Department, School of Mines, Federal University of Ouro Preto, Campus Morro do Cruzeiro, Ouro Preto, MG, 35400-00, Brazil
cFederal University of Itajubá, Campus Itabira, Itabira, MG, Brazil
dGeology Department, Institute of Geosciences, Federal University of Minas Gerais, Belo Horizonte, MG, 31270-901, Brazil
h i g h l i g h t s
"We have studied the mineral beryllonite.
"Be isotopes play an important role in the dating of sediments and in the study of relief evolution.
"We have characterized beryllonite using vibrational spectroscopic techniques.
"The pegmatitic phosphates are more readily studied by Raman
spectroscopy.
g r a p h i c a l
a b s t r a c t
a r t i c l e
i n f o
Article history: Received 30 May 2012
Received in revised form 16 July 2012 Accepted 17 July 2012
Available online 4 August 2012
Keywords: Raman spectroscopy Infrared spectroscopy Beryllonite Pegmatite Phosphate Beryllium
a b s t r a c t
The mineral beryllonite has been characterized by the combination of Raman spectroscopy and infrared spectroscopy. SEM–EDX was used for the chemical analysis of the mineral. The intense sharp Raman band at 1011 cm 1, was assigned to the phosphate symmetric stretching mode. Raman bands at 1046, 1053,
1068 and the low intensity bands at 1147, 1160 and 1175 cm 1are attributed to the phosphate
antisym-metric stretching vibrations. The number of bands in the antisymantisym-metric stretching region supports the concept of symmetry reduction of the phosphate anion in the beryllonite structure. This concept is sup-ported by the number of bands found in the out-of-plane bending region. Multiple bands are also found in the in-plane bending region with Raman bands at 399, 418, 431 and 466 cm 1. Strong Raman bands at
304 and 354 cm 1are attributed to metal oxygen vibrations. Vibrational spectroscopy served to
deter-mine the molecular structure of the deter-mineral. The pegmatitic phosphate deter-minerals such as beryllonite are more readily studied by Raman spectroscopy than infrared spectroscopy.
Ó2012 Elsevier B.V. All rights reserved.
Introduction
Beryllium is a typical chemical element found in granitic pegmatites. Most of the beryllium minerals belong to the silicate classes, and the most common are beryl, phenakite, euclase and bertrandite. Beryllium metal is an important element in industry with different applications in metallurgy, especially in the produc-tion of copper, aluminum and magnesium alloys. Beryllium has
also importance for the defense and aerospace industry, due to its stiffness, light weight and dimensional stability over a wide temperature range[1]. Despite the importance for industry, the major field of use of Be minerals is in the gemstones and the jewelry market, specially the beryl varieties emerald, aquamarine, morganite and hellyodor; and the Be oxide chrysoberyl, that includes the color changing variety alexandrite.
Characterization of beryllium mineral paragenesis is an impor-tant tool in the study of geological and geochemical evolution of granitic and alkaline pegmatites [2]. Be isotopes also play an important role in the dating of sediments and in the study of relief
1386-1425/$ - see front matterÓ2012 Elsevier B.V. All rights reserved.
http://dx.doi.org/10.1016/j.saa.2012.07.067
⇑Corresponding author. Tel.: +61 7 3138 2407; fax: +61 7 3138 1804. E-mail address:r.frost@qut.edu.au(R.L. Frost).
Contents lists available atSciVerse ScienceDirect
Spectrochimica Acta Part A: Molecular and
Biomolecular Spectroscopy
evolution [3–5]. Beryllium is also a hazardous element and is responsible to development of chronic beryllium disease (CBD) [3,4], arousing interest in the environmental sciences. Be phos-phates are relatively rare in nature and are related to the
hydro-thermal and supergene processes in granitic pegmatites [6]. A
number of twenty-six phosphate minerals are known in nature and approved by the International Mineralogical Association (IMA). The most common Be phosphates are hydroxylherderite, moraesite, beryllonite and the minerals related to the roscherite group[7], Cerny´[5]and Cerná et al.[8]describe beryllium phos-phates as secondary product of latte alteration of beryl, while Moore[9]describes beryllonite as a hydrothermal product after
amblygonite–montebrasite. Beryllonite (NaBePO4) is a sodium
beryllium phosphate mineral and it’s the only natural anhydrous phosphate. It was first described by Edward S. Dana in 1888[10] in samples from Oxford pegmatite field, Oxford Co., Maine, USA. The mineral was named due its beryllium content. Beryllonite is a rare gemstone and also has importance for the mineral collectors market.
The crystal structure of beryllonite was determined by Golovas-tikov[11]and refined by Giusepetti and Tadini[12]. Beryllonite crystallize in the monoclinic system, P21/c space group, with
a= 8.178(3) Å, b= 7.818(3) Å, c= 14.114(6) Å, b= 90.00° and V= 893.97 Å3, and has analogous structure to trimerite[13]. The
thermal expansion of crystal structure of beryllonite was
determi-nate[14]. In the crystal structure of beryllonite, PO4and BeO4
tet-rahedra are linked by shared oxygen atoms in a three-dimensional network and form pseudo-ditrigonal rings perpendicular to theb axis. The independent Na atoms lying in the channels formed by the rings are coordinated as an irregular nine-cornered polyhedron and as distorted octahedral[12].
Published datas concerning the spectroscopic characterization of beryllium phosphates are rare in the literature. In the character-ization of fluid inclusions in quartz from granitic pegmatites, Rickers et al.[15] describes Raman bands for herderite at 584, 595, 983 and 1005 cm 1; however, the authors gave no description
or assignment of the bands. In recent studies, in reference to the data published by Rickers et al., Pedrosa-Soares et al. [16] de-scribed Raman vibrations related to (PO4)3 anion in herderite at
584 (
m
4), 983 (m
1) and 1005 (m
3) cm 1.The aims of this work are to understand the structure of beryll-onite with the application of the vibrational spectroscopic methods infrared and Raman spectroscopy for an assessment of the molec-ular structure of the mineral.
Occurrence and general appearance
The Telírio mine, located in the municipality of Divino das Laranjeiras, Linópolis district, is a well-known pegmatite in Brazil, being an important source of rare phosphates. The pegmatite is lo-cated in the Conselheiro Pena pegmatite district, one of the subdi-visions of the Eastern Brazilian Pegmatite Province (EBP)[17]. The Telírio mine is mined for gemstones and samples for the collectors market and nowadays is the most important source of brazilianite worldwidly. The pegmatite has been explored since the sixties and has revealed the best montebrasite specimens of the world.
The pegmatite is heterogeneous with mineralogical and textural zoning well developed. It has symmetric lens shape with the longer axis trending to NW–SE and body dips sub vertical. The minimum extension is of about 50 and 10 m thickness. The pegmatite is hosted by quartz–mica schist with garnet, staurolite and sillima-nite of the São Tomé formation. Hydrothermal and metasomatic fluids were responsible for the albitization and development of miarolitic cavities, and a complex secondary phosphate assem-blage was described by Chaves et al.[18].
The primary mineral association is represented by quartz, muscovite, microcline, schorl, almandine–spessartine, spodumene and F rich montebrasite. The secondary association is mainly com-posed by albite, Ta and Nb oxides, cassiterite, pyrite and a complex paragenesis of phosphates formed in the result of alteration of montebrasite[18].
In the Telírio pegmatite, secondary phosphates, namely brazil-ianite, eosphorite, fluorapatite, F rich montebrasite, beryllonite, hydroxylherderite, moraesite, purpurite–heterosite, zanazziite and siderite are common minerals in miarolitic cavities and in massive blocks formed after the crystals of primary montebrasite and triphylite. The primary phosphates occur in nodules up to 0.5 m length. Beryllonite single crystals and twins up to 3 cm and occur in association with fluorapatite, brazilianite, montebrasite, eosphorite, moraesite and rare cassiterite.
Experimental
Occurrence, sample description and preparation
For the development of this work, one natural single crystal specimens of beryllonite was chosen for our investigation. Samples were collected in the Telírio mine and were incorporated to the collection of the Geology Department of the Federal University of Ouro Preto, Minas Gerais with sample code SAA-078. The crystal is colorless and transparent, with up to 0.8 cm along the
crystallo-graphic c axis and has prismatic form. The beryllonite sample
studied in this work was found in miarolitic cavities in association with brazilianite and fluorapatite. To support the identification of the samples one fragment up to 1 mm3was placed in a carbon tape
and analyzed by SEM/EDS. The spectra shows a simple chemical composition with sodium and phosphorous as expected for beryllonite.
Raman microprobe spectroscopy
A beryllonite single crystal was placed on a polished metal sur-face on the stage of an Olympus BHSM microscope, which is equipped with 10, 20, and 50objectives. The microscope is part of a Renishaw 1000 Raman microscope system, which also includes a monochromator, a filter system and a CCD detector (1024 pixels). The Raman spectra were excited by a Spectra-Physics model 127 He–Ne laser producing highly polarised light at 633 nm and
col-lected at a nominal resolution of 2 cm 1 and a precision of
±1 cm 1in the range between 200 and 4000 cm 1. Repeated
acqui-sitions on the crystals using the highest magnification (50) were accumulated to improve the signal to noise ratio of the spectra. The spectra were collected over night. Raman spectra were calibrated using the 520.5 cm 1line of a silicon wafer.
A Raman spectrum of beryllonite may be found on the RRUFF database at http://rruff.info/beryllonite/R070249, however, no interpretation is given. The sample originated from Melrose Farm Beryllonite prospects (McAllister prospects), Stoneham, Oxford County, Maine, USA. No band assignments were given. The spectrum of this sample has been downloaded and reported in
theSupplementary information as Figs. S1–S4.
Infrared spectroscopy
Infrared spectra were obtained using a Nicolet Nexus 870 FTIR spectrometer with a smart endurance single bounce diamond
ATR cell. Spectra over the 4000–525 cm 1 range were obtained
by the co-addition of 128 scans with a resolution of 4 cm 1and a
Spectral manipulation such as baseline correction/adjustment and smoothing were performed using the Spectracalc software package GRAMS (Galactic Industries Corporation, NH, USA). Band component analysis was undertaken using the Jandel ‘Peakfit’ soft-ware package that enabled the type of fitting function to be se-lected and allows specific parameters to be fixed or varied accordingly. Band fitting was done using a Lorentzian–Gaussian cross-product function with the minimum number of component bands used for the fitting process. The Gaussian–Lorentzian ratio was maintained at values greater than 0.7 and fitting was under-taken until reproducible results were obtained with squared correlations ofr2greater than 0.995.
Results and discussion
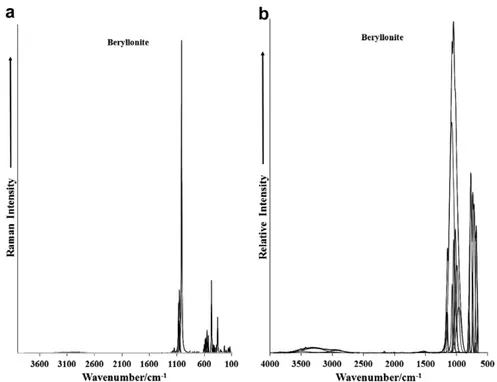
The Raman spectrum of beryllonite in the 100–4000 cm 1
spec-tral range is illustrated inFig. 1a. The Raman spectrum of beryllo-nite from the RRUFF data base is given inSupplementary Fig. S1. This spectrum displays the position and relative intensity of the Raman bands. It is noted and spectral intensity in the 2600– 4000 cm 1 spectral region is minimal. It is noted that there are
large parts of the spectrum where no intensity is observed. Thus, the spectrum is divided into sections according to the type of vibration being observed. The infrared spectrum over the 500– 4000 cm 1spectral range is shown inFig. 1b. This figure records
the position and relative intensity of the infrared bands. Some intensity is now observed in the OH stretching region.
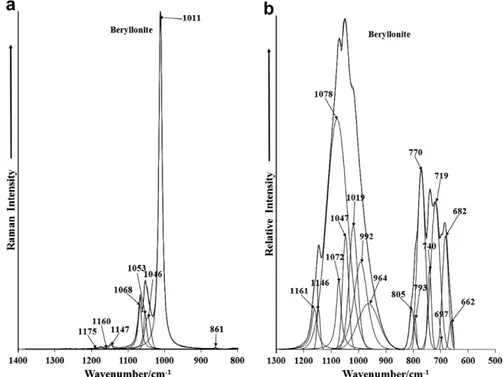
The Raman spectrum of the phosphate stretching region is re-ported inFig. 2a. The Raman spectrum from the RRUFF data base is reported inSupplementary Fig. S2. The spectrum is dominated by a single very sharp band at 1011 cm 1. This band is assigned
to the
m
1PO43symmetric stretching vibration. The series of bandsat 1046, 1053 and 1068 cm 1 are attributed to the
m
3PO43
anti-symmetric stretching vibration. The position of these bands is in contrast to that found by Rickers et al.[15]. The number and posi-tion of the phosphate bands in Rickers et al. work differs from that reported in this work. The RRUFF Raman spectrum of beryllonite displays a very intense band at 1011 cm 1with a shoulder band
at 1007 cm 1. RRUFF Raman bands were also found at 1046,
1066 and 1146 cm 1. These bands differ in position from this work.
The infrared spectrum of beryllonite over the 500–1300 cm 1
spectral range is illustrated inFig. 2b. The infrared spectrum of the phosphate stretching region shows complexity with a number of overlapping bands which may be resolved. The most intense bands at 1047 and 1078 are described as due to the
m
3PO43anti-symmetric stretching vibrational mode as is the low intensity bands at 1146 and 1161 cm 1. These bands are also observed in
the Raman spectrum as low intensity bands at 1147, 1160 and 1175 cm 1. The shoulder band at 1019 cm 1is assigned to the
m
1
PO3
4 symmetric stretching vibration. The series of bands in the
600–800 cm 1are due to the phosphate bending modes.
The Raman spectra of beryllonite in the 300–800 cm 1and in
the 100–300 cm 1region are reported inFig. 3a and b. The series
of bands at 522, 530, 547, 557, 568, 582, 599 and 612 cm 1are
as-signed to the
m
4out of plane bending modes of the PO4, units. TheRaman spectrum of NaH2PO4shows Raman bands at 526, 546 and
618 cm 1. The observation of multiple bands in this spectral region
supports the concept of symmetry reduction of both the phosphate and hydrogen phosphate units. The RRUFF Raman spectrum shows bands at 522, 529, 546, 567, 571 and 600 cm 1. The position of
these bands is in excellent agreement with the bands found in this work.
The intense band at 466 cm 1with other bands of lower
wave-number at 399, 418 and 431 cm 1are assigned to the
m
2in-plane
bending modes of the PO4, units. In the RRUFF Raman spectrum
(Supplementary Fig. S3), bands are observed at 353, 398, 432 and 465 cm 1. Some variation in the peak positions is noted between
the RUFF Raman spectrum and this work. The number of bands ob-served in the phosphate bending region supports the concept of symmetry reduction in the structure of beryllonite. This symmetry reduction is also confirmed by the number of bands in the phos-phate stretching region where a large number of bands are found in the antisymmetric stretching region. The intense band at 354 cm 1 is thought to be a metal–oxygen stretching vibration.
The band is observed at 353 cm 1in the RRUFF Raman spectrum.
A series of bands are found in the 100–300 cm 1spectral region
(Fig. 3b). Raman bands are observed at 131, 142, 161, 195, 212,
231 and 281 cm 1. These bands are simply defined as lattice
modes. In the RRUFF Raman spectrum (Supplementary Fig. S4), bands are observed at 161, 169, 192, 224, 233, 280 and 296 cm 1. The position of these bands is close to the position of
the Raman bands reported in this work.
Conclusions
Beryllonite is a somewhat rare sodium beryllium phosphate mineral with formula NaBePO4. The tabular to prismatic
mono-clinic crystals vary from colorless to white or pale yellowish, and
are transparent with a vitreous lustre. The mineral has the poten-tial to be a source of beryllium metal. Beryllonite occurs as a sec-ondary beryllium mineral in granitic and alkalic pegmatites. It was first described from complex crystals and as broken fragments in the disintegrated material of a granitic vein at Stoneham, Oxford County, Maine where it is associated with feldspar, smoky quartz, beryl and columbite.
We have characterized the mineral beryllonite using vibrational spectroscopic techniques. A comparison is made with the Raman spectrum of beryllonite from the RRUFF data base. The mineral is
characterized by an intense sharp Raman band at 1011 cm 1,
Fig. 2.(a) Raman spectrum of beryllonite over the 800–1400 cm 1spectral range; (b) infrared spectrum of beryllonite over the 500–1300 cm1spectral range.
assigned to the phosphate symmetric stretching mode. Raman bands at 1046, 1053, 1068 and the low intensity bands at 1147, 1160 and 1175 cm 1are attributed to the phosphate
ric stretching vibrations. The number of bands in the antisymmet-ric stretching region supports the concept of symmetry reduction of the phosphate anion in the beryllonite structure. This concept is supported by the number of bands found in the out-of-plane bending region. Multiple bands are also found in the in-plane bending region with Raman bands at 399, 418, 431 and 466 cm 1. Strong Raman bands at 304 and 354 cm 1are attributed
to metal oxygen vibrations. Bands in the Raman spectrum are nar-row and well resolved in comparison with the infrared spectrum where a complex spectral profile may be resolved into component bands. What this proves is that the pegmatitic phosphate minerals such as beryllonite are more readily studied by Raman spectroscopy.
Acknowledgements
The financial and infra-structure support of the Discipline of Nanotechnology and Molecular Science, Science and Engineering Faculty of the Queensland University of Technology, is gratefully acknowledged. The Australian Research Council (ARC) is thanked for funding the instrumentation. R. Scholz thanks to FAPEMIG – Fundação de Amparo à Pesquisa do estado de Minas Gerais, (Grant no. CRA - APQ-03998-10).
Appendix A. Supplementary data
Supplementary data associated with this article can be found, in the online version, athttp://dx.doi.org/10.1016/j.saa.2012.07.067.
References
[1] H.G. Dill, Earth Sci. Rev. (2010) 1–420. [2] B. Charoy, Euro. J. Mineral. 11 (1999) 135–148.
[3] R.T. Sawyer, L.A. Maier, L.A. Kittle, L.S. Newman, Int. J. Immunopharmacol. 2 (2002) 249–261.
[4] A.B. Stefaniak, G.A. Day, M.D. Hoover, P.N. Breysse, R.C. Scripsick, Toxicol. in Vitro 20 (2006) 82–95.
[5] P. Cˇerny´, Rev. Mineral. Geochem. 50 (2002) 405–444. [6] D.M. Burr, Econ. Geol. 70 (1975) 1279–1292.
[7] D. Atencio, P.A. Matioli, J.B. Smith, N.V. Chukanov, J.M.V. Coutinho, R.K. Rastsvetaeva, S. Möckel, Am. Mineral. 93 (2008) 1–6.
[8] I. Cerna, P. Cerny, J.B. Selway, R. Chapman, Can. Mineral. 40 (2002) 1339–1345. [9] Morre, Mineral. Rec. 4 (1973) 103.
[10] E.S. Dana, Amer. J. Sc. 36 (1888) 290–291. [11] N.I. Golovastikov, Kristallografiya 6 (1961) 909–917.
[12] G. Giuseppetti, C. Tadini, Tsch. Mineral. Petr. Mitt. 20 (1973) 1–12. [13] K.H. Klaska, O. Jarchow, Z. Kristallogr. 145 (1977) 46–65. [14] C.M.B. Henderson, D. Taylor, Mineral. Mag. 48 (1984) 431–436. [15] K. Rickers, R. Thomas, W. Heinrich, Mineral. Dep. 41 (2006) 229.
[16] A.C. Pedrosa-Soares, N.C.M. De, C.M. Campos, N.L.C. Da, R.J. Silva, S.M. Medeiros, C. Castañeda, G.N. Queiroga, E. Dantas, I.A. Dussin, F. Alkmim, Geol. Soc. Spec. Pub. 350 (2011) 25–51.
[17] K. Rickers, R. Thomas, W. Heinrich, Miner. Deposita 41 (2006) 229. [18] M.L.S.C. Chaves, R. Scholz, D. Atencio, J. Karfunkel, Geociências 24 (2005) 143–