Genetic Determinants of Metabolism and
Benign Prostate Enlargement: Associations
with Prostate Volume
Ayush Giri1, Todd L. Edwards1,2,3, Saundra S. Motley3, Susan H. Byerly3, Jay H. Fowke1,3,4*
1Institute for Medicine and Public Health, Vanderbilt Epidemiology Center, Vanderbilt University Medical Center, Nashville, TN, United States of America,2Vanderbilt Genetics Institute, Vanderbilt University, Nashville, TN, United States of America,3Division of Epidemiology, Department of Medicine, Vanderbilt University Medical Center, Nashville, TN, United States of America,4Department of Surgical Urology, Vanderbilt University Medical Center, Nashville, TN, United States of America
Abstract
Prostate enlargement leading to clinical benign prostatic hyperplasia (BPH) is associated with metabolic dysregulation and obesity. The genetic basis of this association is unclear. Our objective was to evaluate whether single nucleotide polymorphisms (SNPs) previously associated with metabolic disorders are also associated with prostate volume (PV). Partici-pants included 876 men referred for prostate biopsy and found to be prostate cancer free. PV was measured by transrectal ultrasound. Samples were genotyped using the Illumina Cardio-MetaboChip platform. Multivariable adjusted linear regression models were used to evaluate SNPs (additive coding) in relation to natural-log transformed (log) PV. We com-pared SNP-PV results from biopsy-negative men to 442 men with low-grade prostate cancer with similar levels of obesity and PV. Beta-coefficients from the discovery and replication samples were then aggregated with fixed effects inverse variance weighted meta-analysis. SNP rs11736129 (near the pseudo-geneLOC100131429) was significantly associated with log-PV (beta: 0.16, p-value 1.16x10⁻⁸) after adjusting for multiple testing. Other noteworthy SNPs that were nominally associated (p-value<1x10⁻⁴
) with log-PV included rs9583484 (intronic SNP inCOL4A2), rs10146527 (intronic SNP inNRXN3), rs9909466 (SNP near RPL32P31), and rs2241606 (synonymous SNP inSLC12A7). We found several SNPs in
metabolic loci associated with PV. Further studies are needed to confirm our results and elu-cidate the mechanism between these genetic loci, PV, and clinical BPH.
Introduction
A highly prevalent condition in aging men, benign prostatic hyperplasia (BPH) is the non-malignant proliferation of the epithelial and stromal cells in the prostate gland [1]. It is often diagnosed in the presence of enlarged prostate and bladder outlet obstruction leading to lower OPEN ACCESS
Citation:Giri A, Edwards TL, Motley SS, Byerly SH, Fowke JH (2015) Genetic Determinants of Metabolism and Benign Prostate Enlargement: Associations with Prostate Volume. PLoS ONE 10(7): e0132028. doi:10.1371/journal.pone.0132028
Editor:Zoran Culig, Innsbruck Medical University, AUSTRIA
Received:January 29, 2015
Accepted:June 9, 2015
Published:July 9, 2015
Copyright:© 2015 Giri et al. This is an open access article distributed under the terms of theCreative Commons Attribution License, which permits unrestricted use, distribution, and reproduction in any medium, provided the original author and source are credited.
urinary tract symptoms (LUTS)[1]. In the year 2000, there were approximately 4.5 million phy-sician visits with a primary diagnosis of BPH, and approximately 1.3 billion dollars were spent in healthcare costs relating to BPH care [2]. Given the aging population in the US and the high prevalence of BPH, costs of treatment are likely to remain high.
The etiology of BPH is not fully understood. In the last decade, interest has increased for metabolic syndrome and markers of metabolism as potential risk factors for BPH and LUTS [3–7]. Several studies have found a positive association between measures of obesity (body mass index, waist to hip ratio, waist circumference) and a number of outcomes related to BPH
including increased prostate volume (PV), LUTS, and BPH treatment [8–14]. A recent
second-ary analysis of the Reduction by DUtasteride of prostate Cancer Events (REDUCE) trial showed that not only was obesity positively associated with prostate volume, but that obesity also attenuated the effects of dutasteride to reduce PV [15]. Factors associated with increased risk for cardiovascular disease, such as elevated fasting blood glucose levels, insulin levels, and
diabetes [4,5,13,14,16–18], dysregulated lipids [16,18,19], and inflammation [20–24] have been
associated with increased risk for BPH and/or LUTS. Similarly, meta-analyses have reported that moderate regular alcohol consumption [25] and physical exercise [26] are inversely associ-ated with BPH and risk for cardiovascular disease.
While genetic susceptibility to metabolic dysregulation may contribute to BPH progression, few studies have evaluated genetic susceptibility to BPH. A study among twins found high con-cordance rates for benign prostate disease, suggesting a hereditary influence [27]. Most studies examining genetic markers for association with BPH have evaluated a few candidate genes involved in androgen activity, including androgen receptors and steroid alpha-reductase type
II (SRD5A2). However, results from these studies are not conclusive [28–31], and, much like
prostate cancer (PC), it is unclear that genetic variability in androgen activity contributes to PV or BPH progression. In contrast, there do appear to be shared associations between BPH and PC susceptibility, as a recent study evaluating 14 SNPs previously associated with PC found
SNPs nearIRX4,ITGA6, andRFX6genes were also associated with increased BPH risk or
increased BPH aggressiveness [32]. The exact mechanisms of how these genes may promote PC or BPH are not clear. To date, there has been no systematic evaluation of the genome in relation to BPH.
We used the Illumina Cardio-MetaboChip to evaluate associations between PV and over 100,000 genetic polymorphisms in genes or genomic regions previously associated with anthropomorphic and metabolic traits [33]. Considering the consistent evidence for an associ-ation between metabolic dysregulassoci-ation and BPH, but the limited number of studies investigat-ing genetic risk factors for BPH, our study provides the most thorough evaluation to date of the hypothesis that BPH and metabolism share common genetic determinants.
Methods
Participants for this study were participants of the Nashville Men’s Health Study (NMHS), a
multi-center, rapid-recruitment protocol targeting men seeking a diagnostic prostate biopsy. Briefly, among men referred for prostate biopsy to VUMC and to the Tennessee Valley Veter-ans Administration in Nashville between January 1, 2006 and March 30, 2011, men who were
40 years of age, had English proficiency sufficient for informed consent, no prior diagnosis of
PC, no prior prostate surgery, and reported no current use of androgen supplementation were considered eligible for participation. Institutional review boards at Vanderbilt University Medi-cal Center (VUMC) and at the Tennessee Valley Veterans Administration (Nashville, TN) approved all study aspects including and not limited to recruitment, data collection protocols and written informed consent procedures. All study participants provided written informed
Funding:Funding for the Nashville Men's Health Study (NMHS) was provided by the National Institutes of Health Grant numbers: RO1CA121060 and RO1DK087962. The funders had no role in study design, data collection and analysis, decision to publish or preparation of the manuscript.
consent. Recruitment procedures were conducted prior to the prostate biopsy and transrectal ultrasound (TRUS) procedures to prevent selection bias during data collection associated with knowledge of outcome.
Trained research staff collected information on demographic characteristics and lifestyle factors, and measured anthropometric traits including height, weight, hip and waist circum-ference, which were used to calculate body mass index (BMI) and waist-to-hip ratio (WHR). Blood samples were genotyped with the Illumina Cardio-MetaboChip [33], which is a geno-typing array of 217,695 SNPs within 257 genomic regions implicated in 23 metabolic traits including obesity, fasting glucose, blood lipids and several cardiovascular traits. Information
on PC diagnoses, tumor aggressiveness—as reported by total Gleason score, and prostate
vol-ume (ml)—as determined by TRUS, were abstracted from medical charts. A single
patholo-gist then reviewed over 90% of the biopsies. Men with a negative biopsy and without indication of PC, pathology suspicious of PC, or high-grade prostatic intraepithelial neopla-sia were considered without PC at that time and eligible for our analysis. Patients with posi-tive result from prostate biopsy and confirmed as having non-metastatic PC (PC as primary cancer diagnosis) at recruitment were considered cases. PC cases with a total Gleason score of 7 or more were defined as high-grade PC cases.
A total of 969 eligible men free of PC with DNA availability were randomly selected for gen-otyping and served as our primary research group to examine the relationship between SNPs and prostate volume. We also wanted to investigate the consistency of any signals in a separate group of 520 men with low-grade PC. These men were recruited from the same recruitment protocol as the biopsy-negative men, with identical data and bio-specimen protocols. The rationale for the comparison is that low-grade and localized PC lesions are common, and with the exception of the detection of a localized tumor, men without PC at biopsy and men with low-grade PC are similar with regard to prostate size, prostate-specific antigen (PSA) levels, BMI, and the prevalence of CVD and other obesity-related comorbidities. We intentionally did not include high-grade PC cases from the validation sample because genetic factors leading to advanced PC are likely to be distinct from those involved in prostate enlargement, and men with high-grade PC had significantly smaller prostate volume and higher PSA levels than men with either low-grade PC or men without PC at biopsy. In other words, elevated PSA levels in men diagnosed with high-grade PC are likely a consequence of the PC, whereas elevated PSA levels among men with low-grade PC are likely, or in large part, a consequence of increasing PV, similar to men with elevated PSA and without PC [34,35].
Data quality control
Nine hundred and forty one men without PC and 459 low-grade PC cases were successfully genotyped. Post genotype-calling quality control (QC) procedures were conducted using the
software package PLINK [36]. Individuals with sample call rates<95% (36 PC-free men, 9 PC
cases) were first excluded. In the remaining samples, SNPs were excluded if genotyping effi-ciency was less than 98% (15,716 SNPs). Identity-by-descent analysis of pruned independent SNPs in linkage equilibrium was conducted to estimate cryptic relatedness between samples. We excluded 15 samples (10 PC-free men and 5 PC cases) as they were either monozygotic twins or inadvertent duplicate samples. Identity-by-descent analysis further revealed 10 sample pairs with detectable cryptic relatedness at the first cousin level or higher. We removed 10 sam-ples (9 PC-free men and 1 PC case) due to cryptic relatedness. We additionally removed SNPs
that deviated from Hardy-Weinberg equilibrium at the p-value threshold<1x10⁻⁶(4,712
876 men without PC at biopsy and a validation sample of 442 men with low-grade PC, for whom data were also available for both prostate volume and genotype information. We limited our investigation to SNPs that had minor allele frequencies of 5% or more, which left us with a total of 100,559 SNPs available for primary data analysis. We used principal component analy-sis with EIGENSOFT to evaluate the presence of population substructure in our study sample. We derived 10 principal components after LD-pruning our dataset to include 39,980
indepen-dent markers with minor allele frequency0.05. A plot representing the first two principal
components for our samples along with reference populations from the International HapMap Project has been published previously [37].
Statistical analysis
We transformed the continuous PV (ml) variable using the natural-log function to approxi-mate the normal distribution. We compared the characteristics of men without PC and men
with low-grade PC with the student’s t-test with unequal variances for comparison of group
means, Mann-Whitney rank sum test for the comparison of group medians, and Pearson’s
chi-squared test for categorical variables. To ensure that the associations between major risk factors for PV in our study sample are comparable to that of other studies that have evaluated PV as a dependent variable, and also to ensure that the associations are similar among men without PC and men with low-grade PC, we used linear regression to evaluate the relationship between important covariates and log-transformed PV.
In primary analyses we used linear regression in PLINK to evaluate the relationship between SNPs (assuming an additive SNP coding model) and natural-log transformed PV in two mod-els 1) a minimally adjusted model including age and 10 principal components; 2) a fully adjusted model including age, height, BMI and 10 principal components in men without PC and men with low-grade PC, separately. Results from both models were similar; we present results from fully adjusted models. We first analyzed men without PC and men with low-grade PC separately, and then to summarize results from these two groups we performed an inverse variance weighted fixed effect meta-analysis of the beta-coefficients from our models consider-ing men without PC and men with low-grade PC. We present beta-coefficients and standard errors as change of log-PV per minor allele. To account for multiple-testing we chose to esti-mate the family-wise error rate (FWER) in our study. We first used simpleM to estiesti-mate the effective number of independent tests [38]. Briefly, simpleM calculates the effective number of tests by accounting for correlations between the SNPs tested. From the 100,538 SNPs we tested, we estimated the effective number of tests to be 64,858. We then divided 0.05 by this number
to establish a p-value threshold (7.71x10⁻⁷) that considers the multiple tests in our study. We
evaluated genomic inflation with a quantile-quantile plot (S1 Fig).
[39–41]. The average genotyping rate for the SNPs included in the analysis was>99%.
Individ-uals for whom information on a given SNP was missing, GRSs were prorated by dividing by the number of contributing alleles by the number of non-missing SNP genotypes per individual.
We then used STATA to regress natural-log transformed values of prostate volume against un-weighted and weighted genetic risk scores for height, BMI and WHR in linear regression models that adjusted for age and 10 principal components of ancestry, and with or without traits of interest (height, BMI, WHR, as applicable).
Results
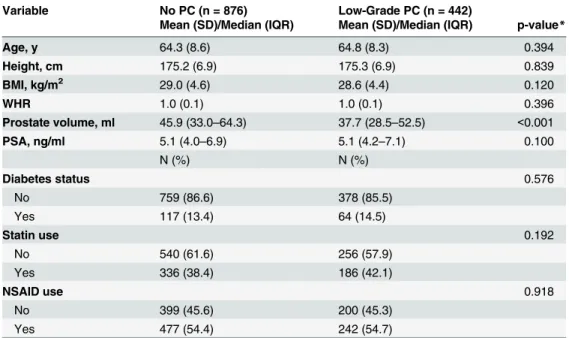
Distribution of characteristics in men without PC and men with low-grade PC are presented in Table 1. Age, BMI, diabetes status, and use of statins or NSAIDs were similar between biopsy-negative men and men with low-grade PC. PV ranged from 2.00 ml to 319 ml in men without PC, and 5.46 ml to 167 ml among men with low-grade PC. Although median prostate volume was approximately 8 ml lower in men with low-grade PC compared with men without PC
(p-value<0.001), a substantial number of men in both groups as a PV>40 ml (44.3%), and PSA
levels were not significantly different across groups.
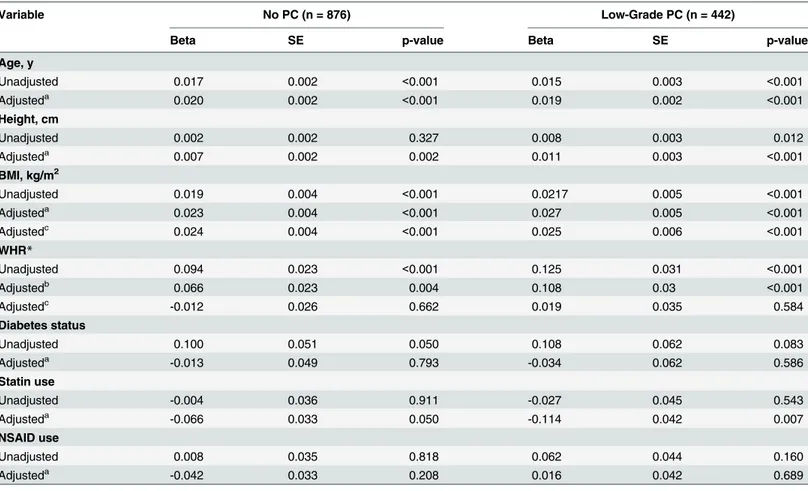
Non-genetic predictors of PV were similar across diagnostic groups. Age, height, BMI, and statin use were all independently and positively associated with increased prostate volume in participants without a PC diagnosis and participants with low-grade PC (Table 2). WHR and diabetes were also associated with PV, but these associations were lost after controlling for age, BMI and other listed covariates. Furthermore, NSAID use was not associated with PV.
A total of 100,538 SNPs with minor allele frequencies of 5% or higher were available for our single variant analyses. We estimated the association between each SNP and PV in
Table 1. Study Characteristics of Men without Prostate Cancer (PC) and with Low-grade PC: the Nash-ville Men’s Health Study.
Variable No PC (n = 876) Low-Grade PC (n = 442)
Mean (SD)/Median (IQR) Mean (SD)/Median (IQR) p-value*
Age, y 64.3 (8.6) 64.8 (8.3) 0.394
Height, cm 175.2 (6.9) 175.3 (6.9) 0.839
BMI, kg/m2 29.0 (4.6) 28.6 (4.4) 0.120
WHR 1.0 (0.1) 1.0 (0.1) 0.396
Prostate volume, ml 45.9 (33.0–64.3) 37.7 (28.5–52.5) <0.001
PSA, ng/ml 5.1 (4.0–6.9) 5.1 (4.2–7.1) 0.100
N (%) N (%)
Diabetes status 0.576
No 759 (86.6) 378 (85.5)
Yes 117 (13.4) 64 (14.5)
Statin use 0.192
No 540 (61.6) 256 (57.9)
Yes 336 (38.4) 186 (42.1)
NSAID use 0.918
No 399 (45.6) 200 (45.3)
Yes 477 (54.4) 242 (54.7)
*p-values from student’s t-test with unequal variances (for comparing group means), or from Mann-Whitney test (for comparing group medians), or Pearson’s chi-squared test (for categorical variables).
SD = Standard deviation; IQR = Inter quartile range
multivariable linear regression models adjusting for age, height, BMI, and 10 principal compo-nents summarizing ancestry. Analyses were conducted within each group, and then inverse variance weighted fixed effect meta-analysis was used to combine beta coefficients from the two clinical groups. There were 5 independent loci associated with PV from the meta-analysis
at a p-value threshold of less than 1x10⁻⁴(Table 3). SNP rs11736129, near theLOC100131429
gene, was the only statistically significant SNP after accounting for multiple testing (Beta 0.16,
p-value 1.16x10⁻⁸), and heterogeneity in the rs11736129 and PV association was low between
the two clinical groups. (I2= 11%), indicating a similar association within each group. SNP
rs9583484, located in the intronic region of theCOL4A2gene was nominally associated with
PV (Beta -0.11, p-value 1.01x10-05), with a stronger association among biopsy-negative men
(I2= 51%). Additionally, two SNPs nearNRXN3(rs10146527, Beta = -0.08, p-value = 3.49x10
-05; rs2202167, Beta = 0.08, p-value = 3.49x10-05), a SNP nearRPL32P31(rs9909466,
Beta = 0.09, p-value = 5.88x10-05) and a synonymous polymorphism in theSLC12A7exon
(rs2241606, Beta = 0.07, p-value = 8.51x10-05) were nominally associated with log-PV at the
p-value threshold of<1x10-04.
Table 2. Determinants of Prostate Volume (Natural Log-transformed) in Men without Prostate Cancer (PC) and with Low-grade PC: the Nashville Men’s Health Study.
Variable No PC (n = 876) Low-Grade PC (n = 442)
Beta SE p-value Beta SE p-value
Age, y
Unadjusted 0.017 0.002 <0.001 0.015 0.003 <0.001
Adjusteda 0.020 0.002 <0.001 0.019 0.002 <0.001
Height, cm
Unadjusted 0.002 0.002 0.327 0.008 0.003 0.012
Adjusteda 0.007 0.002 0.002 0.011 0.003 <0.001
BMI, kg/m2
Unadjusted 0.019 0.004 <0.001 0.0217 0.005 <0.001
Adjusteda 0.023 0.004 <0.001 0.027 0.005 <0.001
Adjustedc 0.024 0.004 <0.001 0.025 0.006 <0.001
WHR*
Unadjusted 0.094 0.023 <0.001 0.125 0.031 <0.001
Adjustedb 0.066 0.023 0.004 0.108 0.03 <0.001
Adjustedc -0.012 0.026 0.662 0.019 0.035 0.584
Diabetes status
Unadjusted 0.100 0.051 0.050 0.108 0.062 0.083
Adjusteda -0.013 0.049 0.793 -0.034 0.062 0.586
Statin use
Unadjusted -0.004 0.036 0.911 -0.027 0.045 0.543
Adjusteda -0.066 0.033 0.050 -0.114 0.042 0.007
NSAID use
Unadjusted 0.008 0.035 0.818 0.062 0.044 0.160
Adjusteda -0.042 0.033 0.208 0.016 0.042 0.689
Unadjusted models: natural log-transformed PV regressed against the variable of interest only
aIndependent variables in the model: Age, Height, BMI and 10 genetic principal components bIndependent variables in the model: Age, Height, WHR and 10 genetic principal components cIndependent variables in the model Age, Height, BMI, WHR and 10 genetic principal components
*Betas represent per 0.1 unit increase in WHR
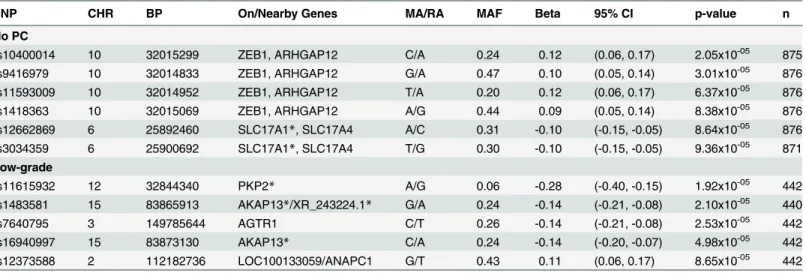
We next identified loci associated with log-PV within each clinical group at a p-value
threshold of<1x10⁻⁴(Table 4). Among men with a negative prostate biopsy, SNPs meeting the
nominal significance level included rs10400014 (Beta = 0.12, p-value = 2.05x10⁻⁵) nearZEB1
and ARHGAP12, and rs12662869 (Beta = -0.10, p-value = 8.64x10⁻⁵) in and intron of
SLC17A1/A4. In men with low-grade PC, PV was associated with SNPs in the intronic regions ofPKP2,AKAP13, and SNPs nearLOC100131429,AGTR1, andANAPC1.
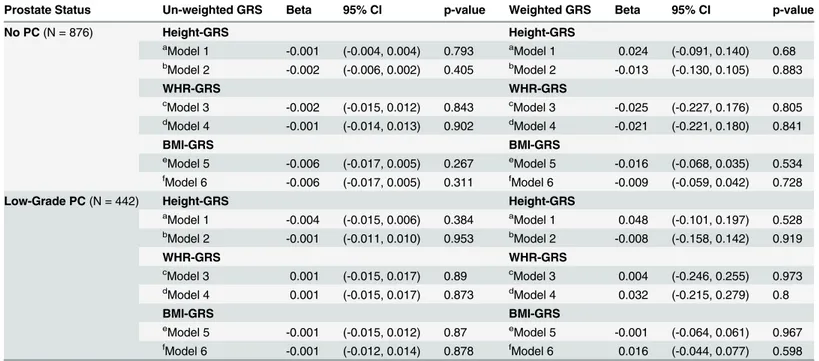
As anthropomorphic traits such as height and measures of obesity are consistently associ-ated with prostate enlargement, we additionally investigassoci-ated the associations between GRSs of height, WHR and BMI in relation to log-PV in each group (Table 5). Both un-weighted and
Table 3. Genetic Determinants of Prostate Volume at p<1x10⁻⁴from Meta-analysis Combining Results across Diagnostic Groups: the Nashville
Men’s Health Study.
No PC Low-Grade PC Fixed effect
meta-analysis
SNP CHR BP On/Nearby Genes MA/RA MAF Beta SE p-value MAF Beta SE p-value Beta p-value I2 rs11736129 4 139605076 LOC100131429 G/C 0.12 0.14 0.04 1.14x10-04 0.10 0.20 0.05 1.97x10-05 0.16 1.16x10-08 11%
rs9583484 13 109764350 COL4A2*/COL4A1 T/G 0.17 -0.13 0.03 1.69x10-05 0.17 -0.06 0.04 9.60x10-02 -0.11 1.01x10-05 51% rs10146527 14 78569603 NRXN3* C/T 0.38 -0.08 0.02 7.35x10-04 0.39 -0.07 0.03 1.70x10-02 -0.08 3.49x10-05 0%
rs2202167 14 78569378 NRXN3* A/C 0.38 -0.08 0.02 8.39x10-04 0.39 -0.07 0.03 1.64x10-02 -0.08 3.80x10-05 0%
rs9909466 17 76113835 RPL32P31 C/G 0.19 0.08 0.03 4.43x10-03 0.21 0.10 0.04 4.63x10-03 0.09 5.88x10-05 0%
rs2241606 5 1110615 SLC12A7** A/G 0.39 0.07 0.03 2.07x10-03 0.39 0.07 0.03 1.55x10-02 0.07 8.51x10-05 0%
CHR = Chromosome; SNP = Single Nucleotide Polymorphism MA = Minor Allele; RA = Referent Allele; MAF = Minor Allele Frequency; I2= amount of
heterogeneity between groups not explained due to chance; Table sorted by Fixed effects P value; *SNP is on the intron region of the gene
**SNP is on the exon region of the gene
doi:10.1371/journal.pone.0132028.t003
Table 4. MetaboChip SNPs Nominally Associated with Natural-log Transformed Prostate Volume at p<1x10⁻⁴in Men without Prostate Cancer (PC) and Men with Low-grade PC: the Nashville Men’s Health Study.
SNP CHR BP On/Nearby Genes MA/RA MAF Beta 95% CI p-value n
No PC
rs10400014 10 32015299 ZEB1, ARHGAP12 C/A 0.24 0.12 (0.06, 0.17) 2.05x10-05 875
rs9416979 10 32014833 ZEB1, ARHGAP12 G/A 0.47 0.10 (0.05, 0.14) 3.01x10-05 876
rs11593009 10 32014952 ZEB1, ARHGAP12 T/A 0.20 0.12 (0.06, 0.17) 6.37x10-05 876
rs1418363 10 32015069 ZEB1, ARHGAP12 A/G 0.44 0.09 (0.05, 0.14) 8.38x10-05 876
rs12662869 6 25892460 SLC17A1*, SLC17A4 A/C 0.31 -0.10 (-0.15, -0.05) 8.64x10-05 876
rs3034359 6 25900692 SLC17A1*, SLC17A4 T/G 0.30 -0.10 (-0.15, -0.05) 9.36x10-05 871
Low-grade
rs11615932 12 32844340 PKP2* A/G 0.06 -0.28 (-0.40, -0.15) 1.92x10-05 442
rs1483581 15 83865913 AKAP13*/XR_243224.1* G/A 0.24 -0.14 (-0.21, -0.08) 2.10x10-05 440
rs7640795 3 149785644 AGTR1 C/T 0.26 -0.14 (-0.21, -0.08) 2.53x10-05 442
rs16940997 15 83873130 AKAP13* C/A 0.24 -0.14 (-0.20, -0.07) 4.98x10-05 442
rs12373588 2 112182736 LOC100133059/ANAPC1 G/T 0.43 0.11 (0.06, 0.17) 8.65x10-05 442
CHR = Chromosome; SNP = Single Nucleotide Polymorphism MA = Minor Allele; RA = Referent Allele; MAF = Minor Allele Frequency; Beta Coefficient from linear regression model evaluating natural log transformed prostate volume as a continuous dependent variable, while adjusting for age (continuous), body mass index (continuous), height (continuous), and 10 genetic ancestry principal components.
*SNP is on the gene; but is on the intron region
weighted GRSs for height, BMI and WHR were not associated with log-prostate volume, with or without adjustment for its corresponding anthropometric trait.
Discussion
Metabolic syndrome and its components have been hypothesized to increase risk for BPH and LUTS, however it is not clear if these associations are at least in part mediated by genetic sus-ceptibility to the metabolic syndrome, and if so, by which specific variants. Hypothesizing that genetic variants related to the metabolic syndrome may also be positively associated with BPH, we evaluated SNPs throughout the genome that have been implicated with several metabolic disorders in relation to prostate volume in men without PC and men with low-grade PC. As the first study to systematically assess this hypothesis, we report a genome-wide significant association and also provide preliminary evidence for several additional loci putatively associ-ated with prostate volume.
rs11736129, the most statistically significant result in our analysis, lies approximately 13
kilo-bases downstream of the pseudo-geneLOC100131429, which bears sequence similarity to
the armadillo repeat containing 1 gene (ARMC1) which encodes a metal ion binding protein.
Table 5. Natural Log-transformed Prostate Volumes Regressed against Un-weighted and Weighted Genetic Risk Scores (GRS) for Height, WHR and BMI with and without Adjustment for Height, WHR and BMI, Respectively, Among Men without Prostate Cancer (PC) and Men with Low-grade PC: the Nashville Men’s Health Study.
Prostate Status Un-weighted GRS Beta 95% CI p-value Weighted GRS Beta 95% CI p-value
No PC(N = 876) Height-GRS Height-GRS
aModel 1 -0.001 (-0.004, 0.004) 0.793 aModel 1 0.024 (-0.091, 0.140) 0.68 b
Model 2 -0.002 (-0.006, 0.002) 0.405 bModel 2 -0.013 (-0.130, 0.105) 0.883
WHR-GRS WHR-GRS
cModel 3 -0.002 (-0.015, 0.012) 0.843 cModel 3 -0.025 (-0.227, 0.176) 0.805 dModel 4 -0.001 (-0.014, 0.013) 0.902 dModel 4 -0.021 (-0.221, 0.180) 0.841
BMI-GRS BMI-GRS
eModel 5 -0.006 (-0.017, 0.005) 0.267 eModel 5 -0.016 (-0.068, 0.035) 0.534 fModel 6 -0.006 (-0.017, 0.005) 0.311 fModel 6 -0.009 (-0.059, 0.042) 0.728
Low-Grade PC(N = 442) Height-GRS Height-GRS
a
Model 1 -0.004 (-0.015, 0.006) 0.384 aModel 1 0.048 (-0.101, 0.197) 0.528
bModel 2 -0.001 (-0.011, 0.010) 0.953 bModel 2 -0.008 (-0.158, 0.142) 0.919
WHR-GRS WHR-GRS
cModel 3 0.001 (-0.015, 0.017) 0.89 cModel 3 0.004 (-0.246, 0.255) 0.973 d
Model 4 0.001 (-0.015, 0.017) 0.873 dModel 4 0.032 (-0.215, 0.279) 0.8
BMI-GRS BMI-GRS
eModel 5 -0.001 (-0.015, 0.012) 0.87 eModel 5 -0.001 (-0.064, 0.061) 0.967 fModel 6 -0.001 (-0.012, 0.014) 0.878 fModel 6 0.016 (-0.044, 0.077) 0.598
Un-weighted genetic risk scores and weighted genetic risk scores for height, waist to hip ratio and body mass index were created as described in the methods section. These risk scores were then regressed against natural log-transformed prostate volume while adjusting for a number of covariates, including and excluding the anthropometric trait for which the genetic risk score was created.
aModel 1: Adjusted for Age, BMI, and 10 genetic ancestry principal components bModel 2: Adjusted for Age, BMI, Height and 10 genetic ancestry principal components c
Model 3: Adjusted for Age, Height and 10 genetic ancestry principal components
dModel 4: Adjusted for Age, Height, WHR and 10 genetic ancestry principal components e
Model 5: Adjusted for Age, Height and 10 genetic ancestry principal components
f
Model 6: Adjusted for Age, Height, WHR and 10 genetic ancestry principal components
While pseudo-genes lack coding potential due to the presence of various mutations such as
premature stop codons and frame shifts, unprocessed pseudo-genes like theLOC100131429
may be transcribed. The SNP rs11736129 is annotated by ENCODE to lie within an enhancer histone mark, and thus may be an expression quantitative trait locus [42]. As has been
demon-strated for theMYLKP1pseudo-gene and its functional counterpart, the expression of the
non-coding RNA of a pseudo-gene may inhibit the expression of the functional gene by decreasing its mRNA stability [43]. RNA expression analysis reports from Genecards show that the LOC100121429pseudo-gene and theARMC1gene are expressed in normal human prostate
tis-sues [44]. TheARMC1gene was associated with childhood obesity in a Hispanic population
[45], however the biological mechanisms relatingARMC1pseudo-gene and BPH are
specula-tive and require confirmation at this point. SLC7A11 is the closest protein-coding gene near rs11736129, which is approximately 250KB from the SNP. The gene product of SLC7A11 is a component of an anionic antiporter transport system which regulates cysteine and glutamine transport. This transport system, also known as the xCT antiporter system, has been proposed as a drug intervention target for cancers such as common triple-negative breast cancer [46], gli-oma [47] and pancreatic cancer [48].
Among loci for which evidence was suggestive, we found two polymorphisms in the NRXN3associated with PV.NRXN3gene product plays important role in cell adhesion, is expressed in the prostate tissue [49], and has been shown to be differentially overexpressed in an androgen dependent PC cell line compared with an androgen independent PC cell line [50].
Interestingly,NRXN3was significantly associated with waist-circumference in a large analysis
by the CHARGE consortium [51], with BMI by the GIANT consortium [39] and clinical mea-sures of overweight and obesity [52]. Similar evidence was observed at the SNP rs9583484 in
the intronic region of the Type IV collagenCOL4A2gene, a gene providing the major
struc-tural component of basement membranes.COL4A2is expressed in normal prostate tissues,
induced by androgens, and the C-terminal portion of theCOL4A2gene is thought to inhibit
angiogenesis [53].COL4A2has been suggested as a biomarker for screening BPH [54].
Pritch-ard and colleagues suggest that type IV collagen genes, includingCOL4A1andCOL4A2may
be over-expressed, andCOL3A1andCOL5A2expression may be repressed by androgen
expo-sure [53], suggesting an alternative pathway by which androgen activity may influence BPH
progression. Other loci of interest included a polymorphism in theRPL32P31pseudogene and
polymorphisms in the solute carrier family of genes (SLC12A7,SLC12A1) involved in the
transport of sodium and other inorganic compounds across the cell membrane and the sodium/potassium channel (SLC17A1).
As the first study to systematically evaluatea prioridetermined metabolic genetic variants
throughout the genome in relation to PV, our results are preliminary and need to be replicated by other independent studies before drawing any definitive conclusions. Assuming a minor allele
frequency of 0.10, a conservative p-value threshold of (5x10⁻⁷; assuming 100,000 independent
tests), and a sample size of 1300 participants (assuming both PC-free men and low-grade PC cases together), we had approximately 83% power to detect a beta-coefficient of 0.15. The effect estimates that we observed for the most part were less than 0.15, and we were likely
underpow-ered to detect these smaller associations. With the exception of SNP atLOC100131429that
reached genome-wide significance (p-value 1.16x10⁻⁸), the associations for all of the other SNPs
involved in the diagnosis of BPH, we acknowledge the study’s inability to draw associations between SNPs and BPH/LUTS severity. While we administered a standardized set of questions which assessed the International Prostate Symptom Score (I-PSS), this information was miss-ing on approximately 60% of the participants in this study. Although the I-PSS provides an assessment of the severity of BPH, it has been shown that scores are correlated with not just symptom severity but depends on many factors including patient awareness and
socioeco-nomic status [56–58]. With this in mind, the I-PSS may not be a strong candidate for testing
associations with germ line variations in the genome. Instead, we elected to evaluate the rela-tionship between SNPs and prostate volume, which is a reliably quantifiable component of BPH which is less prone to misclassification. Secondly, the pathology reports collected on the prostate tissues were limited to the assessment of prostate cancer rather than inflammation characteristics including infiltration of immune cells in the prostate. Therefore, we are not able to comment on the relationship between SNPs and inflammation in the prostate. Thirdly, our assessment of metabolic characteristics of the patients was limited to anthropometric assess-ments and diabetes status. A more detailed inventory of metabolic characteristics would have allowed for an analysis that adjusted for these characteristics. These metabolic characteristics would not be confounders in the association between SNPs and prostate volume but would rather most likely be in the causal pathway. With this regard, we were not able to test whether the associations observed are independent of these comorbidities; however this should not invalidate our current findings that SNPS previously associated with a range of metabolic traits also are associated with increasing PV.
Despite these caveats, our study has several strengths. The measurement of PV and acces-sion of covariates for all participants in the study were taken prior to prostate biopsy, therefore reducing the potential for information bias. We used PC-free men as our discovery sample and men with low-grade PC as our validation sample after first demonstrating that, aside from prostate volume, these two groups had similar body size and clinical characteristics. Obesity may have a separate association with advanced PC [59], and we therefore excluded men with high-grade PC hypothesizing that any association between genetic variability in men with high-grade PC would likely be a consequence of effects on PC rather than prostate size. In con-trast, men with low-grade PC are more like men without PC, with many diagnosed with inci-dental PC as a consequence of PSA testing. These low-grade PC patients have an excellent prognosis, with 5-year survivorship estimated at 100%. Consistent with our hypothesis, we showed that these two groups shared associations between risk factors for prostate enlargement such as age, height, BMI, WHR and statin use. Although the low-grade PC group had a
signifi-cant 6–8 ml smaller average prostate volume those men without PC, this difference is clinically
marginal toward BPH progression, and PSA levels were similar between groups. It is, however, likely that some portion an elevated PSA levels in this low-grade PC was a consequence of con-current PC as well as prostate enlargement. To address the potential heterogeneity between these groups, we conducted analyses separately on these two groups and then combined the results in a meta-analysis of the beta-coefficients. Results were generally consistent across groups, with low to moderate indication of heterogeneity.
Finally, we evaluated the compound genetic components of metabolism-related traits such as height, BMI and WHR in relation to prostate volume. Height, BMI, and WHR were posi-tively associated with prostate volume. However, our investigation of genetic risk scores for these anthropomorphic traits did not identify a shared genetic component between body size measures and prostate enlargement, suggesting that the association between obesity or height with prostate size is a consequence of endocrine factors or other non-genetic factors.
subsequent functional and mechanistic studies will be needed to further understand the genetic epidemiology of BPH.
Supporting Information
S1 Fig. QQ-PLOT: Meta-analysis for natural log transformed prostate volume beta-esti-mates among individuals with no prostate cancer and low-grade prostate cancer. Quantile-quantile plot for the meta-analysis p-values from fully adjusted model: adjusted for age, height,
BMI and 10 principal components; BMI = body mass index (kg/m2). Plot shows the expected
p-values under the uniform distribution versus the observed p-values from study. PC = Prostate Cancer.
(TIFF)
Author Contributions
Conceived and designed the experiments: JHF TLE. Analyzed the data: AG TLE JHF SHB SSM. Wrote the paper: AG TLE JHF SHB SSM. Data interpretation of article: AG TLE JHF SHB SSM. Critical revision of article for important intellectual content: AG TLE JHF SHB SSM.
References
1. Roehrborn CG. Male lower urinary tract symptoms (LUTS) and benign prostatic hyperplasia (BPH). Med Clin North Am. 2011; 95: 87–100. doi:10.1016/j.mcna.2010.08.013PMID:21095413
2. Wei JT, Calhoun E, Jacobsen SJ. Urologic diseases in America project: benign prostatic hyperplasia. J Urol. 2005; 173: 1256–61. doi:10.1097/01.ju.0000155709.37840.fePMID:15758764
3. Ozden C, Ozdal OL, Urgancioglu G, Koyuncu H, Gokkaya S, Memis A. The correlation between meta-bolic syndrome and prostatic growth in patients with benign prostatic hyperplasia. Eur Urol. 2007; 51: 199–203; discussion 204–6. doi:10.1016/j.eururo.2006.05.040PMID:16806666
4. Gupta A, Gupta S, Pavuk M, Roehrborn CG. Anthropometric and metabolic factors and risk of benign prostatic hyperplasia: a prospective cohort study of Air Force veterans. Urology. 2006; 68: 1198–205. doi:10.1016/j.urology.2006.09.034PMID:17169643
5. Parsons JK, Carter HB, Partin AW, Windham BG, Metter EJ, Ferrucci L, et al. Metabolic factors associ-ated with benign prostatic hyperplasia. J Clin Endocrinol Metab. Endocrine Society; 2006; 91: 2562–8. doi:10.1210/jc.2005-2799
6. Parsons JK, Sarma A V, McVary K, Wei JT. Obesity and benign prostatic hyperplasia: clinical connec-tions, emerging etiological paradigms and future directions. J Urol. 2009; 182: S27–31. doi:10.1016/j. juro.2009.07.086PMID:19846130
7. Parsons JK. Benign Prostatic Hyperplasia and Male Lower Urinary Tract Symptoms: Epidemiology and Risk Factors. Curr Bladder Dysfunct Rep. 2010; 5: 212–218. doi:10.1007/s11884-010-0067-2PMID: 21475707
8. Fowke JH, Motley SS, Cookson MS, Concepcion R, Chang SS, Wills ML, et al. The association between body size, prostate volume and prostate-specific antigen. Prostate Cancer Prostatic Dis. 2007; 10: 137–42. doi:10.1038/sj.pcan.4500924PMID:17179979
9. Joseph MA. Risk Factors for Lower Urinary Tract Symptoms in a Population-based Sample of African-American Men. Am J Epidemiol. 2003; 157: 906–914. doi:10.1093/aje/kwg051PMID:12746243 10. Seim A, Hoyo C, Ostbye T, Vatten L. The prevalence and correlates of urinary tract symptoms in
Nor-wegian men: the HUNT study. BJU Int. 2005; 96: 88–92. doi:10.1111/j.1464-410X.2005.05573.x PMID:15963127
11. Rohrmann S, Smit E, Giovannucci E, Platz EA. Associations of Obesity with Lower Urinary Tract Symp-toms and Noncancer Prostate Surgery in the Third National Health and Nutrition Examination Survey. Am J Epidemiol. 2004; 159: 390–397. doi:10.1093/aje/kwh060PMID:14769643
13. Dahle SE, Chokkalingam AP, Gao Y-T, Deng J, Stanczyk FZ, Hsing AW. Body Size And Serum Levels of Insulin and Leptin in Relation to the Risk of Benign Prostatic Hyperplasia. J Urol. 2002; 168: 599– 604. doi:10.1016/S0022-5347(05)64687-3PMID:12131317
14. Giovannucci E, Rimm EB, Chute CG, Kawachi I, Colditz GA, Stampfer MJ, et al. Obesity and Benign Prostatic Hyperplasia. Am J Epidemiol. 1994; 140: 989–1002. Available:http://aje.oxfordjournals.org/ content/140/11/989.shortPMID:7527182
15. Muller RL, Gerber L, Moreira DM, Andriole G, Hamilton RJ, Fleshner N, et al. Obesity is associated with increased prostate growth and attenuated prostate volume reduction by dutasteride. Eur Urol. 2013; 63: 1115–21. doi:10.1016/j.eururo.2013.02.038PMID:23541458
16. Parsons JK, Bergstrom J, Barrett-Connor E. Lipids, lipoproteins and the risk of benign prostatic hyper-plasia in community-dwelling men. BJU Int. 2008; 101: 313–8. doi:10.1111/j.1464-410X.2007.07332.x PMID:18005202
17. Sarma A V, Parsons JK, McVary K, Wei JT. Diabetes and benign prostatic hyperplasia/lower urinary tract symptoms—what do we know? J Urol. 2009; 182: S32–7. doi:10.1016/j.juro.2009.07.088PMID: 19846144
18. Parsons JK. Modifiable risk factors for benign prostatic hyperplasia and lower urinary tract symptoms: new approaches to old problems. J Urol. 2007; 178: 395–401. doi:10.1016/j.juro.2007.03.103PMID: 17561143
19. Nandeesha H, Koner BC, Dorairajan LN, Sen SK. Hyperinsulinemia and dyslipidemia in non-diabetic benign prostatic hyperplasia. Clin Chim Acta. 2006; 370: 89–93. doi:10.1016/j.cca.2006.01.019PMID: 16516184
20. Nickel JC. Inflammation and benign prostatic hyperplasia. Urol Clin North Am. 2008; 35: 109–15; vii. doi:10.1016/j.ucl.2007.09.012PMID:18061029
21. Rohrmann S, De Marzo AM, Smit E, Giovannucci E, Platz EA. Serum C-reactive protein concentration and lower urinary tract symptoms in older men in the Third National Health and Nutrition Examination Survey (NHANES III). Prostate. 2005; 62: 27–33. doi:10.1002/pros.20110PMID:15389816 22. St Sauver JL, Sarma A V, Jacobson DJ, McGree ME, Lieber MM, Girman CJ, et al. Associations
between C-reactive protein and benign prostatic hyperplasia/lower urinary tract symptom outcomes in a population-based cohort. Am J Epidemiol. 2009; 169: 1281–90. doi:10.1093/aje/kwp085PMID: 19395697
23. Di Silverio F, Gentile V, De Matteis A, Mariotti G, Giuseppe V, Antonio Luigi P, et al. Distribution of Inflammation, Pre-Malignant Lesions, Incidental Carcinoma in Histologically Confirmed Benign Pros-tatic Hyperplasia: A Retrospective Analysis. Eur Urol. 2003; 43: 164–175. doi:10.1016/S0302-2838 (02)00548-1PMID:12565775
24. Schenk JM, Kristal AR, Neuhouser ML, Tangen CM, White E, Lin DW, et al. Biomarkers of systemic inflammation and risk of incident, symptomatic benign prostatic hyperplasia: results from the prostate cancer prevention trial. Am J Epidemiol. 2010; 171: 571–82. doi:10.1093/aje/kwp406PMID:20142396 25. Parsons JK, Im R. Alcohol consumption is associated with a decreased risk of benign prostatic
hyper-plasia. J Urol. 2009; 182: 1463–8. doi:10.1016/j.juro.2009.06.038PMID:19683313
26. Parsons JK, Kashefi C. Physical activity, benign prostatic hyperplasia, and lower urinary tract symp-toms. Eur Urol. 2008; 53: 1228–35. doi:10.1016/j.eururo.2008.02.019PMID:18358592
27. Martin AW, Page WE, Lee BR, Sanda MG, Miller RN, Walsh PC. Concordance rates for benign pros-tatic disease among twins suggest hereditary influence. Urology. 1994; 44: 646–650. doi:10.1016/ S0090-4295(94)80197-5PMID:7526523
28. Salam MT, Ursin G, Skinner EC, Dessissa T, Reichardt JK V. Associations between polymorphisms in the steroid 5-alpha reductase type II (SRD5A2) gene and benign prostatic hyperplasia and prostate cancer. Urol Oncol. 2005; 23: 246–53. doi:10.1016/j.urolonc.2004.12.014PMID:16018939
29. Roberts RO, Bergstralh EJ, Farmer SA, Jacobson DJ, McGree ME, Hebbring SJ, et al. Polymorphisms in the 5alpha reductase type 2 gene and urologic measures of BPH. Prostate. 2005; 62: 380–7. doi:10. 1002/pros.20142PMID:15389785
30. Kristal AR, Price DK, Till C, Schenk JM, Neuhouser ML, Ockers S, et al. Androgen receptor CAG repeat length is not associated with the risk of incident symptomatic benign prostatic hyperplasia: results from the Prostate Cancer Prevention Trial. Prostate. 2010; 70: 584–90. doi:10.1002/pros.21092PMID: 19938041
32. Qi J, Tian L, Chen Z, Wang L, Tao S, Gu X, et al. Genetic variants in 2q31 and 5p15 are associated with aggressive benign prostatic hyperplasia in a Chinese population. Prostate. 2013; 73: 1182–90. doi:10. 1002/pros.22666PMID:23620269
33. Voight BF, Kang HM, Ding J, Palmer CD, Sidore C, Chines PS, et al. The metabochip, a custom geno-typing array for genetic studies of metabolic, cardiovascular, and anthropometric traits. PLoS Genet. 2012; 8: e1002793. doi:10.1371/journal.pgen.1002793PMID:22876189
34. Roehrborn CG. The utility of serum prostatic-specific antigen in the management of men with benign prostatic hyperplasia. Int J Impot Res. 2008; 20 Suppl 3: S19–26. doi:10.1038/ijir.2008.53PMID: 19002120
35. Stamey TA, Ekman PE, Blankenstein MA, Cooper EH, Kontturi M, Lilja H, et al. Tumor markers. Con-sensus Conference on Diagnosis and Prognostic Parameters in Localized Prostate Cancer. Stock-holm, Sweden, May 12–13, 1993. Scand J Urol Nephrol Suppl. 1994; 162: 73–87; discussion 115–27. Available:http://www.ncbi.nlm.nih.gov/pubmed/7529430PMID:7529430
36. Purcell S, Neale B, Todd-Brown K, Thomas L, Ferreira MAR, Bender D, et al. PLINK: a tool set for whole-genome association and population-based linkage analyses. Am J Hum Genet. 2007; 81: 559– 75. doi:10.1086/519795PMID:17701901
37. Edwards TL, Giri A, Motley S, Duong W, Fowke JH. Pleiotropy between genetic markers of obesity and risk of prostate cancer. Cancer Epidemiol Biomarkers Prev. 2013; 22: 1538–46. doi: 10.1158/1055-9965.EPI-13-0123PMID:23810916
38. Gao X, Starmer J, Martin ER. A multiple testing correction method for genetic association studies using correlated single nucleotide polymorphisms. Genet Epidemiol. 2008; 32: 361–9. doi:10.1002/gepi. 20310PMID:18271029
39. Speliotes EK, Willer CJ, Berndt SI, Monda KL, Thorleifsson G, Jackson AU, et al. Association analyses of 249,796 individuals reveal 18 new loci associated with body mass index. Nat Genet. 2010; 42: 937– 48. doi:10.1038/ng.686PMID:20935630
40. Heid IM, Jackson AU, Randall JC, Winkler TW, Qi L, Steinthorsdottir V, et al. Meta-analysis identifies 13 new loci associated with waist-hip ratio and reveals sexual dimorphism in the genetic basis of fat dis-tribution. Nat Genet. Nature Publishing Group, a division of Macmillan Publishers Limited. All Rights Reserved.; 2010; 42: 949–60. doi:10.1038/ng.685PMID:20935629
41. Lango Allen H, Estrada K, Lettre G, Berndt SI, Weedon MN, Rivadeneira F, et al. Hundreds of variants clustered in genomic loci and biological pathways affect human height. Nature. Nature Publishing Group; 2010; 467: 832–8. doi:10.1038/nature09410PMID:20881960
42. Ward LD, Kellis M. HaploReg: a resource for exploring chromatin states, conservation, and regulatory motif alterations within sets of genetically linked variants. Nucleic Acids Res. 2012; 40: D930–4. doi: 10.1093/nar/gkr917PMID:22064851
43. Pei B, Sisu C, Frankish A, Howald C, Habegger L, Mu XJ, et al. The GENCODE pseudogene resource. Genome Biol. 2012; 13: R51. doi:10.1186/gb-2012-13-9-r51PMID:22951037
44. Rebhan M, Chalifa-Caspi V, Prilusky J, Lancet D. GeneCards: a novel functional genomics compen-dium with automated data mining and query reformulation support. Bioinformatics. 1998; 14: 656–664. doi:10.1093/bioinformatics/14.8.656PMID:9789091
45. Comuzzie AG, Cole SA, Laston SL, Voruganti VS, Haack K, Gibbs RA, et al. Novel genetic loci identi-fied for the pathophysiology of childhood obesity in the Hispanic population. PLoS One. Public Library of Science; 2012; 7: e51954. doi:10.1371/journal.pone.0051954
46. Timmerman LA, Holton T, Yuneva M, Louie RJ, Padró M, Daemen A, et al. Glutamine sensitivity analy-sis identifies the xCT antiporter as a common triple-negative breast tumor therapeutic target. Cancer Cell. 2013; 24: 450–65. doi:10.1016/j.ccr.2013.08.020PMID:24094812
47. Pham A-N, Blower PE, Alvarado O, Ravula R, Gout PW, Huang Y. Pharmacogenomic approach reveals a role for the x(c)- cystine/glutamate antiporter in growth and celastrol resistance of glioma cell lines. J Pharmacol Exp Ther. 2010; 332: 949–58. doi:10.1124/jpet.109.162248PMID:20007406 48. Lo M, Ling V, Wang YZ, Gout PW. The xc- cystine/glutamate antiporter: a mediator of pancreatic cancer
growth with a role in drug resistance. Br J Cancer. 2008; 99: 464–72. doi:10.1038/sj.bjc.6604485 PMID:18648370
49. Chambers KF, Pearson JF, Pellacani D, Aziz N, GužvićM, Klein CA, et al. Stromal upregulation of lat-eral epithelial adhesions: gene expression analysis of signalling pathways in prostate epithelium. J Biomed Sci. 2011; 18: 45. doi:10.1186/1423-0127-18-45PMID:21696611
51. Heard-Costa NL, Zillikens MC, Monda KL, JohanssonÅ, Harris TB, Fu M, et al. NRXN3 is a novel locus
for waist circumference: a genome-wide association study from the CHARGE Consortium. PLoS Genet. Public Library of Science; 2009; 5: e1000539.
52. Berndt SI, Gustafsson S, Mägi R, Ganna A, Wheeler E, Feitosa MF, et al. Genome-wide meta-analysis identifies 11 new loci for anthropometric traits and provides insights into genetic architecture. Nat Genet. 2013; 45: 501–12. doi:10.1038/ng.2606PMID:23563607
53. Pritchard CC, Nelson PS. Gene expression profiling in the developing prostate. Differentiation. 2008; 76: 624–40. doi:10.1111/j.1432-0436.2008.00274.xPMID:18462436
54. Guyon I. Biomarkers for screening, predicting, and monitoring prostate disease. U.S. Patent Applica-tion; 11/214,931, 2005.
55. Kaplan SA, Te AE, Pressler LB, Olsson CA. Transition Zone Index as a Method of Assessing Benign Prostatic Hyperplasia: Correlation with Symptoms, Urine Flow and Detrusor Pressure. J Urol. 1995; 154: 1764–1769. doi:10.1016/S0022-5347(01)66779-XPMID:7563342
56. Fowke JH, Munro H, Signorello LB, Blot WJ, Penson DF. Association between socioeconomic status (SES) and lower urinary tract symptom (LUTS) severity among black and white men. J Gen Intern Med. 2011; 26: 1305–10. doi:10.1007/s11606-011-1776-8PMID:21720905
57. Platz EA, Kawachi I, Rimm EB, Willett WC, Giovannucci E. Race, ethnicity and benign prostatic hyper-plasia in the health professionals follow-up study. J Urol. 2000; 163: 490–5. Available:http://www.ncbi. nlm.nih.gov/pubmed/10647663PMID:10647663
58. Sarma A V, Wei JT, Jacobson DJ, Dunn RL, Roberts RO, Girman CJ, et al. Comparison of lower urinary tract symptom severity and associated bother between community-dwelling black and white men: the Olmsted County Study of Urinary Symptoms and Health Status and the Flint Men’s Health Study. Urol-ogy. 2003; 61: 1086–91. Available:http://www.ncbi.nlm.nih.gov/pubmed/12809866PMID:12809866 59. Fowke JH, Motley SS, Concepcion RS, Penson DF, Barocas DA. Obesity, body composition, and