PRELIMINARY INDIVIDUAL TREE GROWTH MODEL, SITE INDEX MODEL «MORTALITY» MODEL FOR ALEPPO PINE (Pinus halepensis MILL.) IN CHALKIDIKI
(NORTHERN GREECE)
MODELO INDIVIDUAL PRELIMINAR DE CRESCIMENTO DE ÁRVORE, MODELO DE ÍNDICE DE LOCAL E MODELO DE “MORTALIDADE” PARA PINHEIRO-DE-ALEPPO
(Pinus halepensis Mill.) EM CHALKIDIKI (GRÉCIA DO NORTE)
Kyriaki Kitikidou1 Argyro Papageorgiou2 Elias Milios3 Athanasios Stampoulidis4
ABSTRACT
Preliminary height models, a volume model, a site index model and a survival analysis for Pinus halepensis Mill. in Chalkidiki (Northern Greece) were preliminarily developed based on measurements of 20 experimental plots established in 2010. The data for the height, volume and ‘mortality’ models consisted of 790 observations taken from 40 trees (20 dominant and 20 co-dominant). An equation derived from the hyperbolic function was selected to model the dominant height and the volume development. The height growth model was used as a guide curve to develop two site index curves. Mean dominant and codominant height was estimated at 10m (site I) and 7m (site II) (base age of 17 years). Kaplan-Meier survival and
hazard functions applied for the ‘mortality’ analysis, confirmed the site index curves developed from the
height model (SI10 and SI7).
Keywords: tree modelling; survival analysis.
RESUMO
Modelos preliminares de altura, modelo de volume, modelo de índice de sítio e análise de “sobrevivência” para Pinus halepensis Mill., em Chalkidiki (Norte da Grécia ) foram preliminarmente desenvolvidos baseados em medidas de 20 parcelas experimentais estabelecidas em 2010. Os dados para altura, volume e modelos de «mortalidade» consistiram em 790 observações obtidas de 40 árvores (20 dominantes e 20 codominantes). Uma equação derivada da função hiperbólica foi selecionada para modelar altura dominante e volume de desenvolvimento. O modelo de crescimento em altura foi usado como uma curva-guia para desenvolver duas curvas de índice de sítio. A altura média dominante e codominante foi estimada em 10 m (Local I) e 7 m (Local II) (idade-base de 17 anos). A sobrevivência de Kaplan-Meier e as funções de risco
aplicadas para a análise de “sobrevivência”, confirmaram as curvas de índice de sítio desenvolvidas pelo modelo de altura (SI10 e SI7).
Palavras-chave: modelagem em árvore; análise de sobrevivência.
1 Forester, Assistant Professor, Department of Forestry and Management of the Environment and Natural Resources, Democritus University of Thrace, Pantazidou 193, Postal Code 68200, Orestiada (Evros), Greece. [email protected]
2 Forester, MSc in Forestry, Department of Forestry and Management of the Environment and Natural Resources, Democritus University of Thrace, Pantazidou 193, Postal Code 68200, Orestiada (Evros), Greece. [email protected]
3 Forester, Associate Professor, Department of Forestry and Management of the Environment and Natural Resources, Democritus University of Thrace, Pantazidou 193, Postal Code 68200, Orestiada (Evros), Greece. [email protected]
4 Forester, PhD candidate, Department of Forestry and Management of the Environment and Natural Resources, Democritus University of Thrace, Pantazidou 193, Postal Code 68200, Orestiada (Evros), Greece. [email protected]
INTRODUCTION
Aleppo pine (Pinus halepensis Mill.) is a common forest species of the western Mediterranean;
we find it in Spain, France, Italy, Croatia, Albania,
Greece, Morocco, Algeria, Tunisia, Libya and Malta, and a few populations in the eastern Mediterranean (Turkey, Syria, Israel, Jordan and Lebanon). Its total forest cover is estimated at 3.5 million hectares (CRITCHFIELD; LITTLE, 1996).
Aleppo pine constitutes the main source of wood and forest cover in many Mediterranean countries. Mean productivity is estimated at 1–2 m3/ha/year and maximum yield can reach 12–15 m3. The wood is used in construction, industry,
carpentry, firewood and pulp, while seeds are used
for making pastry (MUENCHOW, 1986).
As regards the species relation to nutrient recycling, litter production enriches the soil with nutrient input (BRAY; GORHAM, 1964, RODIN; BAZILEVICH, 1967). In ecosystems where there is a lack of available nutrients in the soil, as in the Mediterranean ecosystems, both litter production and decomposition turn out to be essential for nutrient recycling (ARIANOUTSOU, 1989; HARCOMBE, 1987). Arianoutsou and Radea
(2000) estimate that Aleppo pine species offers a significant amount of energy annually, based on
the fact that approximately 0.17 kgm/m2 of litter, analogous to 816 Kcal (1 Kg litter equals 4800 Kcal (MCFADYEN, 1971)) is produced annually by Aleppo pines, and the litter of the understorey shrubs add about 773 Kcal of energy to the subsoil. Removal of needles and thin branches frequently,
although it reduces the possibility of fire, is not recommended, given that forest floor represents
up to 50% of the total biomass and contains a great number of nutrients (ALIFRAGIS et al., 2001; SMIRIS et al., 2000). As expected, biomass production depends on the site; in good quality sites more biomass is found (SMIRIS et al., 1998); consequently, more energy is restored. Thus, the development of site index models is essential from an energy point of view.
SSeveral studies aiming at investigating Aleppo pine have been conducted (DASKALAKOU; THANOS, 2004; GOUDELIS et al., 2007; HERRANZ et al., 1997; MARTINEZ-SANCHEZ et al., 1999; PAPAGEORGIOU, 2011; PAUSAS et al., 2003; PAUSAS et al., 2004; THANOS; DASKALAKOU, 2000; THANOS et al., 1996; TSITSONI, 1997; VERROIOS; GEORGIADIS,
2002). Growth models can be classified as
stand-level models or tree-stand-level models, depending on the measurements provided (VANCLAY, 1994). When we have individual tree measurements and we develop tree-level models, these models give a more detailed description of the stand structure and its dynamics than stand-level models (MABVURIRA; MIINA, 2001). There are many tree-level models developed (among others, ALDER, 1979; CAO, 2000; KITIKIDOU et al., 2011; KITIKIDOU et al., 2012; KITIKIDOU et al., 2011; MABVURIRA; MIINA, 2001; PALAHÍ et al., 2004; PUKKALA, 1988; 1989; RAUTIAINEN, 1999; SCHRÖDER et al., 2001; SHAFII et al., 1990; TENNENT, 1982; VANCLAY, 1991; ZHANG et al., 1997). The development of individual tree-level growth models for Aleppo pine would help in applying forest management in forest-level planning (PALAHÍ; GRAU, 2003).
The aim of this study was to develop a preliminarily model set from measurements on young Aleppo pine trees in Chalkikidi (Northern Greece). The model set includes a height model, a volume model, a site index model, and a ‘mortality’ probability model. Moreover, the sampled trees
classification from the site index model is compared to classification based on soil depth.
MATERIAL AND METHODS
Data
The data were measured in 20 experimental plots established in 2010, in an area where a forest
fire took place in spring of 1990, in Peninsula of
Kassandra in Chalkidiki (Northern Greece). In particular, the plots were established in areas where the cover by the tree canopy projection is over 80%. In these areas the soil depth was measured in soil
profiles in order to classify sites (PAPAGEORGIOU, 2011). Two sites were determined: site A where the soil depth was 50 to 55+ cm (approximately 55
cm, only in one profile the soil depth was 57 cm)
and site B where the soil depth was 35 to 40 cm (PAPAGEORGIOU, 2011). In each Site 10 plots of 25 m² (5m x 5m) were established using the simple random sampling method. Site A represents the productive sites, while Site B represents the medium productivity sites (PAPAGEORGIOU,
2011). The soil depth was used for the classification
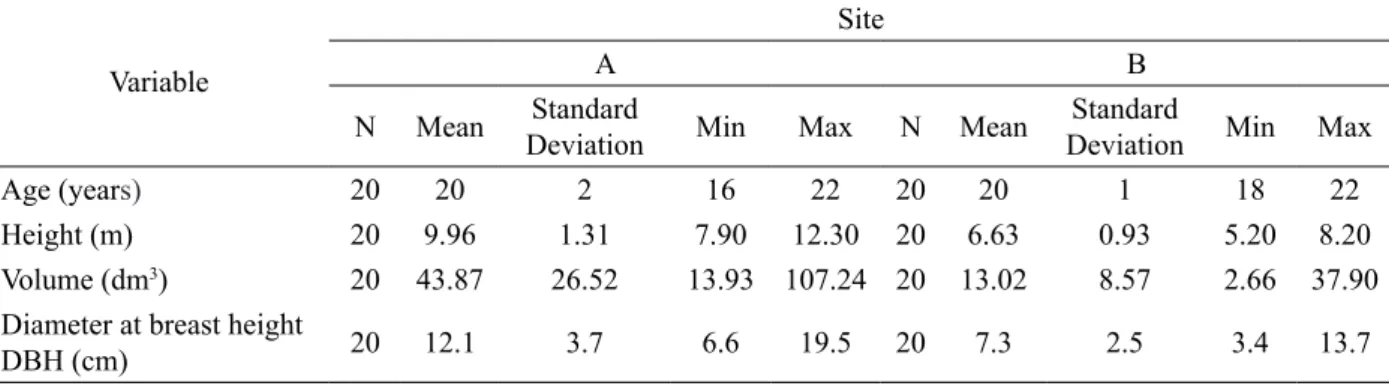
depth of soil is strongly related to site productivity (DAFIS, 1986; HATZISTATHIS; DAFIS, 1989). The geological substratum in the area where the plots were established is sedimentary white marls, while the soil in the Aleppo pine stands of Kassandra Peninsula is sandy to sandy-loam (KLONARIS, 1990). In the nearest meteorological station the annual rainfall is 602.5 mm and the mean yearly temperature is 16.1 oC (KLONARIS, 1990). During summer (June, July and August) the 9.5 % of the annual rainfall has fallen in the area (data from KLONARIS, 1990). One dominant and one codominant tree were cut from each plot in the winter of 2010 -2011. Sampled trees summary statistics are given in Table 1.
The max age of trees is 22 years, since some
trees survived the forest fire as 1-year old seedlings.
The stands were naturally regenerated with no thinning treatments. From each sampled tree, cross-sectional discs were cut and removed from various heights. In each cross-sectional disc the number and the width of annual growth rings were counted with the LINTAB system of RinnTech and the program TSAP-Win (RINN, 2003). A stem analysis was conducted in each tree. Annual heights were
calculated using the modified algorithm of Carmean
(CARMEAN, 1972; NEWBERRY, 1991), while volumes were calculated using XLSTEM formulas of Regent Instruments (FORTIN; LABRANCHE, 1996). Stem analysis resulted in 796 age/height/ volume observations.
Height and volume model
After several testings in the estimation data, we ended up in a hyperbolic function of the form:
1 0
b Y=b X
which was found to be appropriate for both height and volume models.
To determine the accuracy of model predictions, bias and precision of the models were calculated (GADOW; HUI, 1998; SOARES et al., 1995; VANCLAY, 1994). Absolute and relative biases and root mean square error (RMSE) were calculated as follows:
where n is the number of observations; and yi and
y
ˆ
i are observed and predicted values,respectively.
Site index model
Among various techniques for developing site index curves, the guide curve method is considered appropriate where the re-measurements of the permanent plot data for forest stands are lacking (CARMEAN, 1972; MCFADYEN, 1971); therefore, this method was used in the present study. Considering the age of culmination of mean annual increment, as recommended by various researchers (CURTIS et al., 1974; THESHOME;
TABLE 1:Summary statistics of the sampled trees. TABELA 1: Estatísticas descritivas das árvores analisadas.
Variable
Site
A B
N Mean Standard
Deviation Min Max N Mean
Standard
Deviation Min Max
Age (years) 20 20 2 16 22 20 20 1 18 22
Height (m) 20 9.96 1.31 7.90 12.30 20 6.63 0.93 5.20 8.20
Volume (dm3) 20 43.87 26.52 13.93 107.24 20 13.02 8.57 2.66 37.90
Diameter at breast height
PETTY, 2000, TROUSDELL et al., 1974), 17 years was adopted as the appropriate base age for the determination of site index of Aleppo pine.
2.4. «Mortality» model
Kaplan–Meier survival and hazard functions are used to quantify the «mortality»’s probability distribution in a population (MARTINEZ-SANCHEZ et al., 1999). Survival function is
defined as (BERKSON; GAGE, 1950; COLLETT,
1994; COX; OAKES, 1984):
S t( )=P T( >t)
where S(t) is the probability for the sample unit to die in a time T later than t. The random variable Τ, which counts time till death, doesn’t have any restriction besides being greater than zero.
Hazard function expresses instantaneous «mortality», therefore is a conditional probability
defined as (COLLETT, 1994; COX; OAKES,
1984):
0
( )
( ) lim t
P t T t t T t
h t
t ∆ →
≤ ≤ + ∆ ≥ =
∆
where h(t) is the probability for the sample unit to die exactly at time t, given that death didn’t occur before t. We can note that hazard function derives from survival function.
Hypothesis H0, that survival functions are homogeneous for two groups can be tested by applying the nonparametric logrank test (LANDAU; EVERITT, 2004):
(
)
1 r
L j j
j
U d e
=
=
∑
−where UL is the sum of the differences between the number of observed deaths d and the number of expected deaths e at times r, if there is at least one death. Squaring and dividing UL by the estimated variance we calculate the logranks’
test chi-square. With stratified logrank test, the
UL function is calculated per factor, and we can examine if there are variables related to survival. In this work, we used site quality (sites I and II) as factor.
As we can see in mathematical formulas used in survival analysis, the time that an event takes place is crucial. Therefore, the main obstacle
as regards the application of the method in forest inventories is the lack of age measurements and the exact time of the tree death (FLEWELLING; MONSERUD, 2002). The knowledge of age, however, is not necessary in order to apply survival analysis. Any kind of measurement showing changes in the tree status as time passes, can replace traditional age measurements (HARCOMBE, 1987; KITIKIDOU; APOSTOLOPOULOU, 2011; KITIKIDOU; MATIS, 2011; WOODALL; GRAMBSCH; THOMAS, 2005). In the present study, we used height measurements, as they were calculated from stem analyses, instead of survival measurements, and the tree social status (dominant-codominant) as the status variable, running SURVIVAL from the SPSS statistical package (LANDAU; EVERITT, 2004). Site types (I, II) were used as factor.
RESULTS
Height and volume model
Fitting height and volume equations to data gave the following results:
h=0.2263t1.3386 (1) v=0.0003t4.0721 (2)
where h is the tree height (m) and t is the tree age and v is the tree volume (dm3). Fitting statistics for both models are presented in Table 2, while independent-dependent variable graphs are given in Figures 1 and 2, respectively.
Site index model
The anamorphic form of the hyperbolic equation was selected to model height growth of Aleppo pine stands. The function is as follows:
1
1.3386 1
2 1.3386 2
H
H
T
T
=
(3)
From the 10 dominant trees that were
cut from plots of the site A (true classification, using soil depth) 6 were classified in Site I (good)
and 4 in Site II (medium). On the other hand, all the dominant trees that were cut in site B (true
classification, using soil depth) were classified in Site II (medium) (Table 3). Classification in Sites I
and II was accurately estimated, using formula (3),
where H2 is the height of the sampled tree at the age of 17 years, T2 equals to 17, and H1 is the height of the sampled tree at age T1.
Mortality model
Survival estimates for each site type are given in Table 4.
Survival and hazard functions were estimated separately for each site type (Figures 4 and 5). We can see clearly that in the good quality site we have a greater probability of occurring a tall tree, (Figure 4), while the risk of occurring a short tree, is greater in the medium quality site
(Figure 5). Survival analysis confirmed the
site index curves developed from the height model, with mean heights of dominant and co-dominant trees at 10m for the good site (I) and 7m for the medium site (II), respectively.
Log rank test for checking the factors’ influence
at height increment was found to be statistically
significant (Table 5).
TABLE 2: Absolute and relative biases and RMSEs of the height and volume growth models. TABELA 2: Desvios absolutos e relativos e RQMEs da altura e modelos de crescimento de volume.
Criteria Height growth model Volume growth model
Bias -2.43 -31.56
Bias% -22.66% -52.60%
RMSE 3.16 42.31
RMSE% 9.31% 29.83%
0 2 4 6 8 10 12 14
0 5 10 15 20 25
Age (years)
H
e
ig
h
t
(m
)
FIGURE 1: Height-age graph of sampled trees.
FIGURA 1: Gráfico altura-idade das árvores
amostradas.
0 20 40 60 80 100 120
0 5 10 15 20 25
Age (years)
V
ol
um
e
(
dm
3
)
FIGURE 2: Volume-age graph of sampled trees.
FIGURA 2: Gráfico de volume-idade das árvores
amostradas.
0 2 4 6 8 10 12 14 16
0 5 10 15 20 25
Age (years)
H
e
ig
h
t
(m
)
observed SI10 SI7 guide curve
FIGURE 3: Site index curves for Aleppo pine stands.
DISCUSSION
This study presents preliminary individual-tree models for P. halepensis stands in Chalkidiki (northern Greece), based on 20 temporary sample plots. Due to the small amount of data, and especially the young ages of the trees, the models
must be regarded as preliminary and they should not be used beyond the range of the tree characteristics presented in the modelling data.
There are no great differences among the classification of dominant trees (and plots) in different sites using soil depth and the developed
site index model. However, the usage of the FIGURE 4: Kaplan-Meier survival functions for the
two site types.
FIGURA 4: Funções de sobrevivência de Kaplan-Meier para os dois tipos de locais.
FIGURE 5: Hazard functions for the two site types. FIGURA 5: Funções de risco para os dois tipos de
local.
TABLE 3: Sampled tree classification from the site index model compared to the classification based on soil depth.
TABELA 3: Classificação das árvores amostradas pelo modelo de índice de sítio comparada com a classificação baseada em profundidade do solo.
Site Tree status No of classified trees Incorrect percentage
Age range of incorrectly
classified trees (years)
True Predicted
I Dominant 10 6 40,00% 21-22
Codominant 10 2 80,00% 19-22
II Dominant 10 10 0,00%
-Codominant 10 10 0,00%
-TABLE 4: Mean heights estimated from the «mortality» model. TABELA 4: Alturas médias estimadas pelo modelo de «mortalidade».
Site Mean Std. Error 95% Confidence Interval
Lower Bound Upper Bound
I (good) 10,597 0,398 9,817 11,376
II (medium) 7,033 0,278 6,488 7,578
site index model leads to a more conservative
classification, since more of the sampled dominant
trees (and consequently the corresponding plots)
were classified in medium sides (Table 3). A reason for this classification difference is probably the young age of trees; classification errors tend to
be very large at young ages (NIGH; MARTIN, 2001). Another possible reason is the fact that both dominant and co-dominant trees were used in the development of the site index model. The use of dominant and co-dominant trees, instead of only dominant trees, reduces considerably the accuracy of site index determination (KER, 1952). Apart the abovementioned discussion, the productivity
classification of sites using soil depth can not be
rejected for another reason too, all the dominant trees of site A (based on the site productivity
classification using soil depth) had higher height
than that of all dominant trees of site B at the age of 17 years (measurements from original data). Even one dominant tree of Site As it was 16 years old, at the time of cut, was taller than all the dominant trees of site B at the age of 17 years. Soil depth, direct or indirect, alone or in combination with other parameters, has been used for site productivity (quality) determination in many research papers in Greece (MILIOS, 2004; ADAMOPOULOS et al., 2009; PAPALEXANDRIS; MILIOS, 2010; STAMBOULIDIS; MILIOS, 2010; MILIOS et al., 2012; ADAMOPOULOS; WIMMER; MILIOS, 2012; STAMPOULIDIS; MILIOS; KITIKIDOU, 2013). In the case of Adamopoulos et al. (2009), the
site quality was also verified using site index curves. Due to little data, it is difficult to discuss and
compare the results presented to others previously
developed. However, the adequate classification of
the sampled trees in the two estimated site types
using the developed site index curves - confirmed
in our study by the «mortality» model - could allow us to risk an estimation of past tree growth (TRASOBARES; TOMÉ; JARI MIINA, 2004). In Thanos, Daskalakou, and Nikolaidou (1996), a tree height is estimated to be up to 0.72m at 3 years of age, while in our study is estimated to be 1m on average.
In Tsitsoni (1997), a tree height is estimated to be 0.3m at 1 year of age, while in our study is estimated to be 0.33m in the good site. Finally, in Pausas et al. (2003), a tree height is estimated to be 0.24m at 2.5 years of age, while in our study is estimated to be 0.77m on average. Comparing studies with tree ages within or close to our age interval, we found that in Ares and Peinemann (1992) estimated mean heights at 20 years is 15.7m (good site) and 13.4m (medium site), while in our study they are estimated at 13.1m and 8.6m, respectively.
Another point that we should discuss is the advantages of the «mortality» methodology used in this study, where height was the independent
variable. A variable can be defined as longitudinal
if it can measure transition from one state to another (COLLETT, 1994). The greatest difficulty in survival analysis application in forest inventories
is to find appropriate longitudinal variables to
quantify survival and «mortality» risk (ZENS; PEART, 2003). When using passage time or age as longitudinal variables, several problems can arise (BURGMAN et al., 1994; HARCOMBE, 1987; PREISLER; SLAUGHTER, 1997; VOLNEY, 1998). Firstly, most observations are censored, meaning that the exact time of death of a tree is uncertain. Secondly, the survival function depends on when and where measurements are taking place. The survival estimation can be biased, if
inventory takes place in a specific area with many dead trees. Thirdly, it is difficult to estimate stand
age in forest inventories of large scale. Therefore, a «mortality» model from a survival analysis using time-dependent variables can be useful in showing the trend of a growth variable, such as tree height.
CONCLUSIONS
A set including a height model, a volume model, a site index model and a «mortality» model for Pinus halepensis Mill. in Chalkidiki (Northern Greece) were preliminarily developed based on measurements of 20 experimental plots established in 2010. Based on the results, mean dominant and TABLE 5: Log rank test for height distributions’ homogeneity in the factor levels (sites).
TABELA 5: Teste de Log-rank para a homogeneidade de distribuição de altura nos níveis de fator (locais).
Factor χ2 Degrees of freedom p-value
co-dominant height was estimated at 10m (site I) and 7m (site II) (base age of 17 years). Kaplan-Meier survival and hazard functions applied for
the «mortality» analysis, confirmed the site index
curves developed from the height model (SI10 and SI7).
ACKNOWLEDGEMENTS
We would like to thank Kassandra Forestry Service for their cooperation and Bodossaki
Foundation for the financial support of the 4th
author, Mr. Stampoulidis.
REFERENCES
ADAMOPOULOS, S. et al. Ring width, latewood proportion and dry density in stems of Pinus brutia Ten. European Journal of Wood and Wood
Products, New York, v. 67, p. 471-477, 2009.
ADAMOPOULOS, S.; WIMMER, R.; MILIOS, E. Tracheid length – growth relationships of young Pinus brutia Ten. grown on reforestation sites.
IAWA Journal, Raleigh, v. 33, n. 1, p. 39-49, 2012.
ALDER, D. A distance-independent tree model for exotic conifer plantations in East Africa. Forest
Science, Maryland, v. 25, p. 59-71, 1979.
ALIFRAGIS, D. et al. The effect of stand age on the accumulation of nutrients in the aboveground components of an Aleppo pine ecosystem. Forest
Ecology and Management, Amsterdam, v. 141,
p. 259-269, 2001.
ARES, A.; PEINEMANN, N. Provisional site quality evaluation for coniferous plantations in Sierra de la Ventana, Argentina. Forest Ecology
and Management, Amsterdam, v. 54, p. 89-94,
1992.
ARIANOUTSOU, M. Timing of litter production in a maquis ecosystem of North-Eastern Greece.
Acta Oecologia-Oecologia Plantarum, France,
v. 10, p. 1-8, 1989.
ARIANOUTSOU, M.; RADEA, C. Litter production and decomposition in Pinus halepensis forests. In: Ne’eman, G.; Tvabaud, L. (Eds.).
Ecology, Biogeography and Management of Pinus
halepensis and P. brutia Forest Ecosystems in the
Mediterranean Basin, Leiden. The Netherlands:
Backhuys Publishers, 2000, p. 183-190.
BERKSON, J.; GAGE, R. Calculation of survival rates of cancer. In: PROCEEDINGS OF STAFF MEETINGS OF THE MAYO CLINIC, 1950, USA.
Proceedings… 1950. p. 270-286.
BRAY, J.; GORHAM, E. Litter production in forests of the world. Advances in Ecological
Research, Amsterdam, v. 2, p. 101-157, 1964.
BURGMAN, M. et al. Mortality models for mountain and alpine ash. Forest Ecology and
Management, Amsterdam, v. 67, p. 319-327, 1994.
CAO, Q. Prediction of annual diameter growth and survival for individual trees from periodic measurements. Forest Science, Maryland, v. 46, n. 1, p. 127-131, 2000.
CARMEAN, W. Site index curves for upland oaks in the Central States. Forest Science, Maryland, v. 18, n. 2, p. 109-120, 1972.
COLLETT, D. Modelling Survival Data in
Medical Research. New York: Chapman and Hall/
CRC, 1994, 395 p.
COX, D.; OAKES, D. Analysis of Survival Data. London: Chapman and Hall, 1984. 201 p.
CRITCHFIELD, W.; LITTLE, E. Geographic
Distribution of the Pines of the World. [s. l.]:
U.S. Department of Agriculture, Forest Service, Miscellaneous Publication, 1996. 97 p.
CURTIS, R.; DEMARS, D.; HERMAN, F. Which dependent variable in site index height-age regression? Forest Science, Maryland, v. 20, p. 74-87, 1974.
DASKALAKOU, N.; THANOS, C. Postfire regeneration of Aleppo pine - Density, survival and early growth of Pinus halepensis seddlings. In: MEDECOS CONFERENCE, 10., 2004, Rhodes, Greece. Proceedings… 2004. p. 1-10.
DAFIS, S. Forest ecology (in Greek). Thessaloniki: Giahoudi Giapouli, 1986. 443 p.
FLEWELLING, J.; MONSERUD, R. Comparing methods for modelling tree mortality. In: CROOKSTON, N.; HAVIS, R. (Eds.). Second
Forest Vegetation Simulator Conference. [s. l.]:
USDA Forest Service, Rocky Mountain Research Station, 2002. p. 169-177.
FORTIN, R.; LABRANCHE, M. XLSTEM™
V.1.1. Users Guide. Stem analysis software
module for Microsoft Excel 5.0. Canada: Regent Instruments, 1996. 14 p.
GADOW, K.; HUI, G. Modeling forest
development. Dordrecht: Kluwer Academic
Publishers, 1998. 219 p.
GOUDELIS, G. et al. Effect of repeated fire on plant community recovery in Penteli, central Greece. In: STOKES, A. et al. (Eds.). Eco- and Ground
Bio-Engineering: the use of vegetation to improve slope
Austin, v. 37, p. 557-568, 1987.
HATZISTATHIS, A.; DAFIS, S. Reforestations
– Forest nurseries (in Greek). Thessaloniki:
Giahoudi Giapouli, 1989. 265 p.
HERRANZ, J. et al. Postfire regeneration of Pinus halepensis Miller in a semi-arid area in Albacete province (south-eastern Spain). Ecoscience, Washington, v. 4, n. 1, p. 86-90, 1997.
KER, J. An evaluation of several methods of estimating site index of immature stands. The
Forestry Chronicle, Canada, v. 28, n. 3, p. 63-74,
1952.
KITIKIDOU, K.; APOSTOLOPOULOU, E. Applying survival analysis for assessment of forests sustainable development. Renewable &
Sustainable Energy Reviews, Amsterdam, v. 15,
p. 851-855, 2011.
KITIKIDOU, K.; BOUNTIS, D.; MILIOS, E. Site index models for calabrian pine (Pinus brutia Ten.) in Thasos island, Greece. Ciência Florestal, Santa Maria, v. 21, n. 1, p. 125-131, 2011.
KITIKIDOU, K.; KAYMAKIS, M.; MILIOS, E. Site index curves for young Populus tremula stands in Athos peninsula (Northern Greece). Turkish
Journal of Agriculture and Forestry, Ankara, v.
36, p. 55-63, 2012.
KITIKIDOU, K.; MATIS, K. Survival analysis
application for the evaluation of growth of fir
trees (Abies borisii-regis) of the University Forest of Pertouli (Northern Greece). In: PANELENIC STATISTICAL CONFERENCE, 24., 2011, Patra, Greece. Proceedings… 2011. p. 169-177.
KITIKIDOU, K.; PETROU, P.; MILIOS, E. Dominant height growth and site index curves for Calabrian pine (Pinus brutia Ten.) in central Cyprus. Renewable &
Sustainable Energy Reviews, Amsterdam,
v. 16, p. 1323-1329, 2012.
KLONARIS, G. Management plan of Kassandra Forestry Service, Chalkidiki (parts 1 and 4).
Chalkidiki : Kassandra Forestry Service, 1990. p. 87-743.
LANDAU, S.; EVERITT, B. A handbook of
statistical analyses using SPSS. New York:
Chapman and Hall/CRC, 2004. 354 p.
MABVURIRA, D.; MIINA, J. Individual-tree growth and mortality models for Eucalyptus grandis (Hill) Maiden plantations in Zimbabwe. Forest
Ecology and Management, Amsterdam, v. 161,
p. 231-245, 2001.
MARTINEZ-SANCHEZ, J. et al. Effect of burnt wood removal on the natural regeneration of Pinus
halepensis after fire in a pine forest in Tus valley (SE Spain). Forest Ecology and Management, Amsterdam, v. 123, p. 1-10, 1999.
MCFADYEN, A. The soil and its total metabolism. In: PHILLIPSON, J. (Ed.). Methods of Study in Quantitative Soil Ecology. Oxford: Blackweell; IBP Hanbook, 1971. n. 18, p. 1-13.
MILIOS, E. The influence of stand development process on the height and volume growth of dominant Fagus sylvatica L. s.l. trees in the central Rhodope Mountains of north-eastern Greece.
Forestry, Canada, v. 77, p. 17-26, 2004.
MILIOS, E. et al. The influence of position and site on the height growth of young Populus tremula L. ramets in low elevation formations in Northeastern Greece. Notulae Botanicae Horti Agrobotanici
Cluj-Napoca, Romenia, v. 40, p. 302-307, 2012.
MUENCHOW, G. Ecological use of failure time analysis. Ecology, Washington, v. 67, p. 246-250, 1986.
NEWBERRY, J. A note on Carmean’s estimate of height from stem analysis data. Forest Science, Maryland, v. 37, p. 368-369, 1991.
NIGH, G.; MARTIN, P. A method to assess the performance of growth intercept models in British Columbia. The Forestry Chronicle, Canada, v. 77, n. 3, p. 491-499, 2001.
PALAHÍ, M. et al. Site-index model for Pinus sylvestris in north-east Spain. Forest Ecology and
Management, Amsterdam, v. 187, p. 35-47, 2004.
PALAHÍ, M.; GRAU, J. Preliminary site index model and individual-tree growth and mortality models for black pine (Pinus nigra Arn.) in Catalonia (Spain). Investigacion Agraria de
Sistemas y Recursos Forestales, Madrid, v. 12,
n. 1, p. 137-148, 2003.
PAPAGEORGIOU, A. Social differentiation
analysis of trees in P. halepensis stands which
were initiated after the fires of 1990 and 1998
in the Peninsula of Kassandra in Chalkidiki,
Greece. 2011. 66 f. MSc Thesis (in Greek) -
Democritus University, Department of Forestry and Management of the Environment and Natural Resources, 2011.
PAPALEXANDRIS, C.; MILIOS, E. Analysis of natural Fagus sylvatica L. s.l. regeneration in low elevation stands located in the central part of the Evros region in northeastern Greece: is sprout origin
regeneration significant for species maintenance?
Plant Biosystems, Italy, v.144, p. 784-792, 2010.
eastern Iberian Peninisula. Plant Ecology, New York, v. 169, p. 205-213, 2003.
PAUSAS, J.; RIBEIRO, E.; VALLEJO, R.
Post-fire regeneration variability of Pinus halepensis in
the eastern Iberian Peninsula. Forest Ecology and
Management, Amsterdam, v. 203, p. 251-259,
2004.
PREISLER, H.; SLAUGHTER, G. Stochastic
model for tree survival in stands affected by
annosum root disease. Forest Science, Maryland, v. 43, p. 78-86, 1997.
PUKKALA, T. Studies on the effect of spatial
distribution of trees on the diameter growth of
Scots pine. Finland: University of Joensuu, Finland,
1988. 38 p.
PUKKALA, T. Predicting diameter growth in an evenaged Scots pine stand with a spatial and non spatial model. Silva Fennica, Amsterdam, v. 23, p. 101-116, 1989.
RAUTIAINEN, O. Spatial yield model for Shorea robusta in Nepal. Forest Ecology and Management, Amsterdam, v. 119, p. 151-162, 1999.
RINN, F. TSAP-Win User Reference Manual. Heidelberg: Rinntech, 2003.
RODIN, L.; BAZILEVICH, N. Production
and Mineral Cycling in Terrestrial Vegetation.
Edinburgh: Oliver and Boyd, 1967. 288 p.
SCHRÖDER, J.; SOALLEIRO, R.; ALONSO, V. An age-independent basal area increment model for maritime pine trees in northwestern Spain. Forest
Ecology and Management, Amsterdam, v. 157,
n. 1-3, p. 55-64, 2001.
SHAFII, B.; MOORE, J.; NEWBERRY, J. Individual-tree diameter growth models for quantifying within stand response to nitrogen fertilisation. Canadian Journal of Forest
Research, Ottawa, v. 20, p. 1149-1155, 1990.
SMIRIS, P. et al. Biomass of understory species of Pinus halepensis Mill. Forests in the Kassandra Peninsula – Chalkidiki. Silva Gandavensis, Ghent, v. 63, p. 134-142, 1998.
SMIRIS, P. et al. Aboveground biomass of Pinus halepensis Mill. forests in the Kassandra Peninsula – Chalkidiki. Silva Gandavensis, Ghent, v. 65 p. 173-187, 2000.
SOARES, P. et al. Evaluating a growth model for forest management using continuous forest inventory data. Forest Ecology and Management, Amsterdam, v. 71, p. 251-265, 1995.
STAMPOULIDIS, A.; MILIOS, E. Height structure analysis of pure Juniperus excelsa stands in Prespa National Park in Greece. Forestry Ideas,
Sofia, v. 16, n. 2, p. 239-244, 2010.
STAMPOULIDIS, A.; MILIOS, E.; KITIKIDOU, K. The regeneration of pure Juniperus excelsa Bieb. stands in Pespa National Park in Greece. Šumarski
list, Croatia, v. 3-4, p. 163-172, 2013.
TENNENT, R. Individual-tree growth model for Pinus radiata in New Zealand. Forest Science, Maryland., v. 12, p. 62-70, 1982.
TESHOME, T., PETTY, J. Site index equation for Cupressus lusitanica stands in Munessa, Ethiopia,
Forest Ecology and Management, Amsterdam,
v. 126, p. 339-347, 2000.
THANOS, C.; DASKALAKOU, E. Reproduction
in Pinus halepensis and Pinus brutia; Ecology,
Biogeography and Management of Pinus
halepensis and P. brutia forest ecosystems in
the Mediterranean Basin. Leiden: Backhuys
Publishers, 2000. p. 79-90.
THANOS, C.; DASKALAKOU, E.; NIKOLAIDOU, S. Early postfire regeneration of a Pinus halepensis forest on Mount Parnis, Greece.
Journal of Vegetation Science, Amsterdam, v. 7,
p. 273-280, 1996.
TRASOBARES, A.; TOMÉ, M.; JARI MIINA, J. Growth and yield model for Pinus halepensis Mill. in Catalonia, north-east Spain. Forest
Ecology and Management, Amsterdam, v. 203,
p. 49-62, 2004.
TROUSDELL, K.; BECK, D.; LIOYD, F. Site index for loblolly pine in the Atlantic Central
Plain of the Carolina and Virginia. [s. l.]:
USDA Forest Service, Research Paper SE-115, 1974. 11 p.
TSITSONI, T. Conditions determining natural
regeneration after wildfires in the Pinus halepensis
(Miller, 1768) forests of Kassandra Peninsula (North Greece). Forest Ecology and Management, Amsterdam, v. 92, p. 199-208, 1997.
VANCLAY, J. Compatible deterministic and stochastic predictions by probabilistic modelling of individual trees, Forest Science, Maryland, v. 37, p. 1656-1663, 1991.
VANCLAY, J. Modelling forest growth and yield:
applications to mixed tropical forests. Wallingford UK: CABI Publishing, 1994. 312 p.
VERROIOS, G.; GEORGIADIS, T. Postfire vegetation succession: The case of Aleppo pine (Pinus halepensis Miller) forests of Northern Achaia (Greece). Fresenius Environmental Bulletin, Switzerland, v. 11, p. 186-193, 2002.
J. Forest Science, Maryland, v. 28, p. 1784-1793, 1998.
WOODALL, C.; GRAMBSCH, P.; THOMAS, W. Applying survival analysis to a large–scale forest inventory for assessment of tree mortality in Minnesota. Ecololical Modelling, Amsterdan, v. 189, p. 199-208, 2005.
ZENS, M.; PEART, D. Dealing with death data:
individual hazard, mortality, and bias. Trends
in Ecology & Evolution, Amsterdam, v. 18,
p. 366-373, 2003.
ZHANG, S.; AMATEIS, R.; BURKHART, H. Constraining individual tree diameter increment and survival models for Loblolly pine plantations.
Forest Science, Maryland, v. 43, n. 3, p. 414-423