J. Serb. Chem. Soc. 79 (5) 565–578 (2014) UDC 546.56–71+547.576’288.3:
JSCS–4608 547.261:547.84
Original scientific paper
Thermodynamics of the complexation between salicylaldehyde
thiosemicarbazone with Cu(II) ions in methanol–1,4-dioxane
binary solutions
RASHMIDIPTA BISWAS, DHIRAJ BRAHMAN and BISWAJIT SINHA*
Department of Chemistry, University of North Bengal, Darjeeling-734013, India (Received 30 July, revised 7 November, accepted 19 November 2013)
Abstract: The complexation reaction between salicylaldehyde thiosemicar-bazone, abbreviated as STSC, with Cu(II) ion was studied in binary mixtures of methanol–1,4-dioxane using UV–Vis spectrophotometric and conductometric methods at different temperatures. The formation constants (Kf) for the 1:1
complex, Cu(II)–STSC, were calculated from computer fitting of the absor-bance and molar conductance data against various concentrations ratios (cM:cL
or cL:cM) in different binary solvent mixtures. A non-linear correlation was observed for the variation of log Kf for the complex against the solvent com-positions. Various thermodynamic parameters (ΔH, ΔS and ΔG) for the for-mation of the Cu(II)–STSC complex were also determined from the tempe-rature dependence of the formation constants (Kf). The results showed that the complexation reaction is affected by the nature and composition of the mixed solvents.
Keywords: salicylaldehyde thiosemicarbazone; Cu(II); stability constants; bin-ary mixtures; methanol; 1,4-dioxane.
INTRODUCTION
Schiff bases derived from the amines and aldehydes belong to an important class of ligands that coordinate to metal ions through the azomethine nitrogen.1–3
In recent years, there has been considerable interest in the chemistry of transition metal complexes of thiosemicarbazone ligands, primarily because of their bio-inorganic relevance.4 In the solid state, these thiosemicarbazones exist in the thione form and in solution they tautomerize into the thiol form.5 Complexation
usually occurs through the dissociation of the acidic proton, resulting in the formation of a five-membered chelate ring and, when an additional donor site is incorporated or linked to the carbonylic carbon by one or two intervening atoms, tricoordination usually occurs.5 Thiosemicarbazones of salicylaldehyde and their
derivatives constitute a class of versatile tridentate (O, N and S) donors capable of stabilizing both higher and lower oxidation states of transition metal ions.6–8 These ligands also have an ion-sensing ability, metal extraction properties, pharmacological properties, etc.9–13 Among the first row transition metals,
cop-per plays a pivotal role in cell physiology as a catalytic cofactor in the redox che-mistry of mitochondrial respiration, iron absorption, free radical scavenging, elastin cross-linking,14etc. Copper is found in all living organisms and is a
cru-cial trace element in redox chemistry, growth and development.15 It is important for the function of several enzymes and proteins involved in energy metabolism, respiration and DNA syntheses. Very little information is available in the lite-rature about the thermodynamic stability of the complexes of STSC and its deri-vatives, most probably due to their low water solubility that limits experimental exploration of their solution equilibria. However, the use of aqueous organic sol-vent mixtures can be useful for comparing the stability of complexes of different metal ions and a series of ligands in semi aqueous media.16–18
Among the various organic solvents, alcohols in nonpolar solvents can asso-ciate by means of hydrogen bonds into a series of n-mers. In dilute solutions, the predominant species are the unassociated molecules, while in concentrated solu-tions, both linear and n-mers coexist. In solvents such as 1,4-dioxane (DO) that can form hydrogen bonds with methanol (MeOH), the self-association of alco-hols may be reduced or perturbed in favor of hydrogen-bonded structures when mixed together, leading to intermolecular association between MeOH and DO molecules.19 Papanastasiou et al.20 suggested that binary mixtures of DO and
MeOH are characterized by the formation of two intermolecular complexes of the types (DO:MeOH) 1:1 and 1:2 and that DO can associate through hydrogen bonds involving either of its two oxygen atoms. Although, numerous literature data are available for complex formation of Schiff bases with metal ions in non-aqueous solvents and mixed solvent systems, thermodynamic data on complex formation of salicyaldehyde thiosemicarbazone (STSC) with Cu(II) ions in pure and mixed non-aqueous or semi aqueous solvents are rather scarce.21–26 Hence in this work, the complexation behavior of STSC with Cu(II) ion in different MeOH–DO mixed solvents was studied in order to understand the thermodyn-amics of complex formation between STSC and Cu(II) in the studied mixed sol-vents.
EXPERIMENTAL Materials
spec-troscopic and other analytical methods.11 The various binary solvent mixtures were prepared
by mass and necessary adjustments were performed to achieve exact mass fractions (w1 =
= 0.40, 0.60, 0.80 and 1.00) of MeOH in the binary solvent mixtures at 298.15 K under atmospheric pressure. The mass measurements were realized on a digital electronic analytical balance (Mettler, AG 285, Switzerland) with a precision of ±0.01 mg. The relative error in solvent composition was about 1%. The physical properties of these solvent mixtures are available in the literature.27
Preparation of the ligand
Thiosemicarbazone (0.746 g) was dissolved in 75 mL of doubly distilled deionized water by warming. To the obtained solution, salicylaldehyde (1 g) was added and the reaction mixture was refluxed for 3–4 h. Crystals of STSC were obtained from the solution on cooling. The thus-obtained crystals were separated by filtration, dried under vacuum and further puri-fied by recrystallization from ethanol.
Analytical and spectral data of the ligand
The melting point of the ligand was determined by the open capillary method. The IR spectrum of the ligand salicyaldehyde thiosemicarbazone in the wavenumber range 400–4000 cm-1 was recorded on a Perkin–Elmer FT-IR spectrophotometer (RX-1). Elemental
micro-analyses were realized using a Perkin–Elmer (Model 240C) analyzer.
Salicyaldehyde thiosemicarbazone. White crystalline compound; Anal. Calcd. for C8H9N3OS: C, 49.23; H, 4.61; N, 21.53; S, 16.41 %; IR (KBr, cm-1): 3443.87 (344429),
3320.97 (332129), 3175.01 (317529), 1236.84 (123729), 1035.91 (103629), 751.76 (75229).
The structure of the synthesized Schiff base is depicted in Fig. 1.
Fig. 1. Structure of salicylaldehyde semicar-bazone (STSC).
UV–Vis spectrophotometric titration
The absorbance spectra were recorded on a Jasco V-530 spectrophotometer equipped with a thermostated bath. During the complexation studies, temperature of the quartz cell was maintained at 298.15±0.1 K. For the spectrophotometric titration, the stepwise additions of metal ion solution (1.3×10⁻³ mol dm-3) to 2 mL of a solution of ligand (5.0×10⁻⁵ mol dm-3)
were realized using a 10 µL pre-calibrated micropipette. The absorbance (A) of the solution was measured after each addition of metal ion solution to the ligand solution.
Conductometric titration
The conductance measurements were performed with a Systronics-308 conductivity bridge (with a precision ±0.1 %) and a dip-type immersion conductivity cell (type CD-10) at a frequency of 1 kHz. Measurements were made in a water bath maintained at ±0.01 K of the desired temperatures. The cell was calibrated with standard KCl solution as described earlier32
and the cell constant was 1.16 cm-1. During the conductometric titration, a solution of copper
nitrate (5.0×10⁻⁴ mol dm-3, 15 mL) was placed in the conductivity cell and the conductance of
to the conductivity cell with a pre-calibrated micropipette (50 µL) and the conductance of the resulting solution was measured after each addition. Addition of the ligand solution was con-tinued until the total concentration of the ligand was approximately three times greater than that of the metal ion concentration (cL:cM = 3:1).
RESULTS
UV–Vis spectrophotometric titration
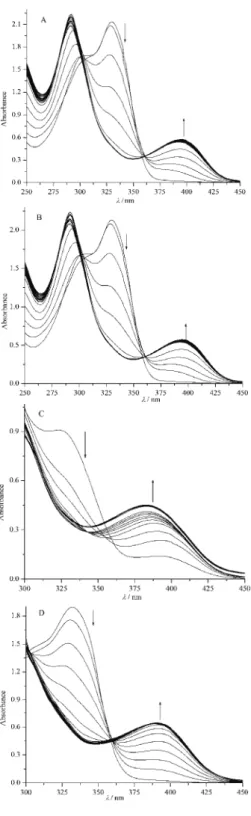
The UV–Vis spectra of the STSC ligand and its Cu(II) complex in pure MeOH and in the binary mixtures of MeOH with DO are presented in Fig. 2, which shows that the absorption spectrum of the solution of STSC ligand (ini-tially 5.0×10⁻⁵ mol dm–3) underwent marked changes when a solution of Cu(II) cations (1.3×10⁻³ mol dm–3) was added to the ligand solution in a stepwise
fashion until the contentratrions ratio, cM:cL, of 3:1 at 298.15 K was achieved.
The UV–Vis spectrum of STSC showed two characteristic bands at around 291 and 332 nm. These bands originate from the azomethine chromophore and the phenol moiety, respectively. During the spectrophometric titration, complex for-mation was indicated by a gradual decrease in the intensity of the 332 nm peak and by the development of a peak at around 394 nm. These changes in UV–Vis spectra were due to the coordination of Cu(II) ion through imine nitrogen atom, sulfur atom with an additive effect from the deprotonation of the phenolate group upon chelation, resulting in the formation of six and five-membered ring systems between the metal atom and the ligand in the complex.16 However, the peak at
291 nm overlapped with that of the free NO3– at around 298 nm29 and increased
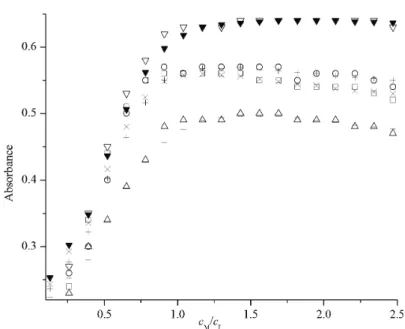
gradually in intensity in pure MeOH as more and more electrolyte solution was added, but the peak showed no such changes for the solutions in the binary mixtures; probably due to low dielectric constants of the binary mixtures. Hence, the analysis of the spectrophotometric data was performed with the absorbance values at λ = 394 nm as shown in Fig. 3. It is evident from Fig. 3 that when the ligand STSC reacted with Cu(II) ions in MeOH and its binary mixtures with DO, a 1:1 complex is formed. The mass balance for the ML complex is given by the relation:31
M+LML (1)
and the formation constant (Kf) could be given by: f
[ML] [M][L]
K = (2)
Fig. 2. UV–Vis spectra of the STSC ligand (5×10⁻⁵ mol dm-3) in the presence of
Fig. 3. Absorbance plot () for the ligand STSC with Cu(II) ion against cM:cL for different mass fractions (w1) of MeOH in different solvent mixtures at 298.15 K. Symbols for the
experimental data: □, w1 = 1.00; ○, w1 = 0.80; Δ, w1 = 0.60; ∇, w1 = 0.40. Symbols for the calculated data: ×, w1 = 1.00; +, w1 = 0.80; –, w1 = 0.60; ▼, w1 = 0.40.
M [M] [ML]
c = + (3)
L [L] [ML]
c = + (4)
When the [M] and [L] values, obtained from Eqs. (3) and (4), are substituted in Eq. (2), one obtains Kf as:
f
M L
[ML]
( [ML])( [ML])
K
c c
=
− − (5)
If only the complex absorbs at a particular wavelength, the total absorption (A) at this wavelength can be given by:
[ML]A=εl =ε[ML] (6)
where ε is the molar absorption coefficient of the complex and the path length l = 1 cm. Hence, from the above relation, [ML] is given by:
[ML]=Aε (7)
Therefore, when cM >> cL, Eq. (5) can be rearranged as: f
M L M L
[ML] /
( [ML]) ( / )
A K
c c c c A
ε ε
= =
− − (8)
M L M
f
1
c c c
A = ε +εK (9)
Thus a linear regression of cMcL/A against cM gives the molar absorption
coefficient (ε) from the slope and Kf from the intercept. Using these ε and Kf values, obtained from Eq. (9) as initial guess values, the absorbance (Acald.,i) of each solution was iteratively calculated and then the final ε and Kf values were obtained from Eq. (10) by using the Newton–Raphson Method with the aid of a C-program. Eq. (10) was obtained after some rearrangement of Eq. (5):
(
A/ε)
2−{(cM+cL) 1 /+ Kf}(
A/ε)
+c cM L =0 (10)The standard errors (σ) in the absorbances were calculated from the follow-ing the relation:
1/2 2 exp., cald., 1 { } / σ = = −
n i i iA A n (11)
where n stands for the number of solutions. The obtained standard errors (σ) were 0.035, 0.025, 0.039 and 0.042 in the solvent mixtures with w1 = 0.40, 0.60, 0.80
and 1.00, respectively. Conductometric titration
It is known that the equilibrium for 1:1 complexation is represented by Eq. (1) and the formation constant (Kf) is given by:
ML f M L [ML] [M][L] = f K
f f (12)
where the f terms stand for the activity coefficients of the species indicated in subscripts. Under the employed dilute concentration range, the activity coeffi-cient of the uncharged ligand (fL) can be assumed to be unity.33,34 According to
the Debye–Huckel limiting law fM ≈ fML, the activity coefficients in Eq. (12)
cancel each other.35 The fraction of the total metal ion concentration (α), remain-ing free at equilibrium, can be expressed by the relation:
m ML
MA ML
Λ Λ
Λ Λ
α = −
− (13)
where Λm, ΛMA and ΛML stand for the total molar conductance, and the molar
conductance of the electrolyte and the complex, respectively. The ΛML values
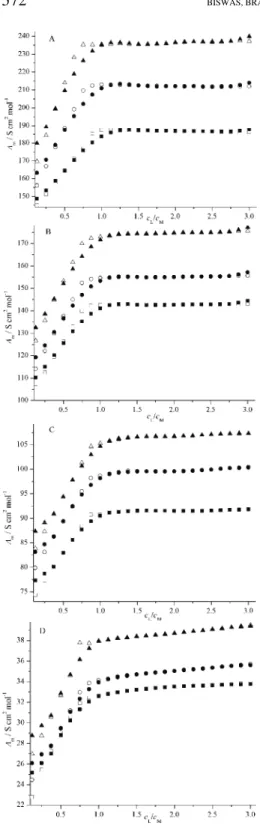
Fig. 4. Molar conductance (Λm) vs. mole ratio
plot (cL:cM) for the Cu(II)–STSC complex in
for each solution was calculated using the [M] and [L] values. Eq. (12) can also be rearranged as:36
2
f[ML] {1 ( M L) f}[ML] f M L 0
K − + c +c K +K c c = (14)
The final Kf values and [ML] were then calculated iteratively using the Newton–Raphson Method and successive approximations with the aid of a C-program.
DISCUSSION
The nature of a solvent can strongly influence the stoichiometry of a com-plex and comcom-plexation of transition metal ions in solution. The stability of tran-sition metal complexes with polydentate ligand depends on several factors, such as the number and type of the donor sites present in the ligand, the number and size of the chelate rings formed on complexation, etc.37 In addition, the stability
also depends upon the donor strengths and dielectric constants of solvent–solvent mixtures.38Although the STSC solution had negligible conductance, its addition
to the metal ion solution caused a rather large and continuous increase in molar conductance in all solvents. As can be seen from Fig. 4, the addition of STSC to Cu(II) ions in pure MeOH as well as in the binary solvent mixtures at different temperatures resulted in increases in molar conductivity. This fact indicated that the Cu(II)–STSC complex is more mobile than solvated Cu(II) ions and to the existence of some ion pairs in the initial salt and the release of some high-mob-ility protons and NO3– into the solution.39,40 The slope of Λmvs. cL/cM plots for
all solvent mixtures showed significant changes in slopes when cL:cM was about
1 thus indicating the formation of a relatively stable 1:1 complex (ML) between Cu(II) ions and STSC. From Fig. 4, it is also evident that the curvature of the molar conductivity plots for the Cu(II)–STSC complex decreased as the experi-mental temperature increased. This fact indicated to the formation of a weaker complex at higher temperatures. This is also evident from Table I wherein log Kf
for Cu(II)–STSC complex in pure MeOH as well as in the binary solvent mix-tures decreased with increasing temperature. However, slightly higher values of log Kf were obtained at 318.15 K for solvent mixtures with w1 = 0.40 and 0.60
than those at 308.15 K.
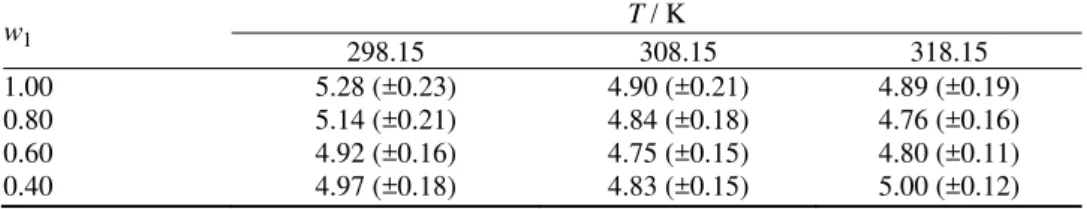
TABLE I. log Kf values for the Cu(II)–STSC complex obtained from complexometric
tit-rations in MeOH–DO binary mixtures at different temperatures; w1 is the mass fraction of MeOH in the binary solvent mixtures. Standard errors are given in the parenthesis
w1
T / K
298.15 308.15 318.15
1.00 5.28 (±0.23) 4.90 (±0.21) 4.89 (±0.19)
0.80 5.14 (±0.21) 4.84 (±0.18) 4.76 (±0.16)
0.60 4.92 (±0.16) 4.75 (±0.15) 4.80 (±0.11)
MeOH has a higher Gutmann donor number (DN = 19) that that of DO (DN = = 14.8).41 However, a comparison of the stability constants given in Table I and III revealed that Cu(II) ion was weakly solvated and easily complexed by the ligand in the solvent mixtures with higher contents of MeOH and the stability constants decreased with increasing concentration of DO in the binary solvents. This fact is in accordance with the reverse order of their solvating ability as rep-resented by their Gutmann donor numbers. It is known that the solvating ability of the solvent plays an important role in different complexation reactions. More-over, the stability and selectivity of the formed complexes are affected by a num-ber of molecular factors, such the numnum-ber and character of the donor atoms in the Schiff base, the polarizibility and charge density of the metal ion, the nature of substituents and the character of the co-anion with the cationic species.42,43 In the Cu(II)–STSC complex, the ligand binds a Cu(II) ion through its three binding sites (O, N and S) and the fourth coordination site is most probably occupied by the solvent molecules, i.e., MeOH or DO.16 However, as per the polarity and
steric factors for MeOH and DO, it is expected that MeOH will preferentially occupy the fourth coordination site. Regardless, the variation of the log Kf for the
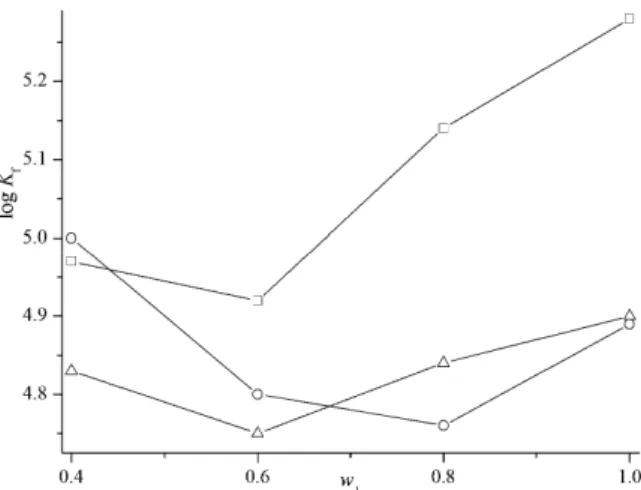
Cu(II)–STSC complex as a function of solvent composition is presented in Fig. 5, which shows that the changes in the stability constants for Cu(II)–STSC complex vs. the solvent composition are not linear. This evidence reflects that changes might be occurring in the structure of the solvent mixtures20 and these changes
probably alter solvations of the metal ion, the Schiff base and even the resulting complex as well as the preferential solvation of these species in the mixed sol-vents.44 Preferential solvation of ions by one of the components of a mixed sol-vent system depends on two factors: the relative donor–acceptor abilities of the
Fig. 5. Variation of formation constants (Kf) for Cu(II)–STSC complex against mass
component molecules towards the ion and the interactions between solvent mole-cules themselves. The solvating properties of the components in mixed solvents can even be significantly modified by solvent–solvent interactions when the energy of the latter is comparable with the energy difference of ion–solvent inter-actions for both of the components.45
Anyway, the stability constants given in Tables I and II have nearly the same order although the formation constants evaluated by the two methods are not the same but are similar in magnitude. This is because the experimental data were analyzed by two different approaches in the two methods used to determine the stability constants (Kf) and they have their own intrinsic error limits.
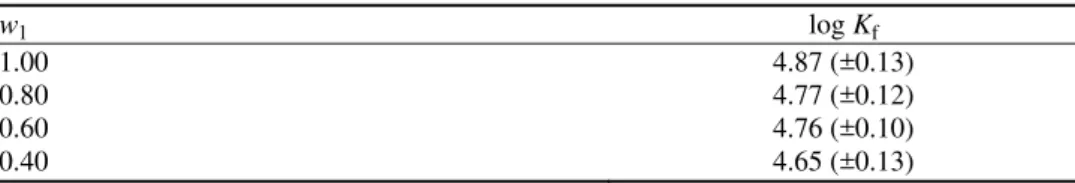
TABLE II. log Kf values for the Cu(II)–STSC complex obtained from UV–Vis spectro-photometry in MeOH–DO binary mixed solvents at 298.15 K; w1 is the mass fraction of
MeOH in the binary solvent mixtures. Standard errors are given in the parenthesis
w1 log Kf
1.00 4.87 (±0.13)
0.80 4.77 (±0.12)
0.60 4.76 (±0.10)
0.40 4.65 (±0.13)
Thermodynamic parameters
In order to obtain a better understanding of the thermodynamics of the com-plexation reaction between Cu(II) and STSC, it is useful to determine the contri-butions of enthalpy and entropy of the reaction. The thermodynamic parameters were calculated from the temperature dependence of the complexation constants (van’t Hoff plot):
f
2.303logK H S
RT R
Δ Δ
= − +
where R is the gas constant. For all the solvent mixtures, the plots of log Kf vs.
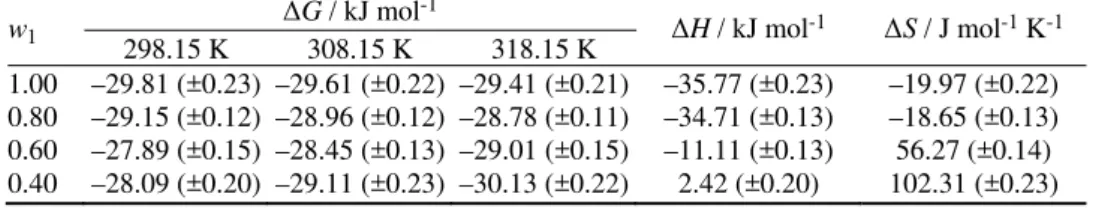
1/T were almost linear and the ΔS and ΔH values were determined in the usual way from the slope and the intercept of the plots, respectively. The calculated thermodynamic parameters are listed in Table III. The ΔH and ΔS values asso-ciated with the complexation reaction were negative for all the solvent mixtures except for the solvent mixture with w1 = 0.40. The ΔG values for the
complex-ation reaction were negative indicating the spontaneity of the reaction. Thus, it is evident that the reactions were spontaneous and enthalpy-driven except for the solvent mixture with w1 = 0.40. For this solvent mixture, the complexation
complex-ation process, as well as the degree of ion–solvent, ligand–solvent, complex– solvent and solvent–solvent interactions.46,47
TABLE III. Thermodynamic parameters (ΔH, ΔS andΔG) for the formation of the Cu(II)– –STSC complex in different binary mixtures of MeOH with DO
w1 ΔG / kJ mol
-1
ΔH / kJ mol-1 ΔS / J mol-1 K-1
298.15 K 308.15 K 318.15 K
1.00 –29.81 (±0.23) –29.61 (±0.22) –29.41 (±0.21) –35.77 (±0.23) –19.97 (±0.22) 0.80 –29.15 (±0.12) –28.96 (±0.12) –28.78 (±0.11) –34.71 (±0.13) –18.65 (±0.13) 0.60 –27.89 (±0.15) –28.45 (±0.13) –29.01 (±0.15) –11.11 (±0.13) 56.27 (±0.14) 0.40 –28.09 (±0.20) –29.11 (±0.23) –30.13 (±0.22) 2.42 (±0.20) 102.31 (±0.23)
CONCLUSIONS
The formation constants for the complexation of Cu(II) ion with STSC were determined conductometrically at different temperatures and spectrophotometric-ally at 298.15 K. Thermodynamic parameters for the complexation were deter-mined from the temperature dependence of the formation constant. The stoichio-metry of the Cu(II)–STSC complex in pure MeOH and in all the MeOH–DO binary mixtures was found to be 1:1. The negative values of ΔG show the ability of the studied ligand to form stable complex with Cu(II) ion and the com-plexation proceed spontaneously.
Acknowledgements. The authors are grateful to the Departmental Special Assistance Scheme under the University Grants Commission, New Delhi (SAPDRS-III, No. 540/12/ /DRS/2013) for financial support.
И З В О Д
ТЕРМОДИНАМИКАФОРМИРАЊАКОМПЛЕКСА Cu(II) САСАЛИЦИЛАЛДЕХИД- -ТИОСЕМИКАРБАЗОНОМУБИНАРНИМРАСТВОРИМАМЕТАНОЛ–1,4-ДИОКСАН
RASHMIDIPTA BISWAS, DHIRAJ BRAHMAN и BISWAJIT SINHA
Department of Chemistry, University of North Bengal, Darjeeling-734013, India
Реакцијакомплексирања Cu(II) исалицилалдехидтиосемикарбазона (STSC) испи -тивана је у бинарним растворима метанол–1,4 диоксан применом метода спектро -фотометријеу ултраљубичастојивидљивојобласти икондуктометријенаразличитим температурама. Константеформирања (Kf) за 1:1 комплекс, Cu(II)–STSC, суизрачунате коришћењем података о апсорбанцији и моларној проводљивости у функцији разли -читих односа концентрација (cM:cL или cL:cM) у бинарним растоворима. Добијена је нелинеранакорелацијаизмеђупромене log Kfкомплексаисаставараствора. Изтемпе -ратурске зависности константи формирања oдређени су термодинамички параметри (ΔH, ΔS и ΔG) формирања Cu(II)–STSC комплекса. Добијени резултати показују да природаисаставкоришћенихраствораутичунареакцијакомплексирања.
REFERENCES
1. P. A. Vigato, S. Tamburini, Coord. Chem. Rev.248 (2004) 1717
2. C. T. Barboiu, M. Luca, C. Pop, E. Brewster, E. M. Dinculescu, Eur. J. Med. Chem.31 (1996) 597
3. A. S. M. Al-Shiri, H. M. Abdel-Fattah, J. Therm. Anal. Calorim. 71 (2003) 643 4. S. B. Padhye, G. B. Kaffman, Coord. Chem. Rev.63 (1985) 127
5. F. Basuli, S. M. Peng, S. Bhattacharya, Inorg. Chem. 36 (1997) 5645
6. A. F. Petrović, V. M. Leovac, B. Ribár, G. Argay, A. Kálmán, Transition Met. Chem.11 (1986) 207
7. S. Purohit, A. P. Koley, L. S. Prasad, P. T. Manoharan, S. Ghosh, Inorg. Chem.28 (1989) 3735
8. A. P. Koley, S. Purohit, L. S. Prasad, P. T. Manoharan, S. Ghosh, Inorg. Chem.31 (1992) 1764
9. R. K. Mahajan, I. Kaur, T. S. Lobana, Talanta59 (2003) 101
10. R. K. Mahajan, I. Kaur, T. S. Lobana, Indian J. Chem., A 45 (2006) 639 11. R. K. Mahajan, T. P. S. Walia, Sumanjit, T. S. Lobana, Talanta67 (2005) 755 12. L. S. Sarma, J. R. Kumar, C. J. Kumar, A. V. Reddy, Anal. Lett.36 (2003) 605
13. K. J. Reddy, J. R. Kumar, C. Ramachandraiah, T. Thriveni, A. V. Reddy, Food Chem. 101 (2007) 585
14. J. R. Turnlund, W. R. Keyes, H. L. Anderson, L. L. Acord, Am. J. Clin. Nutr.49 (1989) 870
15. M. C. Linder, Biochemistry of Copper, Plenum Press, New York, 1991
16. E. A. Enyedy, E. Zsigo, N. V. Nagy, C. R. Kowol, A. Roller, B. K. Keppler, T. Kiss, Eur. J. Inorg. Chem. 25 (2012) 4036
17. A. Shokrollahi, M. Ghaedi, H. Ghaedi, J. Chin. Chem. Soc.54 (2007) 933
18. A. Shokrollahi, M. Ghaedi, M. Montazerozohori, A. H. Kainfar, H. Ghaedi, N. Khanjari, S. Noshadi, S. Joybar, E-J. Chem.8 (2011) 495
19. Y. K. Syrkin, M. E. Dyatkina, Structure of Molecules and the Chemical Bond,Dover, 1964, p. 127
20. G. E. Papanastasiou, I. I. Zlogas, J. Chem. Eng. Data37 (1992) 167
21. J. Costamagna, L. E. Lillo, B. Matsuhiro, M. D. Noseda, M. Villagran, Carbohyd. Res. 338 (2003) 1535
22. S. Sahoo, S. E. Muthu, M. Baral, B. K. Kanungo, Spectrochim. Acta, A 63 (2006) 574 23. D. M. Boghaei, M. Gharagozlou, Spectrochim. Acta, A 61 (2005) 3061
24. K. Takao, Y. Ikeda, Inorg. Chem.46 (2007) 1550
25. Y. Fang, Z. Sun, Huaxue Xuebao47 (1989) 487 (in Chinese)
26. C. K. Bhaskare, P. P. Hankare, R. S. Rampure, V. B. Mane, J. Ind. Chem. Soc.66 (1989) 215
27. D. Brahman, B. Sinha, J. Chem. Eng. Data56 (2011) 3073
28. J. Lu, H. Guo, X. Zeng, Y. Zhang, P. Zhao, J. Jiang, L. Zang, J. Inorg. Biochem.112 (2012) 39
29. B. Sinha, P. K. Roy, B. K. Sarkar, D. Brahman, M. N. Roy, J. Chem. Thermodyn. 42 (2010) 380
30. M. Joshaghani, M. B. Gholivand, F. Ahmadi, Spectrochim. Acta, A 70 (2008) 1073 31. H. A. Benesi, J. H. Hildebrand, J. Am. Chem. Soc.71 (1949) 2703
35. P. Debye, H. Huckel, Phys. Z.24 (1928) 305
36. V. S. Ijeri, A. K. Srivastava, Eur. J. Inorg. Chem. (2001) 943
37. V. Gutmann, The Donor–Acceptor Approach to Molecular Interactions, Plenum Press, New York, 1978, p. 26
38. A. I. Popov, J. M. Lehn, in Coordination Chemistry of Macrocyclic Compounds, G. A. Melson, Ed., Plenum Press, New York, 1979, Ch. 9, p. 557
39. B. O. Strasser, A. I. Popov, J. Am. Chem. Soc.,107 (1985) 7921
40. M. R. Ganjali, A. Rohollahi, A. Monghimi, M. Shamsipur, Pol. J. Chem. 70 (1996) 1172 41. Z. Pourghobadi, F. Seyyed-Majidi, M. Daghighi-Asli, F. Parsa, A. Monghimi, M. R.
Ganjali, H. Aghabozorg, M. Shamsipur, Pol. J. Chem. 74 (2000) 837
42. R. M. Izatt, J. S. Bradshaw, S. A. Nielsen, J. D. Lamb, J. J. Christensen, D. Sen, Chem. Rev. 85 (1985) 271
43. R. M. Izatt, K. Pawlak, J. S. Bradshaw, R. L. Bruening, Chem. Rev. 91 (1991) 1721 44. G. H. Rounaghi, R. S. Khoshnood, M. H. A. Zavvar, J. Incl. Phenom. Macrocycl. Chem.
54 (2006) 247
45. J. Szymańska-Cybulska, E. Kamieńska-Piotrowich, J. Solution Chem. 35 (2006) 1631 46. G. Khayatian, S. Shariati, M. Shamsipur, J. Incl. Phenom. Macrocycl. Chem. 45 (2003)
117