Patient Body Weight-Tailored Contrast Medium Injection
Protocol for the Craniocervical Vessels: A Prospective
Computed Tomography Study
Rebecca Kessler1*, Katrin Hegenscheid1, Steffen Fleck2, Alexander Khaw3, Michael Kirsch1, Norbert Hosten1, So¨nke Langner1
1Institute of Diagnostic Radiology and Neuroradiology, University Medicine Greifswald, Greifswald, Germany,2Department of Neurosurgery, University Medicine Greifswald, Greifswald, Germany,3Department of Neurology, University Medicine Greifswald, Greifswald, Germany
Abstract
Objectives: To evaluate body weight-tailored contrast medium (CM) administration for computed tomography angiography (CTA) of the craniocervical vessels.
Methods:Institutional review board approval was obtained, and all patients gave written informed consent. Sixty patients were consecutively assigned to one of three dose groups (20 patients per group) with CM doses of Visipaque 270H (iodixanol 270 mg/ml) tailored to body weight at doses of 1.5, 1.0, or 0.5 ml/kg. Region-of-interest (ROI) analysis of maximum enhancement (ME) was conducted, and signal-to-noise-ratios (SNR) and contrast-to-noise-ratios (CNR) were calculated. Retrospective comparison was performed with three matched control groups examined with a standard CM dose (80 ml of Visipaque 270H). Image quality was rated by two neuroradiologists blinded to the CM dose used. Interrater reliability was calculated using kappa statistics.
Results: Body weight/BMI and ME were inversely correlated in the three control groups receiving the standard dose (r =20.544/20.597/20.542/r =20.358/r =20.424/r =20.280). Compared to standard dose, 1.5 ml/kg produced higher ME, SNR, and CNR in the anterior circulation (p#0.038), 1.0 ml/kg had higher ME in cervical and medium-sized cerebral arteries (p#0.034), and 0.5 ml/kg had lower ME, SNR and CNR for medium-sized cerebral arteries (p#0.049). ME, SNR, and CNR were the same for 1.5 ml/kg and 1.0 ml/kg (p$0.24), and both had higher values compared to 0.5 ml/kg (p#0.043/p#0.028). In patients with BMI.25, 1.5 ml/kg and 1.0 ml/kg produced higher ME than standard dose (p,0.001/p = 0.008), but ME in patients with BMI.25 did not differ between group 1 and group 2 (p = 0.673). In patients with BMI#25, 1.5 ml/kg and 1.0 ml/kg produced ME comparable to standard dose (p = 0.132/p = 0.403). Regardless of patient weight, 0.5 ml/kg yielded lower ME than standard dose (p = 0.019/0.002).
Conclusions:Craniocervical CTA with a body weight-tailored CM dose of 1.0 ml/kg (270 mg iodine/ml) reduces iodine load in patients weighing,80 kg while producing ME similar to standard dose and improves ME in patients with BMI.25.
Citation:Kessler R, Hegenscheid K, Fleck S, Khaw A, Kirsch M, et al. (2014) Patient Body Weight-Tailored Contrast Medium Injection Protocol for the Craniocervical Vessels: A Prospective Computed Tomography Study. PLoS ONE 9(2): e88867. doi:10.1371/journal.pone.0088867
Editor:Pedro Antonio Valdes-Sosa, Cuban Neuroscience Center, Cuba
ReceivedJuly 29, 2013;AcceptedJanuary 13, 2014;PublishedFebruary 18, 2014
Copyright:ß2014 Kessler et al. This is an open-access article distributed under the terms of the Creative Commons Attribution License, which permits unrestricted use, distribution, and reproduction in any medium, provided the original author and source are credited.
Funding:The study was conducted in clinical routine patient care and special funding was not necessary and did not take place. The authors have no support or funding to report.
Competing Interests:The authors have declared that no competing interests exist. * E-mail: [email protected]
Introduction
Since the implementation of helical and multidetector comput-ed tomography (MDCT), computcomput-ed tomography angiography (CTA) has become a widely accepted technique for the assessment of the craniocervical vessels. It is often used for initial neurovas-cular imaging because it allows rapid evaluation of a wide range of craniocervical vascular conditions including stroke, aneurysms, traumatic vessel lesions, and vascular malformations [1–3].
CTA requires the administration of iodinated contrast medium (CM). Disadvantageously, iodinated CM can cause contrast-induced nephropathy (CIN), especially in patients with pre-existing renal impairment [4]. Concomitant risk factors are diabetic nephropathy, dehydration, congestive heart failure,
concurrent administration of nephrotoxic drugs, and the dose and type of CM [1]. CIN ranks third among the causes of hospital-acquired acute renal failure in the US [2].
The policy of many radiology departments is to administer a uniform dose of CM to all patients undergoing CTA of the craniocervical vessels. However, the degree of contrast enhance-ment achieved is strongly dependent on the amount of CM injected in relation to the patient’s body weight. Several studies have investigated this relationship, indicating that, for protocols with a fixed contrast dose, there is an inverse correlation between body weight and vascular or parenchymal contrast enhancement in abdominal enhanced computed tomography (CT) [3] and pulmonary CTA [4–6].
Hence, some authors have suggested contrast injection protocols with iodine doses tailored to patient body weight for abdominal enhanced CT [7–10], pulmonary CTA [11], and coronary CTA [12–15]. Awai et al. [16] report having achieved almost constant aortic enhancement irrespective of body weight when using a protocol with the dose tailored to patient weight and a fixed injection duration.
These findings are good reason to evaluate the effect of body weight-tailored CM dosage for CTA of the craniocervical vessels. Unlike for imaging of the abdomen, pulmonary vessels and coronary arteries, data on weight-tailored CTA of the craniocer-vical vessels are sparse.
Thus, the purpose of our study was to prospectively evaluate whether tailoring CM dose to patient body weight is also beneficial for craniocervical CTA with regard to quantitative vascular enhancement and subjective image quality and should be favored over administration of a uniform CM dose.
Materials and Methods
Patient Population and Ethics Statement
The study was approved by the ethics committee at the medical faculty of the University of Greifswald (registration number BB 65/09). Written informed consent was obtained from all patients. Between July 2009 and March 2010, 60 patients were enrolled in this prospective study. The patients were assigned consecutively to one of three protocols (20 patients per protocol). In all protocols the intravenous CM dose of Visipaque 270H (iodixanol 270 mg/ml, GE Healthcare Buchler, Braunschweig, Germany) was tailored to patient body weight using 1.5 ml/kg, 1.0 ml/kg and 0.5 ml/kg in groups 1, 2 and 3, corresponding to 405 mg, 270 mg and 135 mg iodine/kg body weight, respectively. Neurological or neurosurgical adult patients ($18 years) with suspected or known cerebrovascular disease were included. Exclusion criteria were renal failure defined as glomerular filtration rate below 60 ml/min/1.73 m2, manifest hyperthyroidism, previous history of contrast medium intolerance, and pregnancy or lactation. We also excluded patients treated in the intensive care unit and patients with clinically apparent cardiac failure. For retrospective compar-ison with the standard protocol using a fixed dose of 80 ml of Visipaque 270H, three groups of patients, who had been examined between January 2008 and June 2009, were formed, referred to as controls 1, 2 and 3, respectively. To reduce demographic bias, the control patients were also selected from the neurological and neurosurgical patient population and each of the control patients was age- and sex-matched to one of the consecutive study patients. For further analysis, groups and controls were subdivided according to body mass index (BMI). A BMI of 25 was set as threshold for overweight referring to the BMI classification of the World Health Organization.
CT Protocol
All CT studies were performed on a helical 16-slice MDCT scanner (Somatom Sensation 16, SIEMENS Medical Solutions, Erlangen, Germany). CTA was performed using semiautomatic bolus tracking in the common carotid artery at the level of the C5 vertebra with a threshold of 200 Hounsfield units (HU). The CM was administered using a power injector (MedRad Medical Systems, Volbach, Germany) with a flow rate of 4 ml/s, followed by a saline flush of 40 ml injected at the same rate. The CTA scan range covered the volume from the C7 vertebra to the vertex. Scan parameters were 1660.75 mm collimation, pitch of 1.25, 1 mm reconstructed slice thickness, 120 mA tube current, and 100 kV tube voltage. For further analysis, thick slab maximum
intensity projections (MIP) in orbitomental and coronal planes were reconstructed with 20 mm slice thickness.
Image Analysis
Region-of-interest (ROI) analysis was used for quantitative image evaluation at a clinical workstation (Agfa IMPAX ES 5.2, Agfa HealthCare, Mortsel, Belgium). A radiologist with 3 years of experience in CTA of the craniocervical vessels manually placed a circular or elliptic ROI on transverse source images in the following predefined regions: common carotid arteries (CCA), 2 cm proximal to the bifurcation; external carotid arteries (ECA), 1 cm distal to the bifurcation; extracranial internal carotid arteries (ICAex), 2 cm below the skull base; intracranial internal carotid arteries (ICAin), immediately proximal to the internal carotid bifurcation; A1 segment of anterior cerebral arteries (ACA); anterior communicating artery (AcomA); M1 segment of middle cerebral arteries (MCA); posterior communicating arteries (PcomA); P2 segment of posterior cerebral arteries (PCA); superior cerebellar arteries (SCA); anterior inferior cerebellar arteries (AICA); basilar artery (BA), immediately distal to the confluence of the vertebral arteries; posterior inferior cerebellar arteries (PICA); and vertebral arteries (VA), 2 cm below the skull base. Wherever possible, ROIs were placed on both sides. The size of the ROI was adjusted to the vessel diameter. To reduce bias, two independent measurements were performed at each measurement site. The average of the two measurements was defined to be the maximum enhancement (ME). Congenital variations in the anatomy of the circle of Willis such as aplasia or hypoplasia of arteries or arterial segments were recorded. In case of aplastic arteries these anatomical target locations were excluded from evalutation. In case of hypoplastic arteries these were skipped if the vessel diameter was too small to allow ROI placement. Craniocervical arterial stenosis was graded according to NASCET criteria [17]. If the stenosis involved the site of measurement in a vessel, the size of the ROI was reduced to exclude the atherosclerotic plaque if the degree of stenosis was,70%. If the stenosis was.70% or in case of occlusion, the vessel was excluded from evaluation. Measurements in vessel territories distal to a stenosis or occlusion were conducted.
ROIs for measuring attenuation (HU) of background and brain parenchyma in the centrum semiovale on the right side enclosed a constant area of 2 cm2 in all patients. These ROIs served to calculate signal-to-noise and contrast-to-noise ratios (SNR and CNR) using the following equations:
SNR~
mean vessel enhancement background noise
CNR~
(mean vessel enhancement{signal of brain parenchyma)
background noise
Background noise was defined as standard deviation of the measured HU of the background.
Visual Analysis
Two board-certified neuroradiologists from our institution with more than 10 years of experience in CTA of the craniocervical vessels (S.L., 11 years; M.K., 12 years) assessed overall image quality of all 60 CTA datasets obtained with one of the three body weight-tailored protocols and of the 60 CTA datasets acquired with the standard protocol. Assessment was carried out on the Weight-Tailored Contrast for Craniocervical CTA
MIP reconstructions. Both readers were blinded to the contrast injection protocol used. Visual image quality was rated using a 5-point visual analog scale with the following scores: 0 = unacceptable (contrast enhancement insufficient to make a radiologic diagnosis); 1 = poor (contrast enhancement just about acceptable to make a radiologic diagnosis); 2 = fair (contrast enhancement sufficient for radiologic diagnosis, but image quality unsatisfactory); 3 = good (contrast enhancement adequate and image quality satisfactory); 4 = optimal (excellent contrast enhancement and image quality).
Statistical Analysis
Results for ME, SNR, and CNR were expressed as medians (25th percentile–75th percentile). Multiple comparisons of ME, SNR, and CNR of the different protocol groups were performed by using the Kruskal-Wallis test. If the overall differences were statistically significant, post-hoc analysis was carried out by means of the Mann-Whitney U-test. Interim analysis by Bonferroni-Holm adjustment was conducted to counteract the problem of multiple comparisons. Normal weight (BMI#25) and overweight (BMI.25) subgroup analysis for ME of the MCA for groups and controls was performed by using the two-tailed Student t-test. Spearman’s rank correlation coefficient (r) was used to investigate the relationships between patient body weight as well as BMI and ME in the MCA in each group. The visual scores of the different protocol groups were also compared by Kruskal-Wallis test. If there was a statistically significant difference among all groups, pairwise comparisons were performed using the Mann-Whitney U-test. Interrater reliability with regard to visual analysis was assessed using kappa statistics [18]. Analyses were performed using SPSS (version 20.0; SPSS Chicago, Illinois, USA). A p-value of p,0.05 was considered statistically significant.
Results
Patient Population
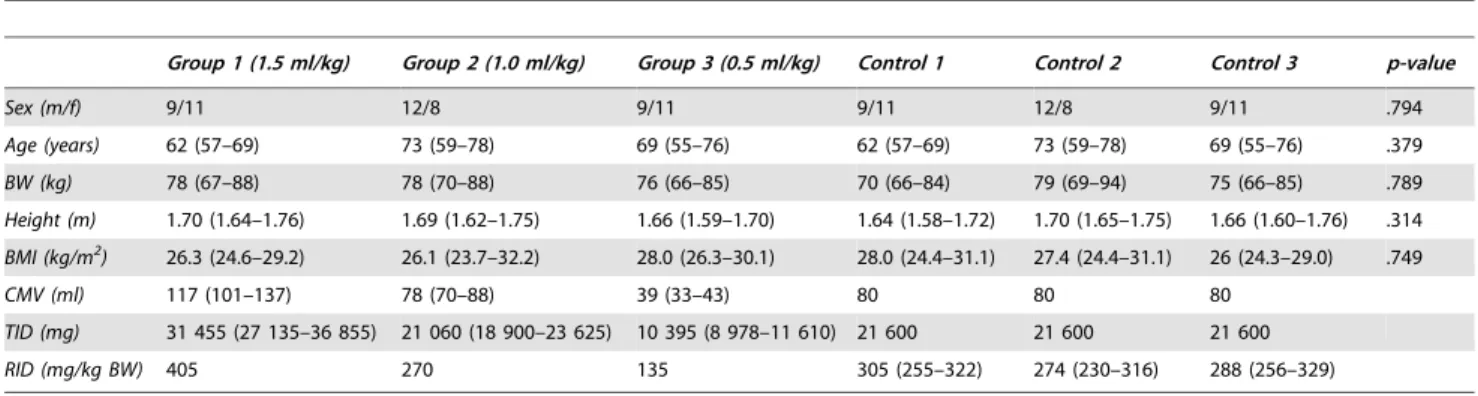
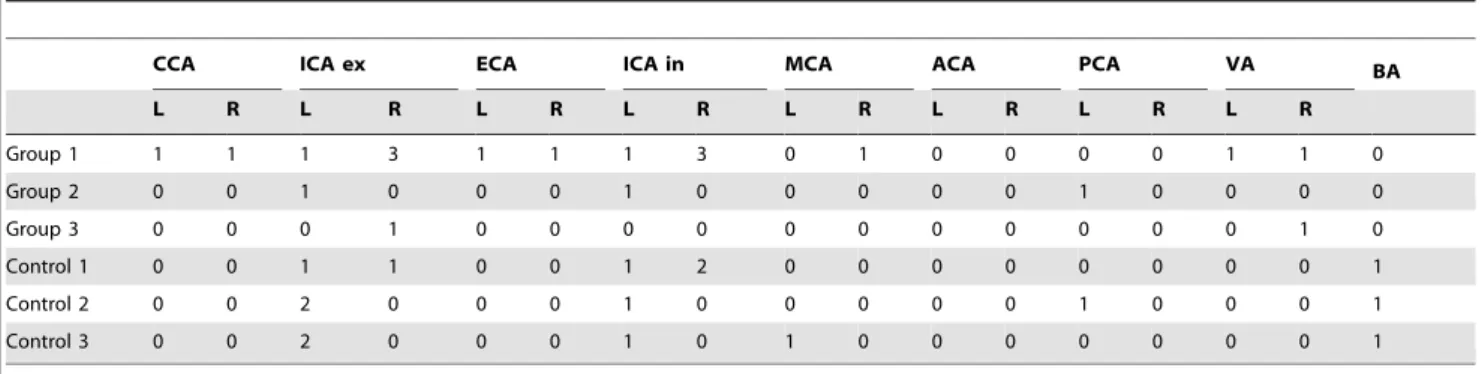
Demographic data of the patient population and data on administered CM volumes and doses are provided in Table 1. The results for high-grade arterial stenosis and vascular occlusion are presented in Table 2. Data on congenital variations in the circle of Willis are summarized in Table 3.
Quantitative Assessment
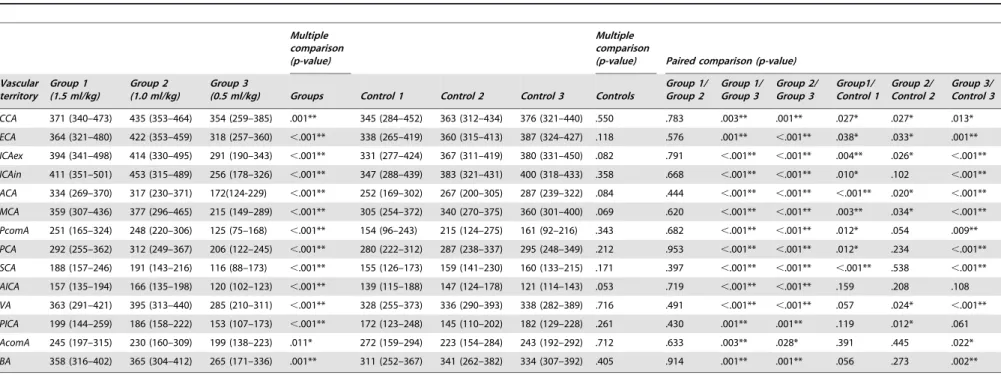
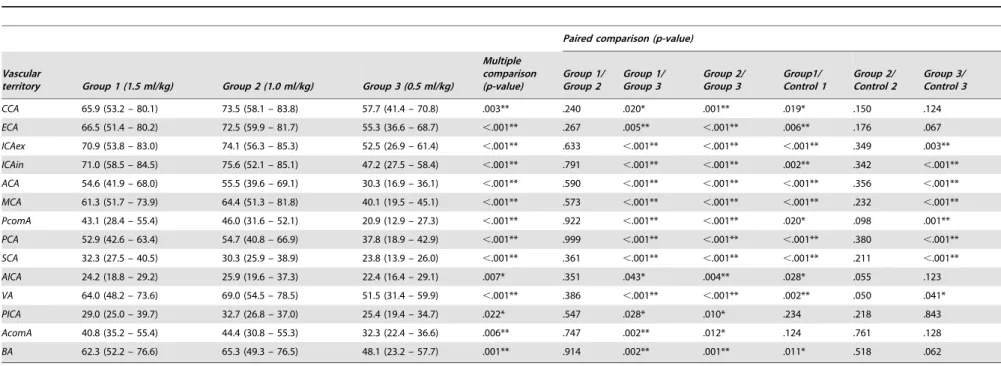
Tables 4, 5 and 6 present the results of quantitative analysis for ME, SNR, and CNR by craniocervical vascular territory and
contrast protocol group including p-values for multiple and paired comparisons. The multiple comparison test revealed statistically significant differences between the three body weight-tailored groups for ME, SNR, and CNR in all vascular territories (Tables 4, 5 6). In the control population, there were no statistically significant differences between the groups (Table 4).
Paired Comparison of Body Weight-Tailored Groups Comparison of ME, SNR, and CNR between group 1 (1.5 ml/ kg) and group 2 (1.0 ml/kg) revealed no significant differences in any vascular territories (Tables 4, 5 and 6). Comparison of group 1 (1.5 ml/kg) and group 3 (0.5 ml/kg) showed statistically higher ME, SNR, and CNR in all vascular territories for group 1 (1.5 ml/ kg). The paired comparison of group 2 (1.0 ml/kg) and group 3 (0.5 ml/kg) yielded similar results with significantly higher ME, SNR, and CNR in group 2 (1.0 ml/kg).
Paired Comparison of Body Weight-Tailored Groups versus Standard Protocol
Paired comparison of the weight-tailored groups versus the standard protocol regarding ME, SNR and CNR yielded heterogeneous results. Group 1 (1.5 ml/kg) had higher values compared to the standard protocol for the vascular territories of the anterior circulation (CCA, ECA, ICAex, ICAin, ACA, MCA, not AcomA) and the upper vessels of the posterior circulation (PCA, PcomA, SCA) regarding ME, SNR, and CNR (Tables 4, 5 and 6). For the remaining vessels of the posterior circulation, there was no statistically significant difference in ME, but SNR and CNR for AICA, VA and BA were also higher for group 1 (1.5 ml/ kg) (Tables 5 and 6). Group 2 (1.0 ml/kg) had higher ME in the CCA, ECA, ICAex, ACA, MCA, VA, and PICA (Table 4), but SNR and CNR were not higher (Tables 5 and 6). Regarding group 3 (0.5 ml/kg), the standard protocol yielded better results for ME in all vascular territories except AICA and PICA (Table 4), whereas SNR and CNR failed to reach significance for CCA, ECA, AICA, PICA, AcomA, and BA (Tables 5 and 6).
Relationship between Patient Body Weight/BMI and ME in the MCA
Figure 1 presents scatterplots of the relationship between patient body weight as well as BMI and ME in the MCA for the controls and the body weight-tailored groups. For the control groups, Spearman’s rank correlation coefficient (r) between body weight and ME of the MCA was r =20.544 (p = 0.013) for control 1, r =20.597 (p = 0.005) for control 2, and r =20.542 (p = 0.014) for
Table 1.Patient demographics in the three study groups and in the three control groups.
Group 1 (1.5 ml/kg) Group 2 (1.0 ml/kg) Group 3 (0.5 ml/kg) Control 1 Control 2 Control 3 p-value
Sex (m/f) 9/11 12/8 9/11 9/11 12/8 9/11 .794
Age (years) 62 (57–69) 73 (59–78) 69 (55–76) 62 (57–69) 73 (59–78) 69 (55–76) .379
BW (kg) 78 (67–88) 78 (70–88) 76 (66–85) 70 (66–84) 79 (69–94) 75 (66–85) .789
Height (m) 1.70 (1.64–1.76) 1.69 (1.62–1.75) 1.66 (1.59–1.70) 1.64 (1.58–1.72) 1.70 (1.65–1.75) 1.66 (1.60–1.76) .314
BMI (kg/m2) 26.3 (24.6–29.2) 26.1 (23.7–32.2) 28.0 (26.3–30.1) 28.0 (24.4–31.1) 27.4 (24.4–31.1) 26 (24.3–29.0) .749
CMV (ml) 117 (101–137) 78 (70–88) 39 (33–43) 80 80 80
TID (mg) 31 455 (27 135–36 855) 21 060 (18 900–23 625) 10 395 (8 978–11 610) 21 600 21 600 21 600
RID (mg/kg BW) 405 270 135 305 (255–322) 274 (230–316) 288 (256–329)
Data on age, BW, height, BMI, CMV, TID, and RID are presented as medians (25th percentile–75th percentile); BW – body weight; BMI – body mass index; CMV – contrast medium volume; TID – total iodine dose; RID – relative iodine dose. Overall p-value was calculated by Kruskal-Wallis test.
doi:10.1371/journal.pone.0088867.t001
Weight-Tailored Contrast for Craniocervical CTA
control 3, indicating moderate statistically significant inverse correlation in all three controls. Values for the correlation of BMI and ME in the control groups were comparable with r =20.358 (p = 0.121) for control 1, r =20.424 (p = 0.062) for control 2, and r =20.280 (p = 0.232) for control 3. For the body weight-tailored groups, Spearman’s rank correlation coefficient (r) between body weight and ME of the MCA was r =20.310 (p = 0.184) for group 1 (1.5 ml/kg), r = 0.025 (p = 0.917) for group 2 (1.0 ml/kg), and r = 0.142 (p = 0.550) for group 3 (0.5 ml/kg), indicating a weak inverse correlation for group 1 (1.5 ml/kg) and a very weak direct correlation for group 2 (1.0 ml/kg) and group 3 (0.5 ml/kg) with no statistical significance for any of the three groups. Similar values were found for the correlation of BMI and ME in the body weight-tailored groups with r =20.144 (p = 0.545) for group 1 (1.5 ml/kg), r = 0.153 (p = 0.518) for group 2 (1.0 ml/ kg) and r = 0.021 (p = 0.930) for group 3 (0.5 ml/kg).
BMI#25 and BMI.25 Subgroup Analysis for ME of the MCA
Figure 2 illustrates ME in the MCA for groups and controls subdivided by BMI into a normal weight group (BMI#25) and an overweight group (BMI.25). The higher ME in the MCA for group 1 (1.5 ml/kg) and group 2 (1.0 ml/kg) compared with the standard protocol was not statistically significant for patients with normal body weight (Fig. 2 A, B; p = 0.132/p = 0.403). In contrast, overweight patients in both groups had statistically significant higher ME compared to the standard protocol (Fig. 2 A, B; p =,0.001/p = 0.008). Comparison of the ME in the overweight subgroups of group 1 (1.5 ml/kg) and group 2 (1.0 ml/kg) yielded
no statistically significant difference (Fig. 2 D; p = 0.673). The lower ME in the MCA in group 3 (0.5 ml/kg) compared with control 3 was statistically significant for both subgroups (Fig. 2 C; p = 0.019/p = 0.002).
Qualitative Visual Assessment
Figure 3 illustrates the difference in image quality between group 2 (1.0 ml/kg) and group 3 (0.5 ml/kg), presenting an example of the reconstructions used for visual assessment. Table 7 presents the results of visual assessment of overall image quality for each of the two readers. Interrater reliability was substantial with k= 0.68, k= 0.66, and k= 0.71 in groups 1 (1.5 ml/kg), 2 (1.0 ml/kg), and 3 (0.5 ml/kg), respectively, and moderate to substantial withk= 0.55,k= 0.58, and k= 0.75 in controls 1, 2, and 3, respectively. For the two raters, overall differences between the three groups were statistically significant with p = 0.002 and p = 0.005, respectively. Paired comparison of image quality in the three groups revealed no statistically significant differences between group 1 (1.5 ml/kg) and group 2 (1.0 ml/kg) for either rater (p = 0.513/p = 0.518) but considerable differences between group 2 (1.0 ml/kg) and group 3 (0.5 ml/kg) (p = 0.001/p = 0.003) and group 1 (1.5 ml/kg) and group 3 (0.5 ml/kg) (p = 0.006/ p = 0.01) for both raters. Paired comparisons of image quality in groups and controls showed no statistically significant differences between group 2 (1.0 ml/kg) and control 2 for either rater (p = 0.221/p = 0.383). For group 1 (1.5 ml/kg) versus control 1, rater 1 found significant differences in image quality (p = 0.01) but rater 2 did not (p = 0.512). The situation was reversed for group 3 (0.5 ml/kg) versus control 3 with significant differences in image Table 2.Vascular occlusions and high-grade vascular stenoses ($70% NASCET).
CCA ICA ex ECA ICA in MCA ACA PCA VA BA
L R L R L R L R L R L R L R L R
Group 1 1 1 1 3 1 1 1 3 0 1 0 0 0 0 1 1 0
Group 2 0 0 1 0 0 0 1 0 0 0 0 0 1 0 0 0 0
Group 3 0 0 0 1 0 0 0 0 0 0 0 0 0 0 0 1 0
Control 1 0 0 1 1 0 0 1 2 0 0 0 0 0 0 0 0 1
Control 2 0 0 2 0 0 0 1 0 0 0 0 0 1 0 0 0 1
Control 3 0 0 2 0 0 0 1 0 1 0 0 0 0 0 0 0 1
Data are given as total numbers of patients per group with vessel occlusion or high-grade vessel stenosis. A high-grade stenosis was defined as$70% luminal narrowing according to the NASCET classification. Data are subdivided by side of location of stenosis or occlusion. L – left side, R – right side.
doi:10.1371/journal.pone.0088867.t002
Table 3.Congenital arterial variants.
A1-segment AComA PComA SCA AICA PICA VA
L R L R L R L R L R L R
Group 1 1 2 0 7 5 0 0 4 3 0 0 1 0
Group 2 0 1 0 5 7 0 0 2 3 2 1 0 0
Group 3 2 0 4 7 9 1 1 8 9 3 4 0 0
Control 1 0 2 6 10 6 0 0 6 8 2 3 0 1
Control 2 1 2 5 9 4 0 0 9 9 5 6 0 0
Control 3 0 0 2 8 7 0 0 5 2 2 1 0 0
Data are given as total number of patients per group with arterial aplasia or marked hypoplasia. Data are subdivided by side of location of aplasia/hypoplasia. L – left side, R – right side.
doi:10.1371/journal.pone.0088867.t003
Weight-Tailored Contrast for Craniocervical CTA
Table 4.Maximum enhancement (ME) in HU of the craniocervical vessels in body weight-tailored groups and controls.
Multiple comparison (p-value)
Multiple comparison
(p-value) Paired comparison (p-value)
Vascular territory
Group 1 (1.5 ml/kg)
Group 2 (1.0 ml/kg)
Group 3
(0.5 ml/kg) Groups Control 1 Control 2 Control 3 Controls
Group 1/ Group 2
Group 1/ Group 3
Group 2/ Group 3
Group1/ Control 1
Group 2/ Control 2
Group 3/ Control 3
CCA 371 (340–473) 435 (353–464) 354 (259–385) .001** 345 (284–452) 363 (312–434) 376 (321–440) .550 .783 .003** .001** .027* .027* .013*
ECA 364 (321–480) 422 (353–459) 318 (257–360) ,.001** 338 (265–419) 360 (315–413) 387 (324–427) .118 .576 .001** ,.001** .038* .033* .001**
ICAex 394 (341–498) 414 (330–495) 291 (190–343) ,.001** 331 (277–424) 367 (311–419) 380 (331–450) .082 .791 ,.001** ,.001** .004** .026* ,.001**
ICAin 411 (351–501) 453 (315–489) 256 (178–326) ,.001** 347 (288–439) 383 (321–431) 400 (318–433) .358 .668 ,.001** ,.001** .010* .102 ,.001**
ACA 334 (269–370) 317 (230–371) 172(124-229) ,.001** 252 (169–302) 267 (200–305) 287 (239–322) .084 .444 ,.001** ,.001** ,.001** .020* ,.001**
MCA 359 (307–436) 377 (296–465) 215 (149–289) ,.001** 305 (254–372) 340 (270–375) 360 (301–400) .069 .620 ,.001** ,.001** .003** .034* ,.001**
PcomA 251 (165–324) 248 (220–306) 125 (75–168) ,.001** 154 (96–243) 215 (124–275) 161 (92–216) .343 .682 ,.001** ,.001** .012* .054 .009**
PCA 292 (255–362) 312 (249–367) 206 (122–245) ,.001** 280 (222–312) 287 (238–337) 295 (248–349) .212 .953 ,.001** ,.001** .012* .234 ,.001**
SCA 188 (157–246) 191 (143–216) 116 (88–173) ,.001** 155 (126–173) 159 (141–230) 160 (133–215) .171 .397 ,.001** ,.001** ,.001** .538 ,.001**
AICA 157 (135–194) 166 (135–198) 120 (102–123) ,.001** 139 (115–188) 147 (124–178) 121 (114–143) .053 .719 ,.001** ,.001** .159 .208 .108
VA 363 (291–421) 395 (313–440) 285 (210–311) ,.001** 328 (255–373) 336 (290–393) 338 (282–389) .716 .491 ,.001** ,.001** .057 .024* ,.001**
PICA 199 (144–259) 186 (158–222) 153 (107–173) ,.001** 172 (123–248) 145 (110–202) 182 (129–228) .261 .430 .001** .001** .119 .012* .061
AcomA 245 (197–315) 230 (160–309) 199 (138–223) .011* 272 (159–294) 223 (154–284) 243 (192–292) .712 .633 .003** .028* .391 .445 .022*
BA 358 (316–402) 365 (304–412) 265 (171–336) .001** 311 (252–367) 341 (262–382) 334 (307–392) .405 .914 .001** .001** .056 .273 .002**
ME data are presented as medians (25th percentile–75th percentile). Overall p-value was calculated by Kruskal-Wallis test. Pairwise comparison was performed by means of Mann-Whitney U-test with interim analyses by Bonferroni-Holm adjustment. *A p-value,0.05 was considered statistically significant. ** p,0.01.
doi:10.1371/journal.pone.0088867.t004
Weight-Tai
lored
Contrast
for
Craniocervical
CTA
PLOS
ONE
|
www.ploson
e.org
5
February
2014
|
Volume
9
|
Issue
2
|
Table 5.Calculated SNR values in the groups receiving contrast medium tailored to patient body weight.
Paired comparison (p-value)
Vascular
territory Group 1 (1.5 ml/kg) Group 2 (1.0 ml/kg) Group 3 (0.5 ml/kg)
Multiple comparison (p-value)
Group 1/ Group 2
Group 1/ Group 3
Group 2/ Group 3
Group1/ Control 1
Group 2/ Control 2
Group 3/ Control 3
CCA 65.9 (53.2 – 80.1) 73.5 (58.1 – 83.8) 57.7 (41.4 – 70.8) .003** .240 .020* .001** .019* .150 .124
ECA 66.5 (51.4 – 80.2) 72.5 (59.9 – 81.7) 55.3 (36.6 – 68.7) ,.001** .267 .005** ,.001** .006** .176 .067
ICAex 70.9 (53.8 – 83.0) 74.1 (56.3 – 85.3) 52.5 (26.9 – 61.4) ,.001** .633 ,.001** ,.001** ,.001** .349 .003**
ICAin 71.0 (58.5 – 84.5) 75.6 (52.1 – 85.1) 47.2 (27.5 – 58.4) ,.001** .791 ,.001** ,.001** .002** .342 ,.001**
ACA 54.6 (41.9 – 68.0) 55.5 (39.6 – 69.1) 30.3 (16.9 – 36.1) ,.001** .590 ,.001** ,.001** ,.001** .356 ,.001**
MCA 61.3 (51.7 – 73.9) 64.4 (51.3 – 81.8) 40.1 (19.5 – 45.1) ,.001** .573 ,.001** ,.001** ,.001** .232 ,.001**
PcomA 43.1 (28.4 – 55.4) 46.0 (31.6 – 52.1) 20.9 (12.9 – 27.3) ,.001** .922 ,.001** ,.001** .020* .098 .001**
PCA 52.9 (42.6 – 63.4) 54.7 (40.8 – 66.9) 37.8 (18.9 – 42.9) ,.001** .999 ,.001** ,.001** ,.001** .380 ,.001**
SCA 32.3 (27.5 – 40.5) 30.3 (25.9 – 38.9) 23.8 (13.9 – 26.0) ,.001** .361 ,.001** ,.001** ,.001** .211 ,.001**
AICA 24.2 (18.8 – 29.2) 25.9 (19.6 – 37.3) 22.4 (16.4 – 29.1) .007* .351 .043* .004** .028* .055 .123
VA 64.0 (48.2 – 73.6) 69.0 (54.5 – 78.5) 51.5 (31.4 – 59.9) ,.001** .386 ,.001** ,.001** .002** .050 .041*
PICA 29.0 (25.0 – 39.7) 32.7 (26.8 – 37.0) 25.4 (19.4 – 34.7) .022* .547 .028* .010* .234 .218 .843
AcomA 40.8 (35.2 – 55.4) 44.4 (30.8 – 55.3) 32.3 (22.4 – 36.6) .006** .747 .002** .012* .124 .761 .128
BA 62.3 (52.2 – 76.6) 65.3 (49.3 – 76.5) 48.1 (23.2 – 57.7) .001** .914 .002** .001** .011* .518 .062
SNR data are presented as medians (25th percentile–75th percentile). Overall p-value was calculated by Kruskal-Wallis test. Pairwise comparison was performed by means of Mann-Whitney U-test with interim analyses by Bonferroni-Holm adjustment. *A p-value,0.05 was considered statistically significant. ** p,0.01.
doi:10.1371/journal.pone.0088867.t005
Weight-Tai
lored
Contrast
for
Craniocervical
CTA
PLOS
ONE
|
www.ploson
e.org
6
February
2014
|
Volume
9
|
Issue
2
|
Table 6.Calculated CNR values in the groups receiving contrast medium tailored to patient body weight.
Paired comparison (p-value)
Vascular
territory Group 1 (1.5 ml/kg) Group 2 (1.0 ml/kg) Group 3 (0.5 ml/kg)
Multiple comparison (p-value)
Group 1/ Group 2
Group 1/ Group 3
Group 2/ Group 3
Group1/ Control 1
Group 2/ Control 2
Group 3/ Control 3
CCA 59.0 (46.0 – 73.8) 65.9 (52.9 – 75.6) 50.7 (36.4 – 63.6) .003** .269 .018* .001** .019* .173 .098
ECA 59.7 (45.6 – 73.8) 65.2 (53.9 – 73.9) 48.4 (31.2 – 60.3) ,.001** .320 .004** ,.001** .006** .254 .051
ICAex 65.0 (48.1 – 75.9) 66.3 (50.3 – 77.3) 47.0 (22.5 – 52. 6) ,.001** .675 ,.001** ,.001** ,.001** .367 .001**
ICAin 64.4 (50.9 – 77.7) 68.5 (46.1 – 78.0) 39.3 (21.7 – 51.3) ,.001** .787 ,.001** ,.001** .002** .401 ,.001**
ACA 47.3 (35.8 – 60.5) 48.0 (32.9 – 61.2) 24.5 (11.2 – 32.6) ,.001** .560 ,.001** ,.001** ,.001** .333 ,.001**
MCA 55.4 (46.2 – 67.1) 58.0 (45.9 – 74.6) 33.1 (13.7 – 39.6) ,.001** .586 ,.001** ,.001** ,.001** .274 ,.001**
PcomA 35.7 (22.8 – 49.2) 38.9 (26.0 – 44.6) 14.6 (6.7 – 20.1) ,.001** .922 ,.001** ,.001** .018* .067 .001**
PCA 46.3 (36.3 – 57.7) 47.8 (34.7 – 59.2) 31.2 (13.3 – 35.7) ,.001** .961 ,.001** ,.001** ,.001** .383 ,.001**
SCA 26.3 (20.5 – 34.8) 22.7 (19.5 – 31.7) 15.6 (9.3 – 19.4) ,.001** .341 ,.001** ,.001** ,.001** .202 ,.001**
AICA 18.2 (12.6 – 23.0) 19.4 (13.3 – 29.8) 12.1 (8.2 – 19.0) .014* .390 .037* .004** .039* .059 .076
VA 58.3 (41.2 – 66.6) 62.3 (48.8 – 70.7) 45.0 (26.4 – 52.8) ,.001** .427 ,.001** ,.001** .003** .061 .033*
PICA 22.8 (18.1 – 33.4) 25.6 (20.1 – 29.5) 18.9 (12.6 – 27.2) .012* .665 .018* .005** .331 .309 .735
AcomA 34.9 (29.5 – 48.0) 36.5 (24.5 – 47.6) 25.2 (16.5 – 30.0) .006** .715 .002** .016* .162 .867 .123
BA 54.8 (45.5 – 70.3) 58.0 (43.1 – 69.0) 42.2 (17.5 – 48.9) .001** .978 .001** .001** .012* .593 .050
CNR data are presented as medians (25th percentile–75th percentile). Overall p-value was calculated by Kruskal-Wallis test. Pairwise comparison was performed by means of Mann-Whitney U-test with interim analyses by Bonferroni-Holm adjustment. *A p-value,0.05 was considered statistically significant. ** p,0.01.
doi:10.1371/journal.pone.0088867.t006
Weight-Tai
lored
Contrast
for
Craniocervical
CTA
PLOS
ONE
|
www.ploson
e.org
7
February
2014
|
Volume
9
|
Issue
2
|
quality for rater 2 (p = 0.038) but not for rater 1 (p = 0.121). However, overall differences between the three controls were not statistically significant with p = 0.142 for rater 1 and p = 0.831 for rater 2.
Discussion
Generally, the degree of arterial enhancement in CTA is determined by injection-related factors such as CM volume, CM
concentration, and injection rate and by patient-related factors such as body weight, cardiac output, and fluid balance [19].
In our study, different CM volumes were tailored to the patients’ body weight, whereas CM concentration and injection rate were constant. We used three dose groups of 1.5 ml/kg, 1.0 ml/kg, and 0.5 ml/kg with a CM concentration of 270 mg iodine/ml and a fixed injection rate of 4 ml/s.
The variability in arterial enhancement resulting from differ-ences in cardiac output can be reduced by administering a test
Figure 1. Correlation of body weight/BMI and ME in the MCA.Scatterplots show relationship between patient body weight (BW) (kg) as well as BMI (kg/m2) and ME of MCA (HU) for the three controls (A, C) and for the three groups (B, D). Lines are regression lines. Spearman’s rank correlation coefficients (r) and p-values are provided in the lower right corner.
doi:10.1371/journal.pone.0088867.g001
Weight-Tailored Contrast for Craniocervical CTA
bolus or using a bolus-tracking system [20–22]. To minimize the effects of cardiac output in the present study, we used a semiautomatic bolus-tracking system and excluded patients assumed to have compromised cardiac output.
Furthermore, vessel stenoses and occlusions can influence the degree of contrast enhancement in downstream vessel territories. Patients undergoing craniocervical CTA often have vessel stenoses or occlusions in the CCA, ICA, MCA, VA, or BA. In our study population, several patients presented with occlusion or stenosis of
Figure 2. Comparison of ME in the MCA between BMI#25 and BMI.25 subgroups.Boxplots compare ME in the MCA in groups and controls (A–C) and between group 1 (1.5 ml/kg) and group 2 (1.0 ml/kg) (D) in normal weight patients (BMI#25) and overweight patients (BMI.25). In boxes, middle horizontal line and upper and lower margins represent median with 25th and 75th percentiles. Upper and lower ends of vertical lines represent upper extremes (75th percentile +1.56[interquartile range]) and lower extremes (25th percentile21.56[interquartile range]), respectively.
doi:10.1371/journal.pone.0088867.g002
Weight-Tailored Contrast for Craniocervical CTA
the carotid artery, vertebral artery, and basilar artery. While these lesions were excluded from evaluation, we nevertheless took measurements in the vessel territories distal to the lesions. The measured values were compared with the ME for the correspond-ing contralateral measurement site. The comparison revealed no statistically significant differences in ME, which is most probably due to good collateralization in chronic stenosis or occlusion [23,24].
An inverse correlation is known to exist between patient body weight and arterial or parenchymal enhancement in thoracic or abdominal CT when a constant dose of CM is used [3,6,11,16,25,26]. Our study illustrates that a moderate inverse
correlation between body weight and BMI and maximum arterial enhancement is also found in craniocervical CTA performed with a standard dose of 80 ml of Visipaque 270H(Fig. 1 A, C).
Compared to the standard protocol with use of 80 ml of Visipaque 270H, two of the three tailored protocols21.0 ml/kg and 1.5 ml/kg - yielded similar or better results with regard to ME, along with excellent or good image quality. Compared with each other, the two higher doses were comparable in terms of ME, SNR, and CNR, whereas both provided significantly better ME, SNR, and CNR as well as image quality than 0.5 ml/kg. However, administration of 1.5 ml/kg mainly improved arterial enhancement of the cervical vessels and circle of Willis, whereas
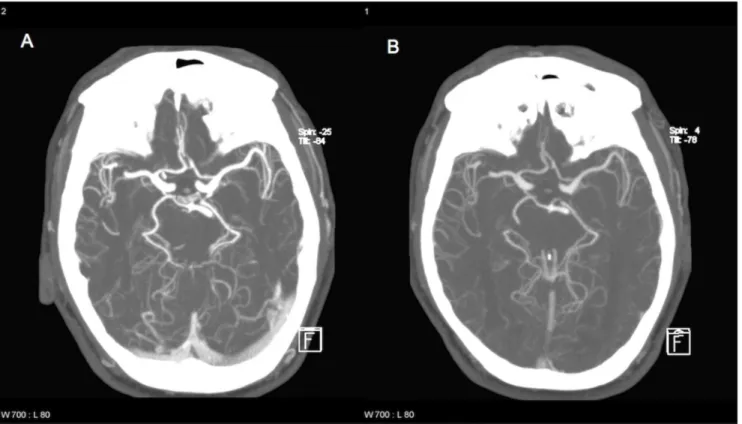
Figure 3. Sample images for comparison of image quality between group 2 and group 3.By chance, a 56-year-old male patient (86 kg) was examined twice during the study period. Both images show thick slab maximum intensity projections (MIP) of corresponding slices. He was examined with 1.0 ml/kg (A, 86 ml CM) and 0.5 ml/kg (B, 43 ml CM). Image A was graded optimal, while image B was graded good by both raters. Arterial enhancement was 318 HU/203 HU for the MCA on the left with 1.0/0.5 ml/kg.
doi:10.1371/journal.pone.0088867.g003
Table 7.Results of visual assessment of overall image quality.
Rater 1 2
Unacceptable Poor Fair Good Optimal Unacceptable Poor Fair Good Optimal
Group 1 0 0 0 8 (40) 12 (60) 0 0 0 7 (35) 13 (65)
Group 2 0 0 0 6 (30) 14 (70) 0 0 1 (5) 7 (35) 12 (60)
Group 3 0 2 (10) 3 (15) 7 (35) 8 (40) 0 2 (10) 3 (15) 9 (45) 6 (30)
Control 1 0 0 6 (30) 9 (45) 5 (25) 0 0 4 (20) 7 (35) 9 (45)
Control 2 0 1 (5) 1 (5) 8 (40) 10 (50) 0 1 (5) 1 (5) 9 (45) 9 (45)
Control 3 0 1 (5) 2 (10) 7 (35) 10 (50) 0 1 (5) 2 (10) 6 (30) 11 (55)
Results are given as total numbers of patients assigned to each quality category. Numbers in brackets are percentages. Data are given by rater and protocol group.
doi:10.1371/journal.pone.0088867.t007
Weight-Tailored Contrast for Craniocervical CTA
significant effects on the posterior circulation were only detectable for SNR and CNR in the VA and BA. The dose of 1.0 ml/kg produced significantly higher ME in the cervical vessels, the ACA, MCA, VA, and PICA, whereas differences to the standard protocol were not significant for SNR and CNR. For the dose of 0.5 ml/kg, ME, SNR, and CNR were mainly inferior to the standard protocol and especially to the body weight-adjusted doses of 1.0 ml/kg and 1.5 ml/kg. This effect might be due to substantial dilution of the small CM bolus in the large and medium-sized cerebral arteries compared to the standard dose and higher weight-adjusted doses. In the small cerebral arteries (AcomA, PICA, and AICA), the difference in ME, SNR and CNR between 0.5 ml/kg and the standard dose is no longer significant. Presumably, the effect of a larger contrast medium bolus is particularly evident in the large cervical and intracranial arteries whereas the bolus dilution in the smaller cerebral arteries is similar in all groups independent of the initial bolus size.
In overweight patients (BMI.25), the body weight-tailored doses of 1.0 ml/kg and 1.5 ml/kg produce significantly higher ME compared to the standard dose, but compared to each other, the highest dose of 1.5 ml/kg does not result in higher ME than the dose of 1.0 ml/kg. In normal weight patients (BMI#25), the tailored doses of 1.0 ml/kg and 1.5 ml/kg yield similar enhance-ment as the standard dose.
Conclusion
Administration of 1.0 ml/kg of CM, corresponding to 270 mg iodine/kg, can be recommended for craniocervical CTA.
In patients weighing less than 80 kg, the dose of 1.0 ml/kg reduces the iodine dose compared to a standard dose of 80 ml, while yielding similar arterial enhancement. A reduced dose of CM has potential benefits: first, the likelihood of CIN decreases, particularly in patients with renal insufficiency [27]. Second, if digital subtraction angiography becomes necessary, e.g., for a neurovascular intervention, immediately after craniocervical CTA, a restriction of the CM dose is favorable for preventing
high loads of CM. Third, a reduced CM volume results in cost savings.
For overweight patients (BMI.25) the body weight-adjusted dose of 1.0 ml/kg improves arterial contrast. A threshold of 150 kg should be considered for tailoring the contrast medium dose to body weight to adhere to the FDA label for Visipaque 270H(maximum total volume of 150 ml for contrast-enhanced CT of head or body)[28].
Study Limitations
Our study has some limitations. First, Kondo et al. and Ho et al. show, for abdominal CT, that if lean body weight or body fat percentage rather than body weight are used to determine the appropriate CM dose, the iodine dose required to achieve sufficient enhancement may be estimated more precisely [29– 31]. Hence, further studies will be necessary to determine the optimal parameter for individually tailored CM administration for craniocervical CTA. Second, patients were consecutively assigned to the protocol groups and not randomized because of ethical concerns regarding the possible nondiagnostic image quality related to a reduced dose. The study was started with the highest dose, which was consecutively reduced but only after verification of image quality before each reduction. Third, contrast enhance-ment was measured not only in cervical and large cerebral arteries but also in the smaller and more variable cerebral arteries, e.g., AcomA, PcomA, PICA, and AICA. On the one hand, measure-ment is technically more demanding in these vascular territories because partial volume effects reduce the reliability of data, and on the other hand, the number of measured values is reduced due to anatomical variations.
Author Contributions
Conceived and designed the experiments: RK SL NH AK SF. Performed the experiments: RK SL MK. Analyzed the data: RK KH. Contributed reagents/materials/analysis tools: SL MK NH SF AK. Wrote the paper: RK SL KH NH.
References
1. Morcos SK, Thomsen HS, Webb JA (1999) Contrast-media-induced nephro-toxicity: a consensus report. Contrast Media Safety Committee, European Society of Urogenital Radiology (ESUR) 9: 1602–1613.
2. Nash K, Hafeez A, Hou S (2002) Hospital-acquired renal insufficiency. Am J Kidney Dis 39: 930–936.
3. Kalra MK, Maher MM, Prasad SR, Hayat MS, Blake MA, et al. (2003) Correlation of patient weight and cross-sectional dimensions with subjective image quality at standard dose abdominal CT. Korean J Radiol 4: 234–238. 4. Arakawa H, Kohno T, Hiki T, Kaji Y (2007) CT Pulmonary Angiography and
CT Venography: Factors Associated with Vessel Enhancement. AJR Am J Roentgenol 189: 156–161.
5. Roggenland D, Peters SA, Lemburg SP, Holland-Letz T, Nicolas V, et al. (2008) CT Angiography in Suspected Pulmonary Embolism: Impact of Patient Characteristics and Different Venous Lines on Vessel Enhancement and Image Quality. AJR Am J Roentgenol 190: 351–359.
6. Schoellnast H (2006) MDCT Angiography of the Pulmonary Arteries: Influence of Body Weight, Body Mass Index, and Scan Length on Arterial Enhancement at Different Iodine Flow Rates. AJR Am J Roentgenol 187: 1074–1078. 7. Arana E, Martı´-Bonmatı´ L, Tobarra E, Sierra C (2009) Cost reduction in
abdominal CT by weight-adjusted dose. Eur J Radiol 70: 507–511. 8. Ichikawa T, Erturk S, Araki T (2006) Multiphasic contrast-enhanced
multi-detector-row CT of liver: Contrast-enhancement theory and practical scan protocol with a combination of fixed injection duration and patients’ body-weight-tailored dose of contrast material. Eur J Radiol 58: 165–176. 9. Yamashita Y, Komohara Y, Takahashi M, Uchida M, Hayabuchi N, et al.
(2000) Abdominal helical CT: evaluation of optimal doses of intravenous contrast material–a prospective randomized study. Radiology 216: 718–723. 10. Yanaga Y, Awai K, Nakayama Y, Nakaura T, Tamura Y, et al. (2007) Pancreas:
Patient Body Weight tailored Contrast Material Injection Protocol versus Fixed Dose Protocol at Dynamic CT. Radiology 245: 475–482.
11. Bae KT, Tao C, Gurel S, Hong C, Zhu F, et al. (2007) Effect of Patient Weight and Scanning Duration on Contrast Enhancement during Pulmonary Multi-detector CT Angiography. Radiology 242: 582–589.
12. Bae KT, Seeck BA, Hildebolt CF, Tao C, Zhu F, et al. (2008) Contrast Enhancement in Cardiovascular MDCT: Effect of Body Weight, Height, Body Surface Area, Body Mass Index, and Obesity. AJR Am J Roentgenol 190: 777– 784.
13. Nakaura T, Awai K, Yauaga Y, Nakayama Y, Oda S, et al. (2008) Contrast injection protocols for coronary computed tomography angiography using a 64-detector scanner: comparison between patient weight-adjusted- and fixed iodine-dose protocols. Invest Radiol 43: 512–519.
14. Seifarth H, Puesken M, Kalafut JF, Wienbeck S, Wessling J, et al. (2009) Introduction of an individually optimized protocol for the injection of contrast medium for coronary CT angiography. Eur Radiol 19: 2373–2382. 15. Tatsugami F, Matsuki M, Inada Y, Kanazawa S, Nakai G, et al. (2010)
Feasibility of low-volume injections of contrast material with a body weight-adapted iodine-dose protocol in 320-detector row coronary CT angiography. Acad Radiol 17: 207–211.
16. Awai K, Hiraishi K, Hori S (2004) Effect of Contrast Material Injection Duration and Rate on Aortic Peak Time and Peak Enhancement at Dynamic CT Involving Injection Protocol with Dose Tailored to Patient Weight. Radiology 230: 142–150.
17. Fox AJ (1993) How to Measure Carotid Stenosis. Radiology 186: 316–318. 18. Byrt T (1996) How good is that agreement? Epidemiology 7: 561.
19. Herman S (2004) Computed tomography contrast enhancement principles and the use of high-concentration contrast media. J Comput Assist Tomogr 28: 7–11. 20. Fleischmann DD, Rubin GDG, Bankier AAA, Hittmair KK (2000) Improved uniformity of aortic enhancement with customized contrast medium injection protocols at CT angiography. Radiology 214: 363–371.
21. Shimizu T, Misaki T, Yamamoto K, Sueyoshi K, Narabayashi I (2000) Helical CT of the liver with computer-assisted bolus-tracking technology: scan delay of Weight-Tailored Contrast for Craniocervical CTA
arterial phase scanning and effect of flow rates. J Comput Assist Tomogr 24: 219–223.
22. Sandstede JJ, Tschammler A, Beer M, Vogelsang C, Wittenberg G, et al. (2001) Optimization of automatic bolus tracking for timing of the arterial phase of helical liver CT. Eur Radiol 11: 1396–1400.
23. Tan I, Demchuk AM, Hopyan J, Zhang L, Gladstone D, et al. (2009) CT Angiography Clot Burden Score and Collateral Score: Correlation with Clinical and Radiologic Outcomes in Acute Middle Cerebral Artery Infarct. AJNR Am J Neuroradiol 30: 525–531.
24. Angermaier A, Langner S, Kirsch M, Kessler C, Hosten N, et al. (2011) CT-angiographic collateralization predicts final infarct volume after intra-arterial thrombolysis for acute anterior circulation ischemic stroke. Cerebrovasc Dis 31: 177–184.
25. Kormano M, Partanen K, Soimakallio S, Kivima¨ki T (1983) Dynamic contrast enhancement of the upper abdomen: effect of contrast medium and body weight. Invest Radiol 18: 364–367.
26. Bae KT, Heiken JP, Brink JA (1998) Aortic and hepatic contrast medium enhancement at CT. Part I. Prediction with a computer model. Radiology 207: 647–655.
27. Katzberg RW, Barrett BJ (2007) Risk of Iodinated Contrast Material-induced Nephropathy with Intravenous Administration. Radiology 243: 622–628. 28. U.S. National Library of Medicine, National Institutes of Health (2009)
VISIPAQUE (iodixanol) injection, solution [GE Healthcare Inc.] Available: http://dailymed.nlm.nih.gov/dailymed/lookup.cfm?setid = 2d964c13-88ad-43be-88d4-a3a7ea4d5b5e. Accessed 2013 Sept 29.
29. Ho LM, Nelson RC, DeLong DM (2007) Determining Contrast Medium Dose and Rate on Basis of Lean Body Weight: Does This Strategy Improve Patient-to-Patient Uniformity of Hepatic Enhancement during Multi-Detector Row CT? Radiology 243: 431–437.
30. Kondo H, Kanematsu M, Goshima S, Tomita Y, Kim MJ, et al. (2010) Body size indexes for optimizing iodine dose for aortic and hepatic enhancement at multidetector CT: comparison of total body weight, lean body weight, and blood volume. Radiology 254: 163–169.
31. Kondo H, Kanematsu M, Goshima S, Tomita Y, Miyoshi T, et al. (2008) Abdominal Multidetector CT in Patients with Varying Body Fat Percentages: Estimation of Optimal Contrast Material Dose. Radiology 249: 872–877.
Weight-Tailored Contrast for Craniocervical CTA