R
EVIEWA
RTICLE Revista Brasileira de FisioterapiaRevision of posturography based on force
plate for balance evaluation
Revisão sobre posturografia baseada em plataforma de força para avaliação do
equilíbrio
Marcos Duarte1, Sandra M. S. F. Freitas2
Abstract
Background: The maintenance of balance and body orientation in humans is guaranteed by the adequate functioning of the postural control system. The investigation of this control has awakened the interest of professionals from several fields such as Physical Therapy, Physical Education, Engineering, Physics, Medicine, Psychology, and others. Objectives: The purposes of this study are to revise the methods of data analysis used to investigate the postural control in human beings and to demonstrate the computational algorithms of the main measures used in the postural control evaluation. Conclusion: The experimental procedures and measures used in postural control evaluation presented in this review can help in the standardization of postural control investigation.
Key words: motor control; biomechanics; force plate; posturography; balance; center of pressure.
Resumo
Contextualização: A manutenção do equilíbrio e da orientação corporal em humanos é garantida pelo adequado funcionamento do sistema de controle postural. A investigação desse controle tem despertado interesse em profissionais de diversas áreas, tais como, Fisioterapia, Educação Física, Engenharia, Física, Medicina, Psicologia, entre outras. Objetivos: Revisar os métodos de análise experimental de dados utilizados para investigação do controle postural em seres humanos e demonstrar o cálculo e rotinas de programação das principais medidas utilizadas na avaliação desse controle. Conclusão: Os procedimentos experimentais e as medidas utilizadas na avaliação do controle postural apresentados nesta revisão poderão auxiliar na padronização da investigação do controle postural.
Palavras-chave: controle motor; biomecânica; plataforma de força; posturografia; equilíbrio; centro de pressão.
Received: 03/03/2010 – Revised: 08/04/2010 – Accepted: 13/04/2010
1 Graduate Program in Neurosciences and Behavior, School of Physical Education and Sports, Universidade de São Paulo (USP-SP), São Paulo (SP), Brazil 2 Graduate Program in Physical Therapy, Universidade Cidade de São Paulo (UNICID), São Paulo (SP), Brazil
Correspondence to: Marcos Duarte, Escola de Educação Física e Esporte, Universidade de São Paulo, Av. Prof. Mello de Moraes, CEP 05508-030, São Paulo (SP), Brazil, e-mail: [email protected]
Introduction
he maintenance of balance and body orientation in the standing position is essential for the performance of the activities of daily life and the practice of physical and sport activities. he investigation concerning the mechanisms of balance and body orientation control has awakened the interest of professionals in several ields, including Physical herapy, Physical Education, Engineering, Physics, Medicine, and Psychology, among others. hese professionals have used diverse techniques of measure-ment and assessmeasure-ment that often generate diferent results. For example, studies concerning the accuracy of the measurements of postural control diverge about the number of repetitions that should be assessed. Lafond et al.1 observed that two trials were enough to obtain reliable measures of postural stability, while Corriveau et al.2 suggested that at least four repetitions should be assessed. his discrepancy regarding the number of trials sug-gested by the authors may be related to the diferent variables measured during the evaluations (center of pressure velocity and diference between center of pressure [CP] and center of mass [CM], respectively investigated by the authors). For this reason, it is important to standardize the methods for analysis of pos-tural control. In this context, one of the purposes of the present study is to review concepts and methods of assessment and data analysis used in the investigation of postural control in human beings. In addition, we will present methods used to calculate the main measures employed in the assessment of postural con-trol using computational algorithms.
Postural control
Posture can be understood as the coniguration of the body joints, that is, the set of angles that express the relative disposi-tion among the segments of a body3. Considering this, an ini-nite number of postures is adopted by human beings during the activities of daily living, such as walking, reaching an object with the hands, or even quietly standing. Even when standing still, the body sways. In this case, the terms static standing posture or stand still, indicating the quiet standing posture, al-though frequently used, are technically inaccurate. he expres-sion semi-static erect posture would be more appropriate.
For each new posture adopted by human beings, there are necessary neuromuscular responses to maintain body bal-ance. he maintenance of body balance is a responsibility of the postural control system, which is a concept used to refer to the functions of the nervous, sensory, and motor systems. he sensory system provides information regarding the position of body segments in relation to other segments and to the envi-ronment. he motor system is responsible for the correct and
adequate activation of the muscles to perform movements. he central nervous system integrates the information provided by the sensory system, and then sends nervous impulses to the muscles, which generate neuromuscular responses.
he neuromuscular responses are necessary to guarantee, for example, that in the erect posture with the feet immobile, the vertical projection of the body’s center of gravity (CG) remains within the base of support (polygon delimited by the lateral part of the feet), providing stability and allowing the execution of di-verse movements with the upper segments of the body. he CG (or CM), in simple terms, is deined as the point of application of the resultant gravitational force on the body4,5. A concept as-sociated with the base of support is the limit of stability, which expresses the proportion of this base of support that the sub-ject is able to use remaining stable. In other words, the limits of stability express the functional base of support of an individual. For example, during the aging process, the base of support is not modiied, but the limits of stability reduce expressively6. Later in this text, some examples of these concepts will be shown for healthy adults. he passive stifness of the musculotendinous structure of the human body stands out when maintaining quiet erect posture (as still as possible), either for the muscle completely relaxed or with muscle tone. Such passive stifness acts similar to an “elastic” opposed to the torque of gravitational force, which has the tendency to cause a forward fall of the body. Although the estimative of the contribution of the restoring torque due to the passive stifness varies widely in the literature, it is estimated that this torque ranges about 65% to 90% from the magnitude of the gravitational torque7,8. herefore, more than half of the torque responsible for maintaining our erect posture would be generated by a purely passive component, independent of the direct participation of the nervous system.
Mechanically, body balance conditions depend on the forces and torques applied on it. A body is in mechanical equilibrium when the sum of all the forces (F) and torques (M) that act on it equal to zero (∑F=0 and ∑M=0). he forces acting on the body can be classiied as external and internal forces. he most common external forces that act on the human body are the gravitational force over the whole body and the ground reaction force, which, during erect posture, acts on the feet. he internal forces can be physiological disturbances ( for example, heartbeat and breath-ing) or perturbations created by the activation of the muscles necessary for the maintenance of posture and the performance of the body’s own movements. All these forces accelerate (when transmitted to the environment) continuously the human body in all the directions around its CG. herefore, from the mechanical point of view, the human body is never in a condition of perfect equilibrium, because the forces acting on it are only temporarily null. hus, it is possible to state that the human body is constantly unbalanced, in an incessant search for balance. Another important
aspect is that this balance (or the attempt to reach it) in the erect posture is unstable due to the perturbations and, if no force acts to null the ef ect of these perturbations, the body will not return to its initial position; then, depending on the intensity of the perturba-tion, a fall may occur. Under normal conditions in the quiet erect posture, the forces and torques are very small, resulting in small body sways. In a healthy adult, they are almost imperceptible. It is common to denominate this condition, in an approximate form, as a balance condition and to relate the task of postural control to balance control.
h e most common way to study postural control is by assess-ing the behavior (especially the sway) of the body durassess-ing quiet erect posture. h e assessment may be both qualitative, through observation, and quantitative, with the support of measuring instruments. In the present review, only the quantitative as-sessment of body sway will be discussed. h e technique used to measure body sway or an associated variable is posturography. Although posturography has been widely used in the laboratory environment in studies about postural control, it is not restricted to them. Physical therapy and sports facilities have been using equipment to quantitatively measure body sways during quiet erect posture or during the performance of dif erent tasks in the standing position. h is fact necessitates a revision of basic con-cepts of posturography, as will be described below.
Posturography
Posturography is commonly divided into static, when the quiet erect posture of the individual is studied, and dynamic, when the response to a disturbance applied on the individual is studied. h e most common posturographic measure used in the assessment of postural control is the CP. h e CP is the point of application of the resultant from the vertical force’s action on the support’s surface. h e equipment most often used to evalu-ate the CP is the force plevalu-ate.
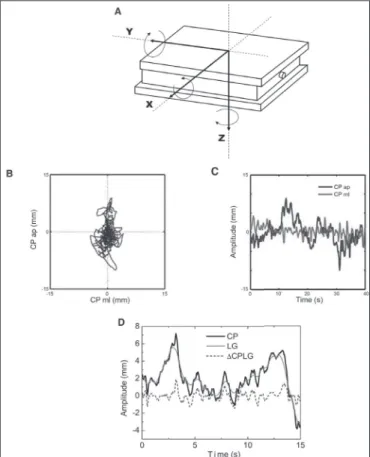
In general, the force plate consists of a board in which some (often four) force sensors of load cell type or piezoelectric are distributed to measure the three force components, Fx, Fy and Fz (x, y, and z are the anterior-posterior, medial-lateral, and vertical directions, respectively), and the three components of the moment of force (or torque), Mx, My, and Mz, acting on the plate (Figure 1A). As they measure six physical variables, these force plates are generally known as force plates of six components. h e CP data is related to a measure of position given by two coordinates on the plate surface dependent on the orientation of the individual assessed. Based on the signals measured by the force plate, the CP position in the anterior-posterior (ap) and medial-lateral (ml) directions are calculated as CPap=(−h*Fx−My)/Fz and CPml=(−h*Fy+Mx)/Fz, in which
h is the height of the base of support above the force plate; for example, a carpet on the force plate. h e CP data collected can be visualized in two dif erent ways: through a statokinesigram or through a stabilogram. h e statokinesigram is the map of the CP in the ap direction versus the CP in the ml direction (Figure 1B), while the stabilogram is the time series of the CP in each of the directions: ap and ml (Figure 1C).
Commercial force plates are expensive instruments (about $20 thousand in the United States); however, if the plate is used exclusively for posturography, a cheaper and simpler plate, suf-i csuf-iently accurate, may be busuf-ilt9. h is type of plate is composed of three or four load cells that measure only the vertical com-ponent of the ground reaction force and the two CP coordi-nates (or the two moments of force in the x and y axis). For this reason, it is known as force plate of three components.
Whether the force plate is of six or three components, it should be calibrated to guarantee an adequate measure10. h e producers of force plates also commercialize the equipments necessary (including software) for acquiring and processing the signal, although these can be bought separately. h e advantage of acquiring them from the same producer is that their use is a
Figure 1. Representation of a force plate and measuring axes (A) and examples of the statokinesigram (B) and of the stabilogram (C) of an individual in the quiet standing posture for 40 seconds. Example of CP, CGv trajectories, and of the difference between CP and CGv, CP-CGv, in the anterior-posterior (ap) direction during the quiet standing posture of an individual.
solved solution, but with the disadvantage of being like a black box with poor customizability. In this case, the user shall have a basic domain of the equipment functioning as well as of the signal that will be acquired and the analysis of this signal by the equipment in diverse assessment conditions (i.e., static and dynamic erect posture).
Relation between CG and CP
he CG position is a measure of displacement and is com-pletely independent of the velocity or total acceleration of the body and its segments11. he CP is also a measure of displace-ment and is dependent on the CG, but the CP expresses the location of the resultant vector of the ground reaction force in a force plate. his vector is equal and opposite to the weighted average of the locations of all the forces that act in the force plate, such as the weight force and the internal forces ( from mus-cles and joints) transmitted to the ground5. In this context, CG displacement is the variable that actually indicates the sway of the whole body, and the CP variable is, in fact, a combina-tion of the neuromuscular response to the CG displacement and the CG position itself. hese two variables express diferent concepts; in speciic situations, as in the static erect posture, may present similar variations12,13. he diferences between CG and CP are related to body acceleration, and the shorter the sway frequencies of the body, the shorter will be the dif-ferences between these two variables. he CG components in the ap and ml directions are the components of interest in pos-turography. Generally, there is no interest in the CG variation in the vertical direction, as the sway in this direction is much shorter compared to horizontal directions. he CG component in a horizontal direction is named vertical projection of the CG (CGv). Figure 1D presents examples of the trajectory of the CP and CGv and of the diference between CP and CGv (CP-CGv) in the ap direction during a 15-second record of an individual who remained in the quiet standing posture for 60 seconds.
Determining the CG may be done in three ways. he irst one is the kinematic method5,14, in which the positions of the body segments are evaluated in a certain instant, and the body’s CG is determined through the use of these positions and the observation of the inertial parameters of the body, such as the CG position in each segment and its respective mass. he diiculties related to the use of the kinematic method are that the inertial parameters of the body segments present consider-able errors ( from errors in the anthropometric models of the body) and the fact that this method is more complicated, as it requires the use of cinemetry (video cameras and software for calibration and coordinate reconstruction). he kinematic method has also been simpliied by the monitoring of a single marker on the body, considering that its movement represents
the global CG movement. Typically, this marker is positioned on the spine, near the ifth lumbar vertebra region. his simpli-ication is often accepted for the ap direction and for the quiet standing posture (but only for this situation).
In a second method, the horizontal component of the CG, the CGv, can be estimated by a double integration of the horizontal force divided by the mass (horizontal acceleration). he main problem in this method is in inding the initial position and ve-locity of the body after the double integration. If these constants are not determined, only the relative displacement of the CG, that shows a null mean velocity, is considered. King e Zatsiorsky15 proposed a method to determine these constants. he method is based on the hypothesis that, in the instant that the horizontal force is null, the positions of the CP and the CGv are coincident. Zatsiorsky e Duarte16 improved this method of double integration between the time instants of null force; both the integration con-stants are determined analytically from the CP data, and the time instants of null force are determined by the interpolation of the data obtained from the temporal series of the CP.
A third possible method to estimate the CGv from the CP is the iltering method based on the relation, in the frequen-cies domain, between CP and CGv, considering the body as an inverted pendulum17. his method consists of the use of a lowpass ilter in the CP signal. he cutof frequency of this lowpass ilter is determined by the anthropometric charac-teristics of the body, and the frequency is often about 0.5 Hz17. his method is probably the simplest and fastest, as it depends only on the CP position and a simple estimative of the body’s moment of inertia. he diference between the three methods, if correctly used, is small18, particularly between the irst two methods, being the iltering method more attractive due to its simplicity (with the possibility of being used even with the three components force plate). An important aspect is that the three methods, particularly the last two mentioned, which estimate the CGv from the CP, do not produce favorable results for the ml direction because, in this direction, the model of the body as an inverted pendulum is not precise.
Posturography standardization
he assessment of postural control may be done inside a laboratory, in outpatient settings, or in open environments in the case of ield evaluations. However, it is necessary that the environmental conditions such as lighting, noises, and other environmental conditions are adequate for the evaluation. he subject’s attention is another factor afecting the assessment of postural control. Furthermore, some parameters must be observed for the adequate acquisition of the posturography data when using the force plate. hese parameters include the frequency, period, and number of acquisitions, among others.
h e frequency of acquisition of the CP signal is dependent on the task investigated. For the quiet standing posture in normal subjects, the components of the signal frequency are below 10 Hz13. h us, according to the Nyqüist theorem (the sampling frequency must be, at least, double the frequency bandwidth), an acquisition frequency of 20 Hz would be enough. However, higher frequencies from noises can be present in the signal. h us higher acquisition frequencies, typically 100 Hz, are used in daily practice.
A limiting factor of the posturography using the force plate is the wide variability of the CP signal, which can interfere with the results’ interpretation to distinguish between the postural control of dif erent populations (adults, elderly people, indi-viduals with Parkinson’s disease, and others), the risk of falls, the ef ects of treatments, and others. For example, several trials from the same task may cause a learning ef ect, which leads to a progressive reduction of the postural sway. In extreme cases, several trials of the same task can lead to fatigue and, consequently, to an increase in postural sway. In the literature, there is a recommendation concerning the acquisition of two1 to four2 trials for the CP.
h e choice of the period of acquisition or of the trial dura-tion must be based on the tasks’ parameters; for example, it is recommended that the duration of the assessment in the quiet erect posture be from one to two minutes1,2. On the other hand, a length of 30 seconds has also been suggested as sui cient to assess the body sway both in adults19 and in elderly individuals20, especially in a clinical context, wherein one or more minutes may be a period too long for a patient under analysis to be standing. A period of acquisition too short, of less than 60 seconds in the quiet erect posture, may also lead to errone-ous conclusions due to the wide variability and the absence of stationarity of the CP signal21. On the other hand, a duration too long in this task may lead the subject to fatigue and a con-sequent alteration in the results obtained. Tasks that involve disturbances to the posture do not require a long duration; a few seconds before and after the perturbation are enough to verify the alterations and the stability of the CP.
Other evaluations may require longer durations, such as the unconstrained erect posture that requires a length of various min-utes standing on the force plate. Freitas et al.22 used this task in young adults and elderly individuals and showed that both groups were able to remain standing for 30 minutes, although the behav-ior of the elderly individuals had been dif erent from the young adults, as showed by the characteristics of the CP signal.
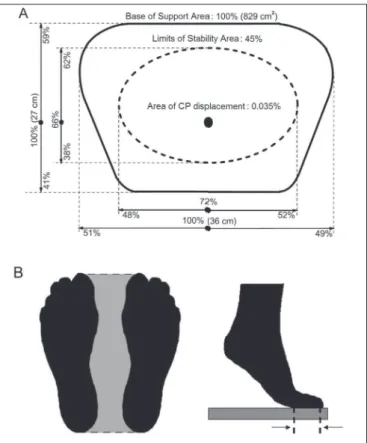
In the erect posture, the base of support corresponds to a polygon delimited by the lateral boarders of the feet. Body stabil-ity in this position is proportional to the base of support area. Figure 2A shows average results of the sway area of the CP, the limits of stability, and the base of support of 13 healthy adults who remained in the quiet erect posture on a force plate for 40
seconds (data obtained by Duarte e Zatsiorsky23). h us, the in-crease in the base of support ( feet more distant, Figure 2B) can lead to an increase in the participant’s stability. Such stability can be characterized by a reduction in body sway or, at least, by an increase in the limits of stability (maximum displacement of the body for the ap, ml, or both directions). On the other hand, the reduction of the base of support decreases the body’s stability and increases body sway.
h e standardization of the feet position is very important in investigating postural control24. h is standardization can be established in relation to the feet position according to the heels’ separation and to the opening angle between the feet. However, the use of such standardization does not take into account the particular characteristics of each subject and may cause the adoption of postural adjustments by the new position of the feet. h e use of a self-selected pleasant position may be an option. However, the examiner must observe if the distance chosen does not go beyond the shoulder’s width, considered a natural position. Body stability is also inversely related to the CG’s height, showing that the measures in posturography are af ected by the anthropometric characteristics of the sub-jects24. Considering this, it is necessary to take extreme care
Figure 2. In A, mean base of support (continuous line), ellipse representing the mean limits of stability (traced line) and mean of the ellipses, which describe CP sway during quiet standing posture for 40 s. N=13. Adapted from Duarte and Zatsiorsky23. In B, relation of the feet
position: separated and in the tip-toe posture with the base of support size and the area of displacement of the CG.
in selecting and interpreting the measures in posturography. An alternative is to normalize the posturographic measures through the anthropometric measures; for example, to divide the measure of CP variation by the subject’s height24.
A common procedure during the assessment of postural control is to ask the participant to keep his/her eyes ixed on a point in the space. Generally, this point is represented by a ixed target placed at the height of the participants’ eyes. he distance between the eyes and the visual ield seems to afect the postural stability25-27, and some care must be taken when selecting the distance between the participant and the visual ield (generally about 1 meter). For example, young adults and elderly individuals reduced their sway when the visual target was 40 cm distant from them, compared to a distance of 3 meters27. Other factors such as visual acuity, luminosity, loca-tion, and the size of the stimulus inside the visual ield may also interfere with posture stability.
Some tasks used for postural control assessment use per-turbations that are applied by the examiner or by the subject assessed and can cause loss of balance. Safety during the evalu-ation of postural control is very important. A safety system is commonly used to avoid a fall caused by disequilibrium. Generally, this system consists of a safety harness ixed at the shoulder or the upper part of the lower trunk and cables con-nected to the ceiling. A consideration related to the harness is if it afects the assessment of postural control. One of the reasons for such questioning is that studies reported that a single light touch in an external object (without considerable mechanical support) can reduce postural sway28. hus, it would be reasonable to expect a similar efect for a safety system when in contact with the body, particularly with the shoulder, which could generate somatosensory information for the pos-tural control system, leading to a reduction in pospos-tural sway, an undesirable efect during balance assessment. Nevertheless, this was not observed when 60 subjects were assessed using or not using the safety harness in two visual conditions, with and without visual information29. All the analyzed variables were similar in the conditions with and without the harness. Considering this, it seems possible that this procedure can be used without interferences in the assessment. It is important to highlight that changes may occur depending on the harness type used, for example, if the tension of the cables connected to it provides a mechanical support or if it is erroneously adjusted to the subjects.
Analysis and interpretation of the CP
characteristics
An important question that precedes the analysis of the CP sig-nal is whether it is stationary. A sigsig-nal is stationary if its properties
do not change over time30. Only if the signal is stationary can some common analysis be adequately used. Studies regarding the non
-stationary CP signal has shown divergent results31. Duarte et al.32 reported that the CP signal shows properties of long-range cor-relation when analyzing the unconstrained posture of healthy subjects for 30 minutes. his means that the data of the CP signal, even when temporally separated, are correlated. Considering the inding of long-range correlation, such divergences may be related to the fact that diferent investigators have tested only small por-tions of a longer process. Because of the existence of long-range correlations, apparent absence of a stationary condition in short temporal series of the CP may actually represent luctuations of a longer stationary process. herefore, the question related to the stationary state cannot be adequately solved using short tempo-ral series of a few minutes. However, the results from long-range correlation33,34 suggest that the CP signal from analyses of a few minutes of duration presents characteristics of non-stationary sig-nals. he absence of a stationary state due to the components of low frequency can be removed through the application of a high-pass ilter to the signal or, with less eiciency, removing trends in the CP signal33,34. In the practice reality, such strategies have been uncommonly used by the community because the non-stationary CP seems to have a low efect on the variables commonly used to analyze the CP signal. Another reason is the absence of an agree-ment regarding the question of the stationarity of the CP, deserv-ing further studies.
Although the most-used instrument in the postural assess-ment is the force plate, and the most common measure used is the CP, there is no agreement about which variables of the CP should be used in the assessment of postural control. here is an ininite number of variables that can be extracted by the records obtained in a postural assessment. Some common procedures in the analysis of the CP signal and some variables derived from it will be presented below.
he irst step in CP analysis is the iltering of the signal, procedure common in the analysis of biological signals. For the study of the quiet standing posture, a low-pass ilter of about 10 Hz or above is suicient5. he ilter frequency should be chosen according to the task parameters and to the equipment used. In the sequence, many variables can be derived from the statokine-sigram and the stabilogram of the CP. Some of these variables are redundant, which makes it unnecessary to analyze all of them. he posturographic analysis can be divided in two classes: global and structural analysis. he global analysis is related to the mea-surement of the “size” of the oscillatory patterns both in the spatial and in the frequency domains. he structural analysis identiies sub-unities in the posturographic data and correlates them with the motor control processes.
Baratto et al.35, using the global and structural analysis, inves-tigated 38 variables derived from the CP. Excluding the redundant
data and the lack of efect of the visual conditions (with and without visual input), the authors suggested only four variables for the CP analysis. Two of them are from the global analysis, the CP trajectory and the frequency band of the stabilogram, and the other two are from a structural analysis proposed by them35. However, among the measures used, the mean velocity of the CP has been considered the measure with the highest reliability among trials1,36. On the other hand, Doyle, Newton and Burnett37 reported that the variables’ peak velocity and sway area have shown, respectively, the highest and the lowest levels of reliabil-ity. Raymakers, Sanson and Verhaar38 observed that the measure of the velocity of the total displacement of the CP showed more sensibility to the comparisons among diferent age groups and diferent conditions of unsteadiness related to health. All these diferences may be due to the absence of a standardization in the methods used for the analysis of CP, such as diferences in duration (10 to 120 seconds), number of repetitions (three to nine repetitions), and sampling rates (10 to 100 Hz).
Some of these variables, as well as others commonly used in posturography, are described next, with examples of codes for the programming environment Matlab (Mathworks). he simplest operations from these codes may be adapted to other programming languages, but the most complicated operations are speciically dependent on the Matlab. Such codes are based on the presupposition that the CP data in the ap and ml direc-tions, respectively as the CPap and CPml, are variables in the Matlab environment.
Global analysis
Usually, the mean position of the CP is not of interest, as it is simply dependent on the absolute position of the subject on the force plate, which, in general, is not controlled. hus, it is a common procedure to remove the mean of the CP signal before any analysis procedure. A simple way to remove the tendency of the CP signal is to use the function “detrend” from the Mat-lab [CPap=detrend(CPap); CPml=detrend(CPml)]. Besides this, considering the components of low frequency of the CP signal,
which may contribute to its non-stationarity, as previously de-scribed, it is possible to apply a high-pass ilter on the CP signal. he choice of the cutof frequency of this ilter is critical and goes beyond the objectives of this text. Once these two procedures are executed, several variables may be derived from the CP signal.
On Table 1, the main variables used in the postural control investigation and the Matlab codes used for their calculus are described. hey are computed separately for the ap and ml directions, such as the total sway path39, standard deviation, root mean square (RMS), amplitude of CP displacement, and CP mean velocity. he variables area and total mean velocity (TMV) are calculated using the CP signal in both directions. he variable area estimates the dispersion of the CP data through the calculus of the statokinesigram area. here are dif-ferent ways to calculate this area, and one of the most common is through the statistical method of analysis of the principal components. Using it, it is possible to calculate an ellipse that contains a certain percentage ( for example, 95%) of the CP data, being the two axes of the ellipse calculated through the measures of the CP signals dispersion. he TMV is calculated through the displacement of the total sway of the CP in both directions divided by the total duration of the trial.
he Fourier analysis allows the decomposition of any signal as a sum of the sine and cosine functions with diferent amplitudes, frequencies, and phases. hus, it is possible to obtain informa-tion about the frequencies that compose a signal. his process is also named spectral analysis, and its result is considered the spectrum of the original signal. In practical terms, the spectral analysis is extremely dependent on the algorithm and its input parameters, which complicates the results comparison.
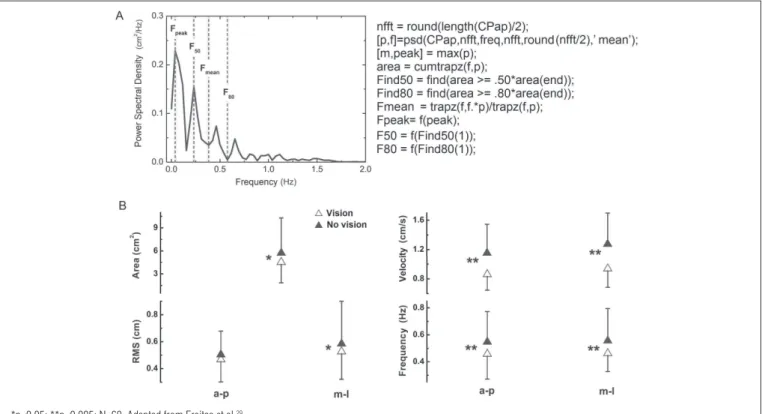
Figure 3A illustrates the frequencies for a CP signal and the Matlab code used to calculate these frequencies. he pre-dominant frequency or peak frequency is that with the highest amplitude among all frequencies that compose the spectrum. Baratto et al.35 suggest that the frequency band with 80% of the spectral power is the one that best characterizes the modiica-tions on the postural control system. Besides the analysis in
Table 1. Variables for global analysis of center of pressure (CP) and codes to calculate these variables using the Matlab programming environment.
Variable Description Matlab Code
Total displacement of sway, DOT ‘Size’ or length of CP trajectory on the base of support DOT=sum(sqrt(CPap.^2+CPml.^2)); Standard deviation Dispersion of CP displacement from the mean position during a time
interval
SDap=std(CPap); SDml=std(CPml); RMS (‘root mean square’) If the CP signal has zero mean, RMS and standard deviation provide
the same result.
RMSap=sqrt(sum(CPap.^2)/length(CPap)); RMSml=sqrt(sum(CPml.^2)/length(CPml); Amplitude of CP displacement Distance between the maximum and minimum CP displacement for
each direction
AdCPap=max(CPap) - min(CPap); AdCPml=max(CPml) - min(CPml);
Mean velocity (MV) Determine how fast were the CP displacements MVap=sum(abs(diff(CPap)))*freq/length(CPap)
MVml=sum(abs(diff(CPml)))*freq/length(CPml)
Area [vec,val]=eig(cov(CPap,CPml)); Area=pi*prod(2.4478*sqrt(svd(val)))
Total mean velocity (TMV) TMV=sum(sqrt(diff(CPap).^2+diff(CPml).^2))*freq/length(CPap)
these frequencies, it is common to use the mean frequency and the median frequency of the signal. To obtain estimations of the characteristics of the frequency of the CP signal, the Welch’s periodogram method can be used in the Matlab.
Examples of the mean results of a group with 60 healthy adults for the variables area, RMS, velocity, and frequency ( fre-quency band with 80% of the spectral power) of the CP sway in the ap and ml directions during quiet standing posture for 60 seconds, with and without visual input, are shown on Figure 3B (data obtained by Freitas et al.29).
Structural analysis
h e structural analysis of the CP has been proposed by several authors, among them Collins and De Luca40, Baratto et al.35, and Duarte and Zatsiorsky41. Collins and De Luca40 proposed the idea of decomposition of the CP signal in two stochastic processes modeled as random walk or Brownian movement: a process of short duration and one of long dura-tion. h e Brownian movement is a stochastic process in which, for each instant of time, a step is given with i xed amplitude and random direction. One characteristic of this process is that its variance increases over time. h us, dif usion graphics are built considering pairs of data of the CP separated by a time interval and computing the variance of the correspondent vectors as a function of the amplitude of the period of time.
Despite the interesting modeling of the CP as a Brownian movement, the interpretation that the authors attributed to the results is questionable. Based exclusively on these results, the authors proposed that the human postural control could be composed of an open loop (which works at intervals of up to approximately one second) and a closed loop (which works at intervals longer than approximately one second). h is theory can be questioned, as it is not possible to identify the mecha-nisms of control of a system based only on its responses. In ad-dition, there are in the literature42 alternative explanations to the i ndings of Collins and De Luca40.
h e structural analysis proposed by Baratto et al.35 is based on a concept named sway-density curve. h e fundamental idea is that the postural stabilization is accomplished by the feedforward mechanism and so, the process of control is based on a sequence of anticipatory motor commands. h e sway density curves are built by counting the number of consecutive samples of the CP trajectory that fall within a circle of known radius. In opposition of the model proposed by Collins and De Luca40, Baratto et al. 35 assumed that the CP trajectories are incompatible with the Brownian movement. h e sway density curves are characterized by peaks that represent instants of time in which the moment of force in the ankle and the motor commands are relatively stable and by valleys that represent the instants of time in which the moment of force in the ankle
Figure 3. In A, spectrum with the peak (Fpeak), mean (Fmean), in 50% (F50) and in 80% (F80) of the spectral power frequencies and, in B, mean and standard deviation for the variables area, RMS, velocity and frequency (frequency band of 80% of the spectral power) of the CP sway in the anterior-posterior (ap) and medial-lateral (ml) directions with and without visual input.
*p<0.05; **p<0.005; N=60. Adapted from Freitas et al.29.
changes quickly from a stable value to another. Several vari-ables can be extracted from these analyses; however, according to Baratto et al.35, only two of them would be recommended in the postural analysis: the mean amplitude of the peak and the mean interval of time between the peaks.
he structural analysis proposed by Duarte e Zatsiorsky41 is based on the idea that the CP trajectory is not purely sto-chastic and that it is possible to identify consistent patterns through an analysis of the spatial domain of the statokinesig-ram and an analysis of the temporal domain of the stabilo-gram. Such analysis is indicated for the assessment of tasks of long duration, in which the individual being evaluated is al-lowed to perform postural changes if he/she wants to. hese changes are generally observed in the natural posture, when someone is standing while executing another task, for exam-ple, talking to another person or waiting in a line. his task, when investigated in a laboratory, was named as a prolonged unconstrained posture. Duarte and Zatsiorsky41 showed that when the CP is presented as a temporal series, three patterns can be identiied: Shifting (a step): a quick displacement of the mean position of the CP from one region to another; Fidgeting
(a pulse): a fast and large displacement of the CP and a return to approximately the same position; and Drifting (a ramp): continuous and slow displacement of the mean CP position. his structural analysis has been applied in studies under diferent conditions32 and in diferent populations, such as
elderly individuals22 and low-back-pain patients43, in order to understand the natural posture of these individuals.
Final comments
he study concerning the mechanisms by which human beings control their posture and how diferent factors, such as health state, anthropometric characteristics, physical con-dition, age, and environment interfere with postural control is crucial to a better comprehension of this ability and to the diagnosis of any impairment related to it. his article tried to show the importance of the standardization of posturography, of the methods for the analysis of postural control, and of their measuring variables in order to obtain more reliable and valid results. he suggestions presented concerning standardization are the most commonly used and the most critical for the study of human posture, but this ield still needs further methodolog-ical studies and a stronger consensus in order to adopt a more acceptable standardization.
Acknowledgments
Fundação de Amparo à Pesquisa do Estado de São Paulo by the inancial support (04/10917-0 and 01/03429-0).
1. Lafond D, Corriveau H, Hébert R, Prince F. Intrasession reliability of center of pressure measures of postural steadiness in healthy elderly people. Arch Phys Med Rehabil. 2004;85(6):896-901.
2. Corriveau H, Hébert R, Prince F, Raiche M. Intrasession reliability of the “center of pressure minus center of mass” variable of postural control in the healthy elderly. Arch Phys Med Rehabil. 2000;81(1):45-8.
3. Zatsiorsky VM. Kinematics of human motion. Champaign: Human Kinetics; 1998.
4. Zatsiorsky VM. Kinetics of human motion. Champaign: Human Kinetics; 2002.
5. Winter DA. Biomechanics and motor control of human movement. 3ª ed. Hoboken: John Wiley & Sons; 2005.
6. Horak FB, Diener HC, Nashner LM. Influence of central set on human postural responses. J Neurophysiol. 1989;62(4):841-53.
7. Casadio M, Morasso PG, Sanguineti V. Direct measurement of ankle stiffness during quiet standing: implications for control modelling and clinical application. Gait Posture. 2005;21(4): 410-24.
8. Loram ID, Lakie M. Direct measurement of human ankle stiffness during quiet standing: the intrinsic mechanical stiffness is insufficient for stability. J Physiol. 2002;545(Pt 3):1041-53.
9. Bizzo G, Guillet N, Patat A, Gagey PM. Specifications for building a vertical force platform designed for clinical stabilometry. Med Biol Eng Comput. 1985;23(5):474-6.
10. Cappello A, Lenzi D, Chiari L. Periodical in-situ re-calibration of force platforms: a new method for the robust estimation of the calibration matrix. Med Biol Eng Comput. 2004;42(3):350-5.
11. Winter DA. Biomechanics and motor control of human movement. 2a ed. New York: John Wiley & Sons; 1990.
12. Gurfinkel EV. Physical foundations of stabilography. Agressologie. 1973;14(Spec No C):9-13.
13. Winter DA. A.B.C. (Anatomy, Biomechanics and Control) of balance during standing and walking. Waterloo: Waterloo Biomechanics; 1995.
14. Winter DA, Patla AE, Prince F, Ishac M, Gielo-Perczak K. Stiffness control of balance in quiet standing. J Neurophysiol. 1998;80(3):1211-21.
15. King DL, Zatsiorsky VM. Extracting gravity line displacement from stabilographic recordings. Gait Posture. 1997;6(1):27-38.
16. Zatsiorsky VM, Duarte M. Rambling and trembling in quiet standing. Motor Control. 2000;4(2):185-200.
17. Caron O, Faure B, Brenière Y. Estimating the centre of gravity of the body on the basis of the centre of pressure in standing posture. J Biomech. 1997;30(11-12):1169-71.
18. Lafond D, Duarte M, Prince F. Comparison of three methods to estimate the center of mass during balance assessment. J Biomech. 2004;37(9):1421-6.
19. Le Clair K, Riach C. Postural stability measures: what to measure and for how long. Clin Biomech (Bristol, Avon). 1996;11(3):176-8.
20. Rugelj D, Sevsek F. Analysis of postural sway data of elderly subjects. 6th WSEAS International Conference on Signal Processing,Robotics and Automation; 2007 Fe 16-19; Corfu Island. Greece: WSEAS World Scientific Engineering Academy and Society; 2007.
21. Carpenter MG, Frank JS, Winter DA, Peysar GW. Sampling duration effects on centre of pressure summary measures. Gait Posture. 2001;13(1):35-40.
22. Freitas SM, Wieczorek SA, Marchetti PH, Duarte M. Age-related changes in human postural control of prolonged standing. Gait Posture. 2005;22(4):322-30.
23. Duarte M, Zatsiorsky VM. Effects of body lean and visual information on the equilibrium maintenance during stance. Exp Brain Res. 2002;146(1):60-9.
24. Chiari L, Rocchi L, Cappello A. Stabilometric parameters are affected by anthropometry and foot placement. Clin Biomech (Bristol, Avon). 2002;17(9-10):666-77.
25. Paulus WM, Straube A, Brandt T. Visual stabilization of posture. Physiological stimulus characteristics and clinical aspects. Brain. 1984;107(Pt 4):1143-63.
26. Stoffregen TA, Pagulayan RJ, Bardy BG, Hettinger LJ. Modulating postural control to facilitate visual performance. Hum Mov Sci. 2000;19(2):203-20.
27. Prado JM, Stoffregen TA, Duarte M. Postural sway during dual tasks in young and elderly adults. Gerontology. 2007;53(5):274-81.
28. Jeka JJ, Lackner JR. Fingertip contact influences human postural control. Exp Brain Res. 1994;100(3):495-502.
29. Freitas SM, Prado JM, Duarte M. The use of a safety harness does not affect body sway during quiet standing. Clin Biomech (Bristol, Avon). 2005;20(3):336-9.
30. Bendat JS, Piersol AG. Random data : analysis and measurement procedures 3ª ed. New York: Wiley; 2000.
31. Powell GM, Dzendolet E. Power spectral density analysis of lateral human standing sway. J Mot Behav. 1984;16(4):424-41.
32. Duarte M, Harvey W, Zatsiorsky VM. Stabilographic analysis of unconstrained standing. Ergonomics. 2000;43(11):1824-39.
33. Duarte M, Zatsiorsky VM. On the fractal properties of natural human standing. Neurosci Lett. 2000;283(3):173-6.
34. Duarte M, Zatsiorsky VM. Long-range correlations in human standing. Phys Letters A. 2001;283(1-2):124-8.
35. Baratto L, Morasso PG, Re C, Spada G. A new look at posturographic analysis in the clinical context: sway-density versus other parameterization techniques. Motor Control. 2002;6(3):246-70.
36. Cornilleau-Pérès V, Shabana N, Droulez J, Goh JC, Lee GS, Chew PT. Measurement of the visual contribution to postural steadiness from the COP movement: methodology and reliability. Gait Posture. 2005;22(2):96-106.
37. Doyle TL, Newton RU, Burnett AF. Reliability of traditional and fractal dimension measures of quiet stance center of pressure in young, healthy people. Arch Phys Med Rehabil. 2005;86(10):2034-40.
38. Raymakers JA, Samson MM, Verhaar HJ. The assessment of body sway and the choice of the stability parameter(s). Gait Posture. 2005;21(1):48-58.
39. Kantner RM, Rubin AM, Armstrong CW, Cummings V. Stabilometry in balance assessment of dizzy and normal subjects. Am J Otolaryngol. 1991;12(4):196-204.
40. Collins JJ, De Luca CJ. Open-loop and closed-loop control of posture: a random-walk analysis of center-of-pressure trajectories. Exp Brain Res. 1993;95(2):308-18.
41. Duarte M, Zatsiorsky VM. Patterns of center of presure migration during prolonged unconstrained standing. Motor Control. 1999;3(1):12-27.
42. Peterka RJ. Postural control model interpretation of stabilogram diffusion analysis. Biol Cybern. 2000;82(4):335-43.
43. Lafond D, Champagne A, Descarreaux M, Dubois JD, Prado JM, Duarte M. Postural control during prolonged standing in persons with chronic low back pain. Gait Posture. 2009;29(3):421-7.