O
RIGINALA
RTICLE Revista Brasileira de FisioterapiaValidity and reliability of clinical tests for
assessing passive ankle stiffness
Validade e confiabilidade de medidas clínicas para avaliação da rigidez passiva da
articulação do tornozelo
Vanessa L. Araújo, Viviane O. C. Carvalhais, Thales R. Souza, Juliana M. Ocarino, Gabriela G. P. Gonçalves, Sérgio T. Fonseca
Abstract
Background: The presence of inadequate levels of passive ankle stiffness have been associated with the occurrence of movement disorders, the development of pathological conditions and the reduction in the performance of functional activities such as walking, running and jumping. Therefore, clinical tests to evaluate ankle stiffness may be useful for the physical therapy assessment. Objectives:
To investigate the concurrent validity and the intra- and inter-examiner reliability of clinical measures developed to assess passive stiffness of the ankle joint during dorsiflexion movement. Methods: Fifteen healthy participants underwent to test-retest evaluations of their ankles by two examiners. Two clinical measures were performed: ‘position of first detectable resistance’ and ‘change in passive resistance torque’. The results of these tests were compared to the passive stiffness measured with an isokinetic dynamometer, in which the electromyography activity of specific muscles was monitored to ensure that the test was performed passively (gold standard measure). Results: Pearson correlation coefficients ranged from r=-0.81 to -0.88 (p<0.001) for the correlation between the passive ankle stiffness measured with the isokinetic dynamometer and the results of the clinical measure ‘position of the first detectable resistance’. For the measure of ‘change in passive resistance torque’, these coefficients ranged from r=0.72 to 0.83 (p<0.004). The Intraclass Correlation Coefficients (ICCs) for the intra- and inter-examiner reliability ranged from 0.75 to 0.98. Conclusion: The clinical measures presented satisfactory validity and reliability to be used in clinical practice.
Keywords: passivestiffness; clinical test; ankle; validity of tests; reproducibility of results.
Resumo
Contextualização: Níveis inadequados de rigidez passiva do tornozelo têm sido associados à ocorrência de disfunções de movimento, ao desenvolvimento de patologias e à redução no desempenho em atividades como marcha, corrida e salto. Testes clínicos para investigar a rigidez dessa articulação podem ser úteis no processo de avaliação fisioterápica. Objetivos: Investigar a validade concorrente e as confiabilidades intra e interexaminadores de medidas clínicas para avaliação da rigidez passiva do tornozelo durante o movimento de dorsiflexão. Métodos: Quinze voluntários saudáveis foram submetidos a avaliações teste-reteste do tornozelo por dois examinadores. Duas medidas clínicas foram realizadas: “posição de primeira resistência detectável” e “mudança do torque passivo de resistência”. Os resultados desses testes foram comparados à medida da rigidez passiva realizada com um dinamômetro isocinético, no qual a atividade eletromiográfica dos músculos foi monitorada para garantir que o teste fosse realizado passivamente (medida padrão-ouro). Resultados: Os Coeficientes de Pearson variaram de r=-0,81 a -0,88 (p<0,001) para a correlação entre a medida da rigidez com o dinamômetro isocinético e os resultados da medida “posição de primeira resistência detectável”. Para a medida “mudança do torque passivo de resistência”, esses coeficientes variaram de r=0,72 a 0,83 (p<0,004). Os Coeficientes de Correlação Intraclasse (CCIs) obtidos para as confiabilidades intra e interexaminadores variaram de 0,75 a 0,98. Conclusão: Os testes propostos apresentaram validade e confiabilidades satisfatórias para serem utilizados na prática clínica.
Palavras-chave: rigidez passiva; teste clínico; tornozelo; validade dos testes; reprodutibilidade dos resultados.
Received: 09/06/2010 – Revised: 08/10/2010 – Accepted: 14/12/2010
Physical Therapy Department, School of Physical Education, Physical Therapy and Occupational Therapy, Universidade Federal de Minas Gerais (UFMG), Belo Horizonte, MG, Brazil
Correspondence to: Sérgio Teixeira da Fonseca, Departamento de Fisioterapia da Escola de Educação Física, Fisioterapia e Terapia Ocupacional, Universidade Federal de Minas Gerais, Av. Presidente Antônio Carlos, 6627, Campus Pampulha, CEP 31270-901, Belo Horizonte, MG, Brasil, e-mail: [email protected]
Introduction
Joint stiffness is a mechanical property related to the resistance that a joint provides to the movement, being graphically represented by the slope of the torque-angle curve1. This resistance is due to the stiffness of the tissue
surrounding the joints1,2. Faced with an external
perturba-tion, the greater the stiffness presented by these tissues, the faster the joint reaches a resistance torque sufficient to avoid the prolongation of joint displacement1,3. Stiffness
regulation can be determined either by muscle contraction and passive mechanisms1,2. The passive components may
act to allow that the resistance to joint movement occurs with the lowest possible muscle activity and therefore, with a lower energy expenditure4,5. Depending on the magnitude
of resistance torque that a joint needs to generate, the pas-sive mechanisms may be sufficient to resist undesirable movements or they may act as a complementary mecha-nism of muscle activation5-9. Therefore, the contribution of
the passive components in stiffness is necessary to allow the occurrence of appropriate movement patterns with a lower energy expenditure4,5.
The level of passive ankle stiffness may influence the kinetic and kinematic characteristics of gait, running and jumping6,10,11. Salsich and Mueller6 have shown that the total
torque of plantar flexion (PF) generated during the stance phase of the gait is influenced from both the contraction of the plantar flexion and the passive stiffness of these muscles6. In addition, during the preparation phase for the
jump, an appropriate stiffness of the ankle can promote the absorption and the storage of elastic potential energy and the reuse of this energy in the following muscle con-traction10-12. Thus, low passive ankle stiffness may demand
an excessive activity of the muscles of this joint, predispos-ing them to fatigue and possible injuries5,13. In contrast, an
excessive increase of the passive resistance to dorsiflexion (DF) movement during the mid stance phase of gait could hamper the progression of the tibia on the talus, which fa-vors the occurrence of an excessive compensatory prona-tion of the subtalar joint14,15. This movement dysfunction
has been associated to the occurrence of injuries, such as pattelofemoral syndrome16,17, plantar fasciitis14 and medial
tibial stress syndrome18-20. Therefore, reduced or excessive
levels of passive ankle stiffness may be associated to bio-mechanical changes during gait, running and jumping; to a reduction in the performance of these activities and to the development of pathologies.
he ankle joint stability, i.e., the ability of this joint to resist to external disturbances is also inluenced by the passive stif-ness of the tissues around the joint5,8. Loram, Maganaris and
Lakie5 concluded that nearly 70% of the ankle stifness required
for maintaining the stability during orthostatic posture is provided by the passive components, being some subjects pro-duce 100% of this stifness passively5. Moreover, ankle stifness
during running on unstable surfaces seems to be inluenced by the passive tension of the gastrocnemius muscle8. herefore,
reduced levels of passive ankle stifness can compromise the joint stability, facilitating the occurrence of ankle sprains and ligament injuries.
he investigation of passive ankle stifness during DF movement may be useful in clinical practice, since this prop-erty is related to the development of pathologies6,14,15 and
may be modiied through physical therapy interventions21-23.
However, isokinetic dynamometer, the gold standard instru-ment for the assessinstru-ment of stifness24, is not accessible for the
majority of therapists. Clinical measures for evaluating the passive stifness of the glenohumeral joint25 and of the
lum-bar spine26 were developed in previous studies, but still there
are no clinical methods that allow the investigation of this property in the ankle joint.
One possible way to infer about the magnitude of the passive ankle stiffness based on the definition of this prop-erty1, would be to determine if the angle in which the torque
of passive resistance generated by the ankle plantar flexors equals a certain external torque that tends to displace the joint in DF direction. This angle could be called “position of the first detectable resistance” and, the greater the stiff-ness presented by the joint, the smaller would be this angle. Another approach to measure the passive stiffness would be to calculate the difference between the resistance torques recorded in two specific positions of the ankle joint in order to determine the increase of this torque after joint displace-ment. This measure could be called “change in passive re-sistance torque”. For this measures being used consistently, it is crucial to determine their validity and reliability27,28.
Therefore, the objectives of this study were: (a) to investigate the concurrent validity between the clinical measurements (“position of the first detectable resistance” and “change in passive resistance torque”) and the measurement of passive stiffness performed with the isokinetic dynamometer; (b) to determine the intra- and inter-examiner reliability of these clinical measures.
Methods
Sample
Fifteen healthy subjects participated in this study (seven men and eight women), with a mean age of 24.06±3.35 years, a
mean body mass of 62.10±9.70kg, a mean height of 1.68±0.08 m and a mean body mass index (BMI) of 21.83±2.31kg/m². he mean feet length was of 0.16±0.01m and 93% of the participants were right-handed. he inclusion criteria of this study were age between 18 and 35 years-old, absence of symptoms in the lower limbs and a minimal DF range of motion of 10°. he subjects unable to maintain the ankle muscles relaxed during testing procedures were excluded. his study has been approved by the Ethics Committee of Research of the Universidade Federal de Minas Gerais (UFMG), Belo Horizonte, MG, Brazil, under the protocol ETIC 136/08, and the participants signed a informed consent form.
Procedures
A scale with altimeter was used to measure body mass and height of the participants. he foot length was recorded ac-cording to the references proposed by Winter29. he dominant
limb was chosen for assessment.
Measurement of passive stiffness with the isokinetic dynamometer
The measurement of the passive resistance torque (PRT) produced by the ankle was performed using an isokinetic dynamometer (Biodex System 3 Pro, Shirley, USA) in the passive operation mode (speed: 5°/s). The participant re-mained in supine, with the knee in extended position, the foot fixed in a base and the lateral malleolus aligned with the rotation axis of the device (Figure 1). An inclinometer was used for positioning the leg horizontally. Dynamometer lever performed the DF movement from 5° of PF to 10° of DF, being the neutral position (0º) defined as an angle of
90° formed between the base of support for the foot and the subject’s leg. The participants were instructed not to resist or to voluntarily assist handler displacement. A total of five repetitions were performed for viscoelastic accommodation of the tissues and then, three valid repetitions of the test were carried out. One repetition of the lever movement was performed without the participant in order to record the torque generated only by the lever weight.
During the assessment of the PRT, the electromyographic activity of the medial gastrocnemius, soleus and tibialis an-terior muscles was monitored with the purpose to ensure that the test was performed passively. Pairs of active surface electrodes were placed over the area of greater muscle belly, after of the procedures of trichotomy and skin cleansing30.
Muscle activity monitoring was performed using a program developed in the Matlab software (The Mathworks Inc.), which considered as muscle activity those in which the elec-tromyographic signal was equal to or greater than the mean plus two standard deviations of the signal obtained during the muscle rest31. When the muscle activity was detected,
the test was replaced by a new trial. Electromyographic data were collected with an electromyograph MP100 (Biopac Sys-tem, Goleta, EUA), at a frequency of 1000Hz and processed with a 4th order Butterworth Bandpass filter and cutoff
fre-quencies of 10Hz and 500Hz.
Data provided by the isokinetic dynamometer was pro-cessed using a program for calculating the passive ankle stifness developed in the Matlab software. hese data were iltered with a 4th order Butterworth low-pass ilter, with
cut-of frequency cut-of 1.25Hz. he torques produced by the weight of the participant’s foot were calculated based on joint dis-placement and on the anthropometric table from Winter29.
Subsequently, the torques generated by foot and dynamom-eter lever weights were subtracted from the total torque provided by the isokinetic dynamometer. he stifness was calculated as the average slope of the torque-angle curve32
in the interval between 5° of PF and 10° of DF, since in this amplitude the plantar lexors muscles are tensioned and the stifness of these muscles would have a considerable inlu-ence on ankle function during functional activities. he mean stifness values from the three trials were calculated (Nm/ rad). he measurement of passive stifness with the isokinetic dynamometer was previously performed with seven subjects and presented an excellent test-retest reliability estimate (0.98)27.
Clinical measures for the assessment of passive stiffness
The clinical measures for the assessment of passive ankle stiffness were performed in a random sequence, by two trained examiners. During the training period, the Figure 1. Measure of passive ankle stiffness with an isokinetic
dynamometer.
Figure 3. Clinical measure of “change in passive resistance torque” of the ankle joint.
Figure 2. Clinical measure of “position of first detectable resistance” of the ankle joint.
examiners performed the clinical tests in fifteen subjects over two weeks, and in five subjects the tests were per-formed in the presence of both examiners with the purpose of discussing the difficulties presented. In the study, the measurements were repeated by the same examiners after a period of one week. Initially, five repetitions of the DF move-ment were performed to allow viscoelastic accommodation. During the tests, the ankle muscles should remain relaxed and if any signs of contraction were observed (visually or by palpation) the test was repeated.
Position of the first detectable resistance of the ankle joint
he “position of the irst detectable resistance” was deined as the angle in which the resistance torque produced by the joint was equal to a standardized external torque. During the test, the subject was positioned in prone, with the knee at 90° of lexion and the ankle in the resting position, i.e., the position in which the ankle muscles were relaxed (Figure 2). A ankle weight (2 kg) was positioned on the plantar surface of the foot at a distance of 8 cm from the lateral malleolus, measured in the lateral border of the foot. his procedure was necessary because during the pilot study the torque generated by the foot weight (without the ankle weight) was not suicient for tensioning the plantar lexors, and the position assumed by the ankle was almost the same regardless of the gravity favoring or not the DF movement. herefore, the mean torques generated by the weight of the feet of the participants from the pilot study was calculated29, and it was decided to add a weight capable
to triplicate this mean torque. After the addition of the ankle weight, the position assumed by the ankle was measured us-ing a goniometer. he stationary arm of the goniometer was positioned over a line that connected the head of the ibula to the center of the malleolus, while the movable arm was aligned parallel to the lateral border of the foot. he goniometer axis was positioned 1 cm below the lateral border of the foot ac-cording to the ibula line direction. hus, the “position of the irst detectable resistance” corresponded to the position in which the torque generated by the weight of the complex ankle weight-foot was equal to the DF resistance torque produced by the ankle. his measure was determined in degrees using the mean of the three test trials.
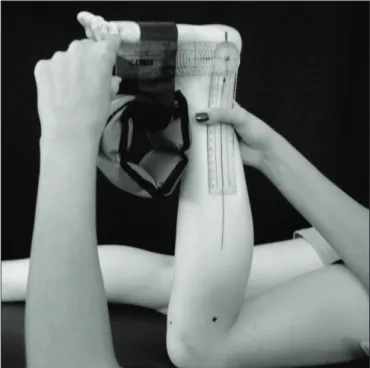
Change of the ankle resistance passive torque
During this test, the subject remained in prone posi-tion with the knee flexed at 90°. A manual dynamometer (MICROFET 2, Draper, USA) was placed over the plantar surface of the foot, at a distance of 8 cm from the lateral malleolus, measured on the lateral border of the foot (Fig-ure 3). The examiner should move the ankle in DF, apply-ing a force perpendicular to the plantar surface of the foot.
The manual dynamometer registered, in the low-threshold mode, the ankle passive peak resistance force generated at 5° of PF and 10° of DF. The determination of these angles was performed with the goniometer according the references described above. This measurement was performed five times, being the highest and lowest force values registered in each specific position. The mean of the three remaining values was calculated. The force values were transformed in PRTs by multiplying the force by the length of the lever arm (8 cm). Subsequently, the difference between the peak PRTs found at 10° of DF and at 5º of PF, measured in New-ton-meters (Nm) was determined.
sec
ond
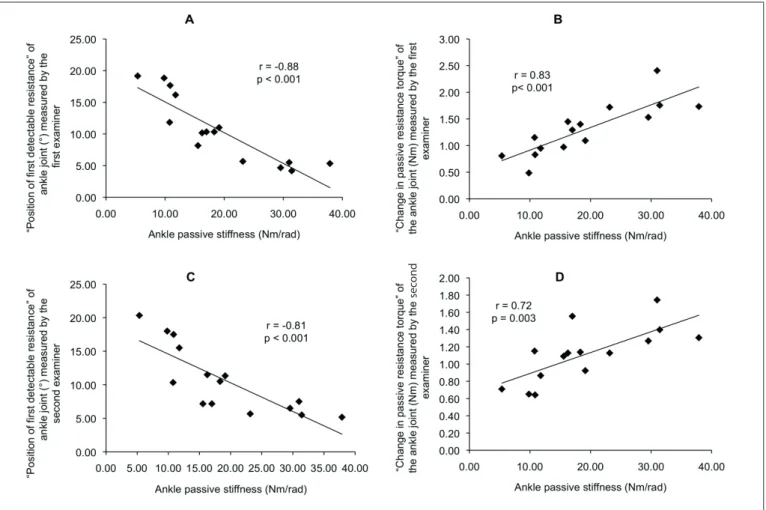
Figure 4. Scatter plots of the association between the passive stiffness measured with an isokinetic dynamometer and: A) “position of first detectable resistance” measured by the first examiner; B) “change in passive resistance torque” measured by the first examiner; C) “position of first detectable resistance” measured by the second examiner; D) “change in passive resistance torque” measured by the second examiner.
Statistical analysis
Pearson’s Correlation Coefficient was used to determine the level of agreement between the results of the clinical measures and the passive stiffness values obtained with the isokinetic dynamometer. This analysis used the mean of results from the clinical tests conducted in the first and second assessment days, for each examiner. Intra and inter-examiners reliabilities were calculated using the Intraclass Correlation Coefficient (ICC). The significance level was set at 0.05. The standard error of measurement (SEM) was cal-culated for each clinical test.
Results
Pearson’s Coeicients obtained from the data of the irst examiner were r=-0.88 (p<0.001) and r=0.83 (p<0.001) for the correlation between the stifness measurement performed with the isokinetic dynamometer and the measures “position
of the irst detectable resistance” and “change in passive resis-tance torque”, respectively (Figure 4). For the second examiner, these coeicients were r=-0.81 (p<0.001) and r=0.72 (p=0.003) (Figure 4). he ICCs obtained for the intra and inter-examiner reliability ranged from 0.75 to 0.98. Reliability values related to each test, the means values, standard deviations (SD) and SEM are shown in Table 1.
Discussion
The Pearson’s Correlation Coefficients obtained in the present study have shown that the clinical measurements are significantly correlated with the gold-standard measure of passive ankle stiffness. Portney and Watkins27 consider
that the correlation coefficients above 0.75 represent a good to excellent correlation, and the values ranging be-tween 0.50 to 0.75 suggest a moderate to good validity. Other authors considered valid clinical measurements that presented a correlation coefficient equal or greater than
0.5733-35. Considering that the Pearson’s Correlation
Coeffi-cients found in the present study were higher than 0.72, the clinical measures presented a satisfactory correlation with the measurement of stiffness performed with the isokinetic dynamometer. In addition, the ICC values of the measure “position of the first detectable resistance” indicates an excellent reliability, while the ICC values of the measure “change in passive resistance torque” represents good reli-ability27. Other studies that investigated the reliability of
clinical measures for assessing the glenohumeral joint and lumbar spine stiffness had also found reliability ranging from good to excellent25,26,36. These studies highlighted the
relevance of the existence of reliable clinical measures for the assessment of passive stiffness. Therefore, this study demonstrated that the proposed measures have shown sat-isfactory validity and reliability for clinical use.
he lowest correlation coeicient and ICC values found for the measure “change in passive resistance torque” can be explained by the diiculty to register the force resistance at 10º of ankle DF (due to the high tension of the plantar lexors). At this angle, the examiner needed to perform a large amount of force on the plantar surface of the foot, while controlling the amplitude through goniometry. hus, the diiculty to perform this test may justify the results found. However, such results still support the use of this test.
Regarding the measure “position of the irst detectable resistance”, the higher the passive resistance provided by the tissues, the lower the ankle displacement in DF and the smaller the angle registered. hus, subjects whom obtained the highest values of stifness measured with the dynamom-eter showed lower values in the measure “position of the irst detectable resistance”, justifying the negative correlation be-tween these measures.
he SEM values found in this study can be used as a refer-ence to detect changes in the results of the clinical measures that may have occurred due to measurement error. hese val-ues can be useful in monitoring the evolution of patients, and changes in the results of the clinical tests below the SEM do not evidence a real change in stifness.
Stifness measurements are inluenced by the torques pro-duced by foot weight. In the assessment with isokinetic dyna-mometer, the results obtained were normalized by these torques, while, in clinical measurements, the results were not normal-ized, which could lead to challenge the validity of the clinical measurements. In order to verify the inluence of this factor in the correlations obtained, an additional analysis was performed using the values of the clinical measurements normalized by the foot torque. he values of correlation coeicient were similar to those obtained without the normalization by the torques. he correlation coeicients found after correction by the foot torque, according to the results of the irst examiner, were: r=-0.82 for the measure “position of the irst detectable resistance” and r=0.83 for the measure “change in passive resistance torque”. he small foot weight and its small variability among the subjects seem to justify the similarity of the correlation values and, therefore, the inluence of the torque produced by the foot weight on the clini-cal measurements could be ignored. hus, the measurements can be used without the normalization by the foot torque in order to facilitate their use in clinical practice.
he measurement of passive stifness with the isokinetic dy-namometer was performed with the knee in extension, since dur-ing the stance phase of gait, the knee maintains ranges of motion close to the extension and, therefore, to investigate the stifness in this condition would be functionally relevant. However, it was not possible to measure “change in passive resistance torque” with the knee in extension, because of the increase in stifness of the ankle Table 1. Means, standard deviations (SD), Intra-class Correlation Coefficients (ICC) and Standard Errors of Measurement (SEM) for the clinical measures of “position of the first detectable resistance” and “change in passive resistance torque” of the ankle joint.
Positive angles values indicate positions of ankle dorsiflexion. Positive torque values indicate resistance to dorsiflexion of the ankle joint. E1=examiner one; E2=examiner two. (1)=test; (2)=re-test.
“Position of first detectable resistance” of the ankle joint
“Change in passive resistance torque” of the ankle joint
Mean (°) SD (°) Mean (Nm) SD (Nm)
E1(1) 10.89 4.90 1.37 0.52
E1(2) 10.31 5.69 1.24 0.52
E2(1) 10.18 4.89 1.15 0.39
E2(2) 11.11 5.50 1.08 0.31
ICC SEM ICC SEM
E1(1) X E1(2) 0.97 0.86 0.87 0.18
E2(1) X E2(2) 0.93 1.42 0.80 0.16
E1(1) X E2(1) 0.98 0.74 0.87 0.17
E1(2) X E2(2) 0.97 1.03 0.75 0.21
in this position that ofered diiculty for the examiners to register the force of resistance at 10° of DF, while they were controlling the amplitude. In addition, the execution of the measurement “position of the irst detectable resistance” with the knee extended would preclude the placement of the ankle weight on plantar surface of the foot. However, the diferent knee positions used, although they generate diferent tensions in uni- and bi-articular muscles, did not compromise the usefulness of clinical measurements to inform about the values of the gold-standard measurement. his may be explained by the fact that subjects with higher levels of stifness with the knee extended are probably those with higher levels of stifness with the knee lexed.
he clinical measures proposed are not applicable for subjects presenting pain or muscle spasms during the test execution, since they would be unable to maintain the ankle muscles relaxed. Moreover, one of the inclusion criteria of the present study was the presence of a range of motion of at least 10° of DF, and therefore, the clinical measures cannot be applied for this group of subjects. he participants of the present study presented BMI up to 27 Kg/m2 which makes it diicult to generalize the results to
the entire population. Besides that, lower values of correlation coeicient and ICC are expected if the clinical measurements are performed by examiners without previous training. Finally, this study did not have the purpose to classify the ankle stif-ness values as low, normal or high, and still there is no evidence that allow such classiication.
Several tests and scales are proposed for evaluating the lexibility37,38 and spasticity39 of the ankle plantar lexors and
of-ten these tests are used in clinical practice to infer about ankle passive stifness40. However, in contrast to the passive stifness,
lexibility measurement is not only determined by mechanical properties, since it is inluenced by individual levels of tolerance to stretching41. Some studies have shown that less than 30% of
the variability found in stifness measurement may be explained by lexibility40,42. he spasticity involves relex muscle activation
during the performance of a passive movement43, while the
mea-surement of the passive stifness requires the electromyographic silence of the muscles1. hus, the passive stifness provides more
appropriate and objective information on the joint mechanics than the measures of lexibility and spasticity40,42,44.
he proposed clinical tests used simple and accessible instru-ments for physical therapist’s practice. hese tests can be used during the evaluation of patients with conditions related to ankle stifness changes and are useful in the investigation of the exis-tence of asymmetry between limbs. In addition, these measures present applicability in prevention, since the tests may be used to identify subjects requiring interventions targeting change of the ankle levels of stifness, with the purpose to prevent the occur-rence of injuries. In the situations where ankle stifness needs to be modiied, techniques of muscle strengthening and stretching are eicient to increase or decrease stifness levels21-23. Despite
the measures contribute for professional practicing, it is neces-sary that further studies investigating the relationship between the results of these measures and the presence of movement dys-functions and pathologies. hus, the clinical measures proposed allow the therapist to investigate a relevant joint property that may be clinically modiied to rehabilitate or prevent injuries.
Conclusion
he present study demonstrated that the tests proposed could inform about the levels of passive ankle stifness during DF. Although both tests have shown satisfactory validity and reliability, the measure “position of the irst detectable resis-tance” is suggested for clinical practice since it requires the use of simpler instruments and showed higher values for the Pearson’s correlation coeicients and ICC.
Acknowledgments
his research received inancial support of the Conselho Nacional de Desenvolvimento Cientíico e Tecnológico (CNPq) and of the Fundação de Amparo à Pesquisa do Estado de Minas Gerais (FAPEMIG).
References
1. Latash ML, Zatsiorsky VM. Joint stiffness: Myth or reality? Hum Mov Sci. 1993;12(6):653-92.
2. Obusek JP, Holt KG, Rosenstein RM. The hybrid mass-spring pendulum model of human leg swinging: stiffness in the control of cycle period. Biol cybern. 1995;73(2):139-47.
3. Fonseca ST, Ocarino JM, Silva PLP, Aquino CF. Integration of stress and their relationship to the kinetic chain. In: Magee DJ, Zachazewski JE, Quillen WS, editors. Scientific foundations and principles of practice in musculoskeletal rehabilitation.St Louis: Saunders Elsevier; 2007. p. 476-86.
4. Gleim GW, Stachenfeld NS, Nicholas JA. The influence of flexibility on the economy of walking and jogging. J Orthop Res. 1990;8(6):814-23.
5. Loram ID, Maganaris CN, Lakie M. The passive, human calf muscles in relation to standing: the non-linear decrease from short range to long range stiffness. J Physiol. 2007;584(Pt 2):661-75. Epub 2007 Sep 6.
6. Salsich GB, Mueller MJ. Effect of plantar flexor muscle stiffness on selected gait characteristics. Gait Posture. 2000;11(3):207-16.
7. Moritz CT, Farley CT. Passive dynamics change leg mechanics for an unexpected surface during human hopping. J Appl Physiol. 2004;97(4):1313-22.
8. Müller R, Grimmer S, Blickhan R. Running on uneven ground: leg adjustments by muscle pre-activation control. Hum Mov Sci. 2010;29(2):299-310. Epub 2010 Mar 20.
9. Morasso PG, Sanguineti V. Ankle muscle stiffness alone cannot stabilize balance during quiet standing. J Neurophysiol. 2002;88(4):2157-62.
10. Granata KP, Padua DA, Wilson SE. Gender differences in active musculoskeletal stiffness. Part II. Quantification of leg stiffness during functional hopping tasks. J Electromyogr Kinesiol. 2002;12(2):127-35.
11. Stefanyshyn DJ, Nigg BM. Dynamic angular stiffness of the ankle joint during running and sprinting. J Appl Biomech. 1998;14(3):292-9.
12. Lindstedt SL, Reich TE, Keim P, LaStayo PC. Do muscles function as adaptable locomotor springs? J Exp Biol. 2002;205(Pt 15):2211-6.
13. Woods C, Hawkins R, Hulse M, Hodson A. The Football Association Medical Research Programme: an audit of injuries in professional football: an analysis of ankle sprains. Br J Sports Med. 2003;37(3):233-8.
14. McPoil TG, Brocato RS. The foot and ankle: biomechanical evaluation and treatment. In: Gould JA, editor. Orthopaedic and sports physical therapy. St. Louis: CV.Mosby; 1985. p. 313-41.
15. Hintermann B, Nigg BM. Pronation in runners. Implications for injuries. Sports Med. 1998;26(3):169-76.
16. Barton CJ, Levinger P, Menz HB, Webster KE. Kinematic gait characteristics associated with patellofemoral pain syndrome: a systematic review. Gait Posture. 2009;30(4):405-16.
17. Tiberio D. The effect of excessive subtalar joint pronation on patellofemoral mechanics: a theoretical model. J Orthop Sports Phys Ther. 1987;9(4):160-5.
18. Bennett JE, Reinking MF, Pluemer B, Pentel A, Seaton M, Killian C. Factors contributing to the development of medial tibial stress syndrome in high school runners. J Orthop Sports Phys Ther. 2001;31(9):504-10.
19. Willems TM, De Clercq D, Delbaere K, Vanderstraeten G, De Cock A, Witvrouw E. A prospective study of gait related risk factors for exercise-related lower leg pain. Gait Posture. 2006;23(1):91-8. Epub 2005 Jan 13.
20. Willems TM, Witvrouw E, De Cock A, De Clercq D. Gait-related risk factors for exercise-related lower-leg pain during shod running. Med Sci Sports Exerc. 2007;39(2):330-9.
21. Ocarino JM, Fonseca ST, Silva PL, Mancini MC, Gonçalves GG. Alterations of stiffness and resting position of the elbow joint following flexors resistance training. Man Ther. 2008;13(5):411-8. Epub 2007 Jun 6.
22. Klinge K, Magnusson SP, Simonsen EB, Aagaard P, Klausen K, Kjaer M. The effect of strength and flexibility training on skeletal muscle electromyographic activity, stiffness, and viscoelastic stress relaxation response. Am J Sports Med. 1997;25(5):710-6.
23. Mahieu NN, McNair P, De Muynck M, Stevens V, Blanckaert I, Smits N, et al. Effect of static and ballistic stretching on the muscle-tendon tissue properties. Med Sci Sports Exerc. 2007;39(3):494-501.
24. Chesworth BM, Vandervoort AA, Koval JJ. A pilot study to compare the subjective and objective evaluation of passive ankle joint stiffness. Physiother Can. 1991;43:13-8.
25. Lin JJ, Yang JL. Reliability and validity of shoulder tightness measurement in patients with stiff shoulders. Man Ther. 2006;11(2):146-52.
26. Gombatto SP, Klaesner JW, Norton BJ, Minor SD, Van Dillen LR. Validity and reliability of a system to measure passive tissue characteristics of the lumbar region during trunk lateral bending in people with and people without low back pain. J Rehabil Res Dev. 2008;45(9):1415-29.
27. Portney LG, Watkins MP. Foundations of clinical research: application to practice. New Jersey: Prentice Hall Health; 2000.
28. Gadotti IC, Vieira ER, Magee DJ. Importance and clarification of measurement properties in rehabilitation. Rev Bras Fisioter. 2006;10(2):137-46.
29. Winter DA. Anthropometry. In: Winter DA, editor. Biomechanics and motor control of human movement.New York: Wiley and Sons Inc.; 1990. p. 59-74.
30. Cram JR, Kasman GS, Holtz J. Electrode Placements. In: Cram JR., Kasman GS, Holtz J, editors. Introduction to surface eletromyography.Gaithersburg: Aspen Publishers, Inc.; 1998. p. 45-80.
31. Lamontagne A, Malouin F, Richards CL, Dumas F. Impaired viscoelastic behaviour of spastic plantarflexors during passive stretch at different velocities. Clin Biomech (Bristol, Avon). 1997;12(7-8):508-15.
32. Bressel E, Larsen BT, McNair PJ, Cronin J. Ankle joint proprioception and passive mechanical properties of the calf muscles after an Achilles tendon rupture: a comparison with matched controls. Clin Biomech (Bristol, Avon). 2004;19(3):284-91.
33. Baraúna MA, Canto RST, Sanchez HM, Bustamante JCF, Ventura-Silva RA, Malusá S. Validade e confiabilidade intra-indivíduo do cifolordômetro na avaliação da convexidade torácica. Rev Bras Fisioter. 2005;9(3):319-25.
34. McEwan I, Herrington L, Thom J. The validity of clinical measures of patella position. Man Ther. 2007;12(3):226-30.
35. McKenna L, Straker L, Smith A. The validity and intra-tester reliability of a clinical measure of humeral head position. Man Ther. 2009;14(4):397-403.
36. Lin HT, Hsu AT, An KN, Chang Chien JR, Kuan TS, Chang GL. Reliability of stiffness measured in glenohumeral joint and its application to assess the effect of end-range mobilization in subjects with adhesive capsulitis. Man Ther. 2008;13(4):307-16.
37. Venturini C, Ituassú NT, Teixeira LM, Deus CVO. Confiabilidade intra e interexaminadores de dois métodos de medida da amplitude ativa de dorsiflexão do tornozelo em indivíduos saudáveis. Rev Bras Fisioter. 2006;10(4):407-11.
38. Bennell KL, Talbot RC, Wajswelner H, Techovanich W, Kelly DH, Hall AJ. Intra-rater and inter-rater reliability of a weight-bearing lunge measure of ankle dorsiflexion. Aust J Physiother. 1998;44(3):175-80.
39. Bohannon RW, Smith MB. Interrater reliability of a modified Ashworth scale of muscle spasticity. Phys Ther. 1987;67(2):206-7.
40. Aquino CF, Gonçalves GGP, Fonseca ST, Mancini MC. Análise da relação entre flexibilidade e rigidez passiva dos isquiostibiais. Rev Bras Med Esporte. 2006;12(4):195-200.
41. Magnusson SP, Simonsen EB, Aagaard P, Sørensen H, Kjaer M. A mechanism for altered flexibility in human skeletal muscle. J Physiol. 1996;497 (Pt 1):291-8.
42. Wilson GJ, Wood GA, Elliott BC. The relationship between stiffness of the musculature and static flexibility: an alternative explanation for the occurrence of muscular injury. Int J Sports Med. 1991;12(4):403-7.
43. Vaz DV, Brício RS, Aquino CF, Vianna SO, Mancini MC, Fonseca ST. Alterações musculares em indivíduos com lesão do neurônio motor superior. Fisioter Pesqui. 2006;13(2):58-66.
44. Gleim GW, McHugh MP. Flexibility and its effects on sports injury and performance. Sports Med. 1997;24(5):289-99.