Article
Printed in Brazil - ©2017 Sociedade Brasileira de Química0103 - 5053 $6.00+0.00*e-mail: [email protected]
Anodic Oxidation of Sulfide to Sulfate: Effect of the Current Density on the
Process Kinetics
Paulo C. Caliari,*,a,b Maria J. Pacheco,a Lurdes F. Ciríacoa and Ana M. C. Lopesa
aFibEnTech-UBI and Department of Chemistry, Universidade da Beira Interior,
6201-001 Covilhã, Portugal
bInstituto Federal de Educação, Ciência e Tecnologia do Espírito Santo,
29106-210 Vila Velha-ES, Brazil
The kinetics of the conversion of sulide to sulfate by electro-oxidation, using a boron-doped diamond (BDD) electrode was studied. Different applied current densities were tested, from 10 to 60 mA cm-2. The results showed that the electrochemical conversion of sulide to sulfate occurs
in steps, via intermediate production of other sulfur species. The oxidation rate of the sulide ion is dependent on its concentration and current density. The reaction order varies with the current intensity, being 2 for the lower applied current intensity and high S2- concentration, which is
compatible with a mechanism involving two S2- ions to give S
22-. For higher current densities, where
current control is less important, reaction order varies from 0.15 to 0.44 for the current densities of 20 and 60 mA cm-2, respectively. For the formation of SO
42- from S2- electro-oxidation, the
reaction orders with respect to sulide concentration and current intensity are 0 and 1, respectively.
Keywords: sulide oxidation, sulfate formation, electrochemical oxidation, BDD, kinetic study
Introduction
Sulide ion is toxic, odorous and corrosive and is of particular concern in sewer systems, since it causes pipes corrosion.1,2 The presence of S2- in sewage systems is a
common problem due to the stimulation of the metabolic activity of sulfate-reducing bacteria, given the high organic load and low dissolved oxygen.3 Sulide is one of the
contaminants in efluents generated in the extraction of oil and gas and in certain types of wastes from oil reinery,4 as
well as in wastewaters from the leather industry that present high concentration in sulide ion.5 Concrete corrosion
problems have also been reported for S2- concentration
between 0.1 and 0.5 mg L-1.6
A variety of physicochemical methods, like chemical oxidation and catalytic conversion, have been used to oxidize S2- to elemental sulfur or sulfate, thus achieving
its removal from the wastewater.7 In the past, the removal
of S2- from efluents was performed by precipitation, as
ZnS, and by oxidation with chromate in alkaline media.8
However, these treatments are expensive, due to the added chemicals, and environmentally incompatible, because of
the disposal of the resulting toxic sludge. The biological oxidation to remove S2- can also be performed, but it is slow
and applies only to low S2- concentrations.4
The electrochemical processes are a promising technique for the resolution of pollution problems, since they present (i) versatility: direct or indirect oxidation, phase separation, biocides functions, treatment of many different contaminants; and (ii) energetic eficiency: electrochemical processes generally have lower temperature requirements, the potential can be controlled and electrodes and cells can be designed to minimize energy losses due to voltage drops, poor current distribution and secondary reactions.9
In the recent years, there has been a growing interest in these processes for the treatment of wastewaters containing recalcitrant and biotoxic compounds.10 The electrochemical
treatment also offers an environmentally attractive method to remove S2- ions, since the anodic oxidation of this species
produces less toxic products.11
Sulide is an electrochemically active component that can react at the anode and directly donate electrons to the electrode.7 Thus, it can be removed from the aqueous
solution without the production of sludge, by oxidation to elemental sulfur or oxyanions, like SO42-, which are
vs. pH for the various species involved in the oxidation of S2- solutions12-14 and, depending on the experimental
conditions, during the S2- oxidation several sulfur
intermediate species, such as polysulides (Sx2-, with x = 2,
3, 4, ...), dithionite, sulite, tetrathionate, and thiosulfate, can be formed.7,15-18
Ateya and Al-Kharafi19 studied the electrochemical
oxidation of sulide solutions, with concentrations between 0.001 and 0.005 mol L-1, using NaCl as supporting electrolyte,
and observed sulfur deposition on the surface of the graphite anode, a fact that was also observed later.11 According to
these authors, the continuous oxidation to sulfur oxyanions should be much slower than the oxidation of S2- to sulfur.
The formation of elemental sulfur as an intermediate in the anodic oxidation of S2- process was also evidenced in another
study20 that assigned the oscillations in the voltammograms
of the S2- electro-oxidation, at a Ti/Ta
2O5-IrO2 anode, to
the continuous formation and removals of sulfur on the electrode’s surface. Likewise, during the anodic oxidation of S2- in real and simulated wastewaters, using as anode titanium
coated with Ir/Ta oxides, the formation of elemental sulfur was also observed.21 However, the deposition of elemental
sulfur, which may lead to the electrode’s surface passivation, was not observed in the anodic oxidation of S2-, present in a
domestic wastewater, using as anodes titanium coated with different metal oxide (TaO2/IrO2: 0.35/0.65), (RuO2/IrO2:
0.70/0.30), (PtO2/IrO2: 0.70/0.30), SnO2 or PbO2.22 However,
in this study, S2- concentration was 10 mg L-1 and in the
previous case21 ranged between 30 and 90 mg L-1. Thus, the
formation and deposition of sulfur seems to be inluenced by the S2- concentration. The electrochemical oxidation of S
2-was also performed by Waterston et al.,8 using a boron-doped
diamond (BDD) anode, and it was found that its conversion to SO42- occurred almost quantitatively with a current eficiency
of 90%. This situation seems to show the best performance of this electrode material, BDD, when compared to others. In fact, the eficacy of the electrochemical oxidation depends strongly on the electrode materials. According to Panizza and Cerisola,23 complete oxidation and good energetic
eficiency can only be obtained at high oxygen overpotential anodes, such as boron-doped diamond, BDD. This electrode material presents great features, namely, higher chemical inertness, greater current eficiencies, longer lifetime and higher overpotential for oxygen evolution than that of other conventional anodes. It also enables the production of large amounts of weakly adsorbed •OH, which leads to an eficient
oxidation of the pollutants, at the anode’s surface or in its vicinity.23,24
The electrochemical oxidation of S2- can be achieved
by direct oxidation, at the electrode surface, or by indirect oxidation, through oxidizing agents like •OH, O
2 and
chlorine active species generated at the anode surface.21 The
oxidation can be controlled by mass transfer or by electrons transfer, from the sulide ion to the surface of the anode.19
Thus, the removal of S2- via electro-oxidation may show
different trends regarding the experimental conditions. Zero-order kinetics (kinetic control) was observed in the presence and in the absence of NaCl during the oxidation of S2- at BDD.8 These results are signiicantly different
from those obtained in the oxidation of S2- using a Ti/IrO 2
-Ta2O5 anode, with kinetic orders ranging from 0.5 and 0.9.4
The feasibility of S2- electro-oxidation was also observed
in the electrolysis of a tannery wastewater with Ti/MO (MO = metal oxide) anodes, without, however, being identiied the formed intermediates.25
Despite the studies found in the literature describing the S2- anodic electro-oxidation, only a few are focused on
the electro-oxidation of sulide to sulfate.8 Also, in these
few studies low sulide concentration was used, with low assay duration and small range of applied current density. This situation limits the understanding of the kinetics of the conversion sulide/sulfate. Thus, the objective of this study was to evaluate the effect of the current density on the kinetics of the conversion of sulide into sulfate, by anodic oxidation at a BDD electrode, using high sulide concentration.
Experimental
Chemicals
The following analytical grade reagents were used without further purification: hydrated sodium sulfide, Na2S.9H2O, 99.4%, Merck; hydrochloric acid, HCl,
37%, Sigma-Aldrich; sulfuric acid, H2SO4, 98%, VWR
Chemicals; sodium hydroxide, NaOH, 98%, Panreac Chemical UAA; soluble starch, ACS, Riedel-de Haen; penta-hydrate sodium thiosulfate, Na2S2O3.5H2O, 99.5%,
Merck; potassium hydrogen biodate, KH(IO3)2, ACS,
99.8%, Merck; potassium iodide, KI, 99%, ACS, Carlo Erba; iodine, I2, ACS, 99.8%, Riedel-de Haen.
Electrochemical characterization of sulfide solutions
Sulfide aqueous solutions, 60 mmol L-1, were
characterized by cyclic voltammetry, in a one-compartment three electrode cell, utilizing as working electrode a BDD electrode, purchased from Adamant Technologies, now NeoCoat (0.15 cm2 working area), as counter electrode
a platinum plate (1 cm2) and as reference electrode a
commercial saturated Ag/AgCl, KClsat electrode. The
galvanostat VoltaLab PGZ 301 at scan rates of 10, 100, and 1000 mV s-1.
Electrodegradation assays
Electrochemical experiments were performed in an one-compartment cell, working in batch mode with stirring, with a 10 cm2 BDD electrode (purchased from
Adamant Technologies, now NeoCoat) as the anode and a 10 cm2 stainless steel plate as the cathode, with a 1 cm
inter-electrodes gap. Current densities varied from 10 to 60 mA cm-2 and were imposed by a power supply unit,
Laboratory DC Power Supply, Model GPS-3030D (0-30 V, 0-3 A). Stirring was accomplished by a magnetic stirrer, Metrohm AG.
The Na2S solutions, 500 mL, with S2- concentration
of 1953 ± 49 mg L-1 (approximately 60 mmol L-1) were
electrolyzed in an open system, during the proposed experimental periods. The run time was 42 h for the applied current densities of 10 mA cm-2, 20 h for 20,
30 and 40 mA cm-2, 17 h for 50 mA cm-2, and 15 h for
60 mA cm-2. Samples were collected hourly for analyzes.
The determination of S2- concentration was performed
according to APHA,26 method 4500-S2-. The presence
of sulfur on the surface of BDD was investigated by scanning electron microscopy and energy dispersive X-ray spectroscopy analysis (SEM/EDS), performed in a Hitachi (S-3400N)/Oxford (60-74) system operating at 20 keV. The concentration of SO42- was determined by
ion chromatography, using a Shimadzu 20A Prominence HPLC system that was equipped with a conductivity detector CDD 10Avp. An IC I-524A Shodex (4.6 mm i.d. × 100 mm) column was employed. The mobile phase consisted of a 2.5 mmol L-1 phthalic acid aqueous solution
with 2.3 mmol L-1 of tris(hydroxymethyl) aminomethane,
at a low rate of 1.5 mL min-1. The column temperature
was 40 °C. All solutions for the chromatographic analysis were prepared with ultrapure water obtained with Milli-Q®
equipment. Electrical conductivity was measured with a Mettler Toledo conductivity meter, SevenEasy S30K, and pH with a Hanna pH meter, HI 931400.
Results and Discussion
Sulfur and polysulfides: production and features
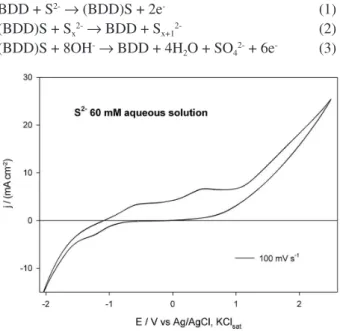
Figure 1 presents a cyclic voltammogram run with a 60 mmol L-1 sulide aqueous solution at a scan rate of
100 mV s-1. Several peaks can be observed, analogous
to what had already been observed by Al-Kharai et al.27
with a Pt working electrode. These authors have observed
3 consecutive peaks at −0.1, 0.475 and 1.0 V, which were assigned, respectively, to the following electrode processes: hydrogen sulide oxidation to sulfur, followed by the partial formation of polysulide species, which are oxidized to sulfate at higher potentials. Thus, when BDD is the working electrode, the 3 peaks observed in the oxidation curve of the voltammogram presented in the Figure 1 can be assigned to the next processes: sulide oxidation to sulfur, at BDD surface (equation 1); formation of different polysulide species (equation 2); and oxidation of the polysulide species to sulfate (equation 3) that happens only at higher potentials, reached only for higher applied current densities.
BDD + S2-→ (BDD)S + 2e- (1)
(BDD)S + Sx2-→ BDD + Sx+12- (2)
(BDD)S + 8OH-→ BDD + 4H
2O + SO42- + 6e- (3)
The formation of sulfur on the surface of the BDD anode was conirmed by SEM/EDS analysis (data not shown) and was due to the occurrence of equation 1.14,27
The extent of this reaction was directly associated to the current intensities utilized, i.e., the formation of sulfur on the surface of the anode increased with the applied current density from 10 to 60 mA cm-2.
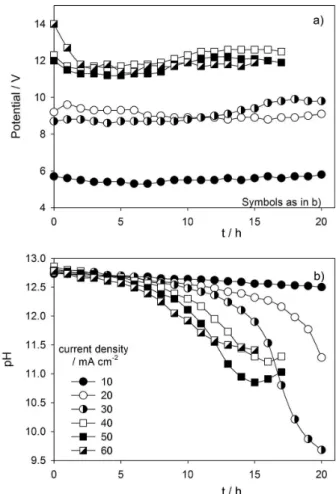
During the assays performed at 10, 20 and 30 mA cm-2
no signiicant variation of the potential was observed, whereas for the assays performed at 40, 50 and 60 mA cm-2
the potential decreased in the beginning of the assays and slightly increased after some time, as can be seen in Figure 2a.
For higher current densities, the initial decrease in the potential must be related to an increase in the formation rate of sulfate rather than sulfur, which would also be responsible for a partial passivation of the electrode’s surface. This passivation may explain the slight increase
Figure 1. Cyclic voltammogram for the system BDD (0.15 cm2) /
in the potential at 20 and 30 mA cm-2 at the beginning
of the assays, since at low current densities reactions involving less electrons transfer become more important (equation 1). Similar results were also obtained by other authors.4,7,8,11,14,19,20,27,28 However, at low current density,
10 mA cm-2, and low S2- concentration, 10 mg L-1, the
presence of elemental sulfur was not observed.22
In this study, besides the formation of sulfur on the anode’s surface, it was also observed the development of a yellow color in the solution. According to the literature,4,8,11,17,27 this phenomenon was related with the
formation of polysulides, Sx2-. The formed sulfur can
react with Sx2- to form Sx+12- (equation 2),14,27 which can
be further oxidized (equations 4-6),12 resulting in a color
intensiication.11
3S22-→ 2S32- + 2 e- (4)
4S32-→ 3S42- + 2 e- (5)
5S42-→ 4S52- + 2 e- (6)
Regarding pH variation during the assays performed at different applied current density (Figure 2b), all initial
solutions presented pH values between 12.7 and 12.9, which decreased during the experiment. The results showed that the pH decay appeared to be directly related to the applied current density, particularly during the irst 10 hours of the experiments.
The decrease in pH is associated with the occurrence of several possible reactions, such as those shown in equations 3 and 7 to 10, since the S2- consumption is
accompanied by OH- consumption.14
4S2- + 12OH-→ S
4O62- + 6H2O + 18e- (7)
S2- + 6OH-→ SO
32- + 3H2O + 6e- (8)
2S2- + 6OH-→ S
2O32- + 3H2O + 8e- (9)
S2- + 8OH-→ SO
42- + 4H2O + 8e- (10)
The intermediate species, eventually formed, may be involved in further reactions, equations 11 to 13,14 which
can contribute to the consumption of OH-, thus lowering
also the pH.
S2O32- + 10OH-→ 2SO42- + 5H2O + 8e- (11)
S4O62- + 20OH-→ 4SO42- + 10H2O + 14e- (12)
SO32- + 2OH-→ SO42- + H2O + 2e- (13)
Another possible scenario is associated with equations 14 to 16, where H+ is a product, with the consequent decrease
in pH.12 Also, all the reactions that lead to a decrease in
the S2- concentration induce the displacement of equation
17 to produce S2- with OH- consumption, intensifying the
decrease in pH.29
2S2- + 3H
2O → S2O32- + 6H+ + 8e- (14)
S2- + 3H
2O → SO32- + 6H+ + 6e- (15)
S2- + 4H
2O → SO42- + 8H+ + 8e- (16)
HS- + OH- S2- + H
2O (17)
After 10 hours for the assay performed at an applied current density of 60 mA cm-2, 15 h for 50 mA cm-2, and
16 h for 40 mA cm-2, i.e., when S2- concentration was
already very low, it was observed a slight increase in the pH (Figure 2b). This situation may result from the reduction at the cathode of some intermediate species generated during the process (equations 18 and 19).30
2SO32- + 3H2O + 4e- → S2O32- + 6OH- (18)
2SO32- + 2H2O + 2e-→ S2O42- + 4OH- (19)
Sulfide removal: effect of current density and kinetic aspects
Regarding the sulide removal, the results showed that it is strongly inluenced by the applied current density
Figure 2. (a) Variation of potential difference between anode and cathode with time and (b) variation of pH with time for the assays performed at different applied current densities. [S2-]
(Figure 3a). The efficiency of the electro-oxidation process, expressed as sulide removal versus electrical charge passed, at the different applied current densities, is depicted in Figure 3b, showing a decrease in eficiency with the increase in applied current due to an increase in the relevance of the diffusional step. After 8 h of electrolysis, sulide removals were 34.3, 84.8, 97.8, 99.8, 99.2 and 99.4% for the applied current densities of 10, 20, 30, 40, 50 and 60 mA cm-2, respectively. However, if it is
considered the time needed to remove 50% of the initial S2- (inset of Figure 3b), the results showed that increasing
current density does not decrease substantially the time needed to achieve the desired removal, particularly for current densities between 40 and 60 mA cm-2, since for
these current densities the time decreases from 6.2 to 4.9 h. Nevertheless, when the density increases from 10 to 40 mA cm-2, the time to achieve 50% removal in [S2-]
is reduced from 29.8 to 6.2 h. The inluence of the current density on the S2- consumption is shown by the occurrence
of, for instance, equations 1 and 7 to 10, since the increase
in current density tends to enhance the occurrence of these reactions, having also inluence on their relative occurrence. Kinetic models based on kinetic control (i.e., current control, with reaction rate independent of S2- concentration)
and diffusion control (reaction rate dependent on S
2-concentration) were tested, to verify the kinetics of S
2-decay. To ind the equations that best it the experimental data, the model of partial order was used,31 where the
reaction rate is made proportional to [S2-]n and dependent on
the applied current, as represented in equations 20 and 21.
reaction rate = k[S2-]nim (20)
(21)
where k is the kinetic constant, [S2-] is the S2- concentration
in mg L-1, i is the current intensity in A, t is the time in h, and
n and m are partial reaction orders. Since in each test both the current intensity and the n value remained constants throughout the electrolysis, equations 20 and 21 can take
Figure 3. Sulide removal at different applied current densities: (a) variation of the [S2-] with time; (b) variation of the sulide removal with the electrical
charge delivered; inset of (b) time needed for the removal of 50% S2- initial concentration; (c) and (d) [S2-]1−n experimental data versus time and ittings to
the experimental data (equation 21) at different applied current densities. [S2-]
the form of equations 22 and 23, respectively, being k’ a pseudo kinetic constant.
reaction rate = k’[S2–]n (22)
(23)
The analysis of [S2-]1-nversus time, at constant current
density, were carried out by varying n in steps of 0.01, until the best correlation factor was obtained for each applied current density. For the experiments run with 60 mmol L-1
sulide initial concentration, at different current densities, the optimal n values and the itted equations are presented in Table 1 and Figures 3c and 3d.
The different orders found for the different applied current densities suggest that the kinetics of the S2-
oxidation is strongly inluenced by the current density. For 10 mA cm-2, the results showed a second-order reaction
related to S2-. This behavior can be explained if it is assumed
that the system was on kinetic control and the low low of electrons gives priority of reactions involving few electrons, i.e., equations 1 and 2. The presence in these reactions of two S2- species as reagent may explain the second order
kinetics experimentally observed for the lowest applied current density, when the process is controlled by current and the most probable reactions are those involving few electrons. However, if data for the irst 3 h of the assay run at 10 mA cm-2 are excluded, a straight line between
of [S2-] versus time could be adjusted, pointing to a zero
order reaction, i.e., reaction rate independent of the [S2-].
The increase in current density to the double, 20 mA cm-2,
reduces the current control and gives more relevance to the S2- diffusion. A further increase in the current density
leads to an increase in the reaction order, showing that the system tends to be controlled by diffusion. A value for the reaction order that is different from an integer is typically indicative of a complex mechanism that, in this case, must be the result of the different extent of several possible reactions, where S2- is consumed; and a competition by the
intermediate species for the electric charges (equations 4 and 11 to 13), among others.
Considering the various possibilities for the S
2-oxidation, regarding the possible species formed, it was evaluated the behavior of S2- during the oxidation process
in relation to the SO42- formation for the two extremes
situations: a: transfer of 2 electric charges: oxidation of S
2-to S, equation 1; b: transfer of 8 electric charges: oxidation of S2- to SO
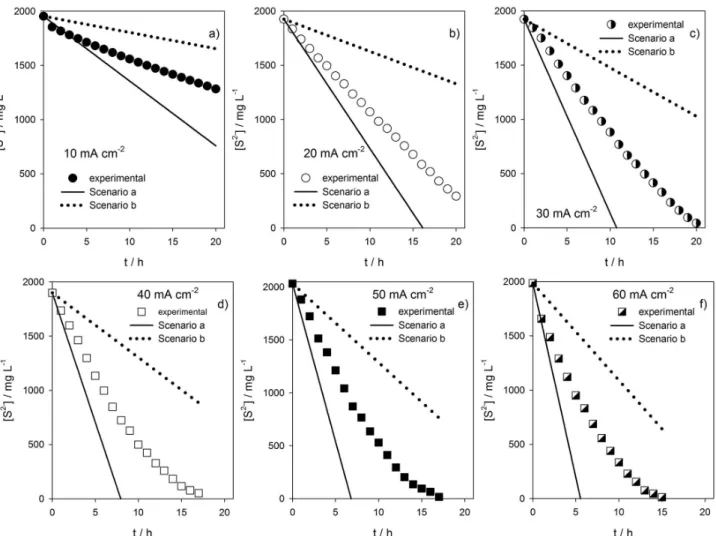
42-, equations 10 or 16. Figure 4 presents the
theoretical decays in [S2-] if only extremes scenarios a and b
were possible, as well as the real scenario. Scenarios a and b were calculated using the respective current intensities and Coulomb’s law (equation 24).
q = it (24)
where q is the electric charge, in C, and t is in s. According to Figures 4a to 4f, the decrease in the S2- concentration
showed intermediate behavior between the exclusive formation of elemental sulfur and the direct formation of SO42-, i.e., the oxidation of S2- occurs in steps in which the
intermediate oxygenated species are formed and oxidized gradually to SO42-. If there was a direct oxidation to SO42-,
the decrease in S2- concentration would be less effective;
on the other hand, if there was only oxidation of S2- to
elemental sulfur, the decay of the S2- concentration would
be dramatically higher. So, the reaction pathway involves the occurrence of the reactions described by equations 2 and 4 to 6, where the sulfur formed on the surface of BDD reacts with the S2- producing S
x2-. In fact, the formation of
Sx2- was observed, since the liquid phase presented a yellow
color. However, polysulides produced are consumed, producing SO42- as a inal step, which explains the loss in
the yellow coloration.
Sulfate formation
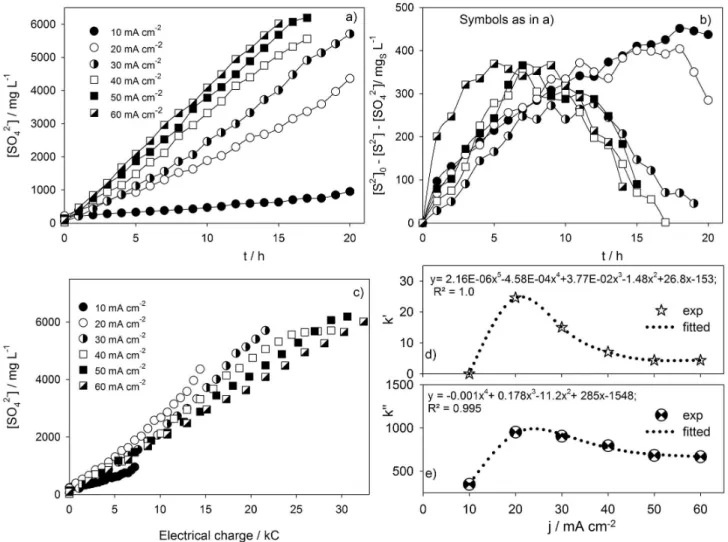
Regardless of the applied current density, in all assays there was the formation of SO42-. However, its formation
rate is strongly inluenced by the current density, following a linear trendline, as can be seen in Figure 5a for the initial S2- concentration of 60 mmol L-1. The linear equations
adjusted to the experimental data up to the ifteenth hour of the assay are presented in Table 2.
The S2- oxidation to SO
42- can happen either by direct
oxidation (equations 10 or 16) or by indirect reactions (equation 15 followed by 13), and the greater the availability of electrons, the higher the sulfate formation rate. To better understand the formation of SO42- from the oxidation of S2-,
equation 25 was adjusted to the experimental data obtained for the SO42- formation rate, being assumed that SO42- is
Table 1. Reaction pseudo-orders for the kinetics of the [S2-] decay at different current densities
j / (mA cm-2) 10 20 30 40 50 60
obtained from S2- oxidation and neglecting the formed
intermediates.
(25)
where k’’ is a kinetic pseudo-constant for the sulfate formation, n’ and m’ are the reaction order for [S2-] and
for current intensity, respectively. By applying natural
logarithm to equation 25 and using the Solver tool from Excel, the values of k’’, n’ and m’ were calculated, using the experimental data for the variation of [SO42-] and [S2-] with
time. The obtained values are presented in Table 2, except for n’ that is equal to zero for all the applied current densities tested, and it can be observed that the sulfate formation is only dependent on the current density. Lower current densities originate lower SO42- formation yield due to the
current control and to the accumulation of intermediate
Figure 4. Variation of S2- concentration with time in different scenarios: experimental (symbols); oxidation through equation 1 (scenario a); and oxidation
through equations 9 or 15 (scenario b). Applied current densities of (a) 10; (b) 20; (c) 30; (d) 40; (e) 50 and (f) 60 mA cm-2. [S2-]
o= 60 mmol L-1.
Table 2. Variation of sulfate concentration, in mg L-1, with time, in h, and kinetic data (equation 25) for the formation of SO
42- from S2- electro-oxidation,
for different applied current densities
j / (mA cm-2) Adjusted equations R2 k’’ / (mg L-1 h-1 A-1) m’
10 [SO42-] = 30.47t + 178.6 0.990 348 1.05
20 [SO42-] = 178.6t + 128.6 0.993 951 1.00
30 [SO42-] = 264.6t – 146.3 0.992 905 1.00
40 [SO42-] = 342.5t – 96.94 0.996 794 1.00
50 [SO42-] = 374.5t + 3.217 0.998 682 1.00
60 [SO42-] = 400.1t + 74.70 0.999 667 1.04
species, such as S22-, S32-, SO32-, S2O32-, and others. To ind
out the amount of other sulfur oxidized species, different from SO42-, the variation of ([S2-]0 − [S2-] − [SO42-]) was
plotted against time (Figure 5b), showing that the oxidation of S2- may involve the formation of different species,
besides the direct conversion into SO42-.
In fact, the oxidation conducted at 10 mA cm-2
showed the greatest differences in the mass balances, and persistently, indicating that the direct conversion of S2- into SO
42- via anodic oxidation tends to present greater
dificulties, due to the competition with the intermediate species for the available electrons. For 20 mA cm-2, the
mass balance showed that consumption of S2- was also
followed by intense formation of intermediate species, with the maximum difference between the expected and the total sulfur formed at 18 h of run. Regarding the results for 30 mA cm-2, the mass balance shows low oxidation to
SO42- until 7 h. Between 7 and 12 h, the accumulation of
intermediates remained approximately constant, indicating
an increase in their oxidation rate probably due to the decrease in the [S2-] after the 12 h of assay. Concerning
40 and 50 mA cm-2, the trendlines are similar to the ones
obtained with the assays performed at 20 and 30 mA cm-2.
This similarity in the intermediate species concentration between applied current densities of 20 and 50 mA cm-2
does not necessarily mean that the rate of SO42- formation
is equal, because [S2-] decay increases with current density
and, consequently, if the intermediates concentration remains constant, the SO42- formation must be higher for
the highest applied current density. The highest current density used in the last test, 60 mA cm-2, showed a slightly
different behavior. Apparently, this high current intensity promoted more intense oxidation of S2- in the irst hours,
i.e., generating appreciable concentrations of intermediate sulfur species. As can be seen in Figure 5b, at 5 h it was achieved the maximum concentration of those species, intensifying the competition between them and S2-. After
5 h run, an enhancement in the oxidation rate of the
Figure 5. (a) Evolution in time of the SO42- formation for different applied current density; (b) evolution in time of the sulfur species other than sulide or
sulfate, for different applied current densities; (c) variation of the sulfate formation with the electrical charge delivered; (d) reaction pseudo-kinetic constants for the electro-oxidation of S2- and (e) for the formation of SO
intermediates species or a reduction on their formation rate is observed. The current eficiency for the formation of sulfate from sulide oxidation is depicted in Figure 5c, being the lowest eficiency observed for 10 mA cm-2, probably
because reactions involving lower number of electrons are favored, leading to low sulfate formation rate. On the other hand, the highest current eficiency regarding sulfate formation is observed for 20 mA cm-2, since this must be
the lowest current density that maintains the process in diffusional control, but with low oxygen evolution. For current density higher than 20 mA cm-2, the process is
clearly in diffusional control, wasting part of the applied current in oxygen evolution, which increases with applied current.
The inluence of the applied current density on the direct formation of sulfate from sulide can also be visualized in Figures 5d and 5e, where the pseudo-kinetic constants k’ and k’’, obtained from data presented on Figures 3c and 3d, and Table 2, are plotted against the current density. If data for 10 mA cm-2 is excluded, it can be observed that the
decay in [S2-] is less inluenced by changes in the applied
current density than the sulfate formation rate, meaning that an increase in the current density will increase mainly the conversion of the intermediate species to sulfate rather than the oxidation of sulide to intermediate species. The k’ and k’’ values for 10 mA cm-2 can be explained by the low
current intensity that greatly increases the current control.
Conclusion
The obtained results have proved that sulide can be eficiently converted to sulfate by electrochemical oxidation using a BDD anode and that the process can be used to eficiently remove sulide from efluents, even when its concentration is high. The following conclusions were also obtained: (i) oxidation of S2- to SO
42- occurs in stages,
characterized by the formation of sulfurous intermediate species, oxygenated or not, whose concentration tends to be lower with the increase in the applied current density. (ii) The oxidation of S2- does not follow a single pathway,
being dependent on the applied current density and presenting order 2 for the lower applied current density, which is compatible with a mechanism involving two S
2-ions to give S22-. For higher applied current densities, where
the current control is less important, the reaction order varies from 0.15 to 0.44 for the applied current densities of 20 and 60 mA cm-2, respectively. (iii) The formation of
SO42- is strongly inluenced by the applied current density,
probably due to the involvement of hydroxyl radicals, and it is not dependent on the sulide concentration.
Acknowledgments
The authors are much grateful to Coordenação de Aperfeiçoamento de Pessoal de Ensino Superior, CAPES, for inancing the PhD grant (Bolsista da CAPES, Proc. No. BEX 0714/13-5). Authors also want to acknowledge Fundação para a Ciência e a Tecnologia for the project PEst-OE/CTM/UI0195/2014 of the FibEnTech Research Unit.
References
1. Cai, J.; Zheng, P.; Bioresour. Technol. 2013, 128, 760.
2. Park, K.; Lee, H.; Phelan, S.; Liyanaarachchi, S.; Marleni, N.; Navaratna, D.; Jegatheesan, V.; Shu, L.; Int. Biodeterior. Biodegrad. 2014, 95, 251.
3. Garcia-de-Lomas, J.; Corzoa, A.; Portillo, M. C.; Gonzalez, J. M.; Andrades, J. A.; Saiz-Jimenez, C.; Garcia-Robledo, E.; Water Res. 2007, 41, 3121.
4. Haner, J.; Bejan, D.; Bunce, N. J.; J. Appl. Electrochem. 2009, 39, 1733.
5. Murugananthan, M.; Raju, G.; Prabhakar, S.; J. Hazard. Mater. 2004, 109, 37.
6. Zhang, L.; Schryver, P.; Gusseme, B.; Muynck, W.; Boon, N.; Verstraete, W.; Water Res. 2008, 42, 1.
7. Dutta, P. K.; Rabaey, K.; Yuan, Z.; Keller, J.; Water Res. 2008, 42, 4965.
8. Waterston, K.; Bejan, D.; Bunce, N. J.; J. Appl. Electrochem. 2007, 37, 367.
9. Rajeshwar, K.; J. Appl. Electrochem. 1994, 24, 1077. 10. Panizza, M.; Cerisola, G.; Environ. Sci. Technol. 2004, 38,
5470.
11. Ateya, B. G.; Al-Kharai, F. M.; Abdallah, R. M.; Al-Azab, A. S.; J. Appl. Electrochem. 2005, 35, 297.
12. Valensi, G.; Van, J. M.; Pourbaix, M. In Atlas d’Équilibres Électrochimiques a 25 °C; Pourbaix, M.; Zubov, N.; Van, J. M., eds.; Gauthier-Villars: Paris, 1963, ch. 4, section 4.19, p. 540. 13. Druschel, G. K.; Hamers, R. J.; Banield, J. F.; Geochim.
Cosmochim. Acta 2003, 67, 4457.
14. Awe, S. A.; Sundkvist, J. E.; Sandström, Å.; Miner. Eng. 2013, 53, 39.
15. Greenwood, N. N.; Earnshaw, A.; Chemistry of the Elements; Pergamon Press: Oxford, 1984.
16. Zopi, J.; Ferdelman, T. G.; Fossing, H.; Geol. Soc. Am., Spec. Pap. 2004, 379, 97.
17. Kleinjan, W. E.; Keizera, A.; Janssen, A. J. H.; Water Res. 2005, 39, 4093.
18. Ensai, A. A.; Soleymani, H. A.; Mirmomtaz, E.; Microchem. J. 2008, 89, 108.
19. Ateya, B. G.; Al-Kharai, F. M.; Electrochem. Commun. 2002, 4, 231.
21. Pikaar, I.; Rozendal, R. A.; Yuan, Z.; Keller, J.; Rabaey, K.; Water Res. 2011a, 45, 2281.
22. Pikaar, I.; Rozendal, R. A.; Yuan, Z.; Keller, J.; Rabaey, K.; Water Res. 2011b, 45, 5381.
23. Panizza, M.; Cerisola, G.; Chem. Rev. 2009, 109, 6541. 24. Anglada, A.; Urtiaga, A.; Ortiz, I.; J. Chem. Technol. Biotechnol.
2009, 84, 1747.
25. Szpyrkowicz, L.; Kaul, S. N.; Neti, R. N.; Satyanarayan, S.; Water Res. 2005, 39, 1601.
26. APHA; Standard Methods for the Examination of Water and Wastewater, 21st ed.; American Public Health Association,
Washington, 2005.
27. Al-Kharai, F. M.; Saad, A. Y.; Ateya, B. G.; Ghayad, I. M. C.; Mod. Appl. Sci. 2010, 4, 2.
28. Hastie, J.; Bejan, D.; Bunce, N. J.; Can. J. Chem. Eng. 2011, 89, 948.
29. Rysselberghe, P. V.; Gropp, A. H.; J. Chem. Educ. 1944,21, 96. 30. Milazzo, G.; Caroli, S.; Sharma, V. K.; Tables of Standard
Electrode Potentials; Wiley: Chichester, 1978.
31. Li, S.; Bejan, D.; McDowell, M. S.; Bunce, N. J.; J. Appl. Electrochem. 2008, 38, 151.
![Figure 3. Sulide removal at different applied current densities: (a) variation of the [S 2- ] with time; (b) variation of the sulide removal with the electrical charge delivered; inset of (b) time needed for the removal of 50% S 2- initial concentration;](https://thumb-eu.123doks.com/thumbv2/123dok_br/19001173.463790/5.892.98.823.533.1053/figure-different-densities-variation-variation-electrical-delivered-concentration.webp)
![Table 1. Reaction pseudo-orders for the kinetics of the [S 2- ] decay at different current densities](https://thumb-eu.123doks.com/thumbv2/123dok_br/19001173.463790/6.892.67.789.1061.1105/table-reaction-pseudo-orders-kinetics-different-current-densities.webp)