Authors
Jorge Paulo Strogoff de Matos1
Jorge Reis Almeida1 Adrian Guinsburg2 Cristina Marelli2 Ana Beatriz Lesqueves Barra3
Marcos Sandro Vasconcellos3 Eufrônio José D’Almeida Filho3 Marcos Hoette3 Frederico Ruzany3 Jocemir Ronaldo Lugon1
1Division of Nephrology,
Faculdade de Medicina, Universidade Federal Flu-minense, Niterói, Brazil.
2Fresenius Medical Care,
Buenos Aires, Argentina.
3Frenenius Medical Care,
Rio de Janeiro, Brazil.
Submitted on: 22/06/2011 Approved on: 09/08/2011
Correspondence to: Jorge Paulo Strogoff de Matos
Hospital Universitário Antônio Pedro Centro de Diálise e Transplante Avenida Marquês do Paraná, 303 Centro Niterói – RJ – Brasil CEP 24033-900
E-mail: [email protected]
Conlicts of interest: A.G., C.M., A.B.L.B., M.S.V., and E.J.D.F are employees of Fresenius Medical Care.
R
ESUMOO Brasil tem o terceiro maior contin-gente de pacientes em hemodiálise (HD) no mundo. Todavia, pouco conhece-se sobre a taxa de sobrevida e os preditores do risco de mortalidade nessa população, que são os objetivos deste estudo. Um to-tal de 3.082 pacientes incidentes em HD, de 2000 a 2004, em 25 unidades de diá-lise distribuídas por 7 dos 26 estados do Brasil, foi acompanhado até 2009. Os pa-cientes tinham entre 52 ± 16 anos de idade, 57,8% eram homens e 20,4%, diabéticos. O desfecho primário foi de mortalidade por todas as causas. Os dados foram cen-surados aos cinco anos de seguimento. A taxa global de sobrevida em cinco anos foi de 58,2%. No modelo proporcional de Cox, as variáveis associadas ao risco de óbito foram: a idade (risco relativo – RR = 1,44 por década; p < 0,0001), dia-betes (RR = 1,51; p < 0,0001), albumina sérica (RR = 0,76 por g/dL; p = 0,001), creatinina (RR = 0,92 por mg/dL; p < 0,0001) e fósforo (RR = 1,06 por mg/dL; p = 0,04). Os resultados mostram que a taxa de mortalidade em HD nesta coorte brasileira foi relativamente baixa, mas a população é mais jovem e com prevalên-cia de diabetes mais baixa do que aquela descrita nos países desenvolvidos.
Palavras-chave: Diálise Renal. Análise de Sobrevida. Insuficiência Renal Crônica. Estudos de Coortes. Hemodiálise. Mortalidade.
A
BSTRACTBrazil has the third largest contingent of patients on maintenance hemodialysis (HD) worldwide. However, little is known regarding survival rate and predictors of mortality risk in that population, which are the purposes of this study. A total of 3,082 patients incident on HD, from 2000 to 2004, at 25 dialysis facilities distribut-ed among 7 out of 26 states of Brazil were followed-up until 2009. Patients were 52 ± 16 years-old, 57.8% men, and 20.4%, diabetics. The primary outcome was all causes of mortality. Data were censored at five years of follow-up. The global five-year survival rate was 58.2%. In the Cox proportional model, variables associated with risk of death were: age (hazard ratio – HR = 1.44 per decade, p < 0.0001), dia-betes (HR = 1.51, p < 0.0001), serum albu-min (HR = 0.76 per g/dL, p = 0.001), crea-tinine (HR = 0.92 per mg/dL, p < 0.0001), and phosphorus (HR = 1.06 per mg/dL, p = 0.04). The present results show that the mortality rate on HD in this Brazilian cohort was relatively low, but the popula-tion is younger and with a lower preva-lence of diabetes than the ones reported for developed countries.
Keywords: Renal Dialysis. Survival Analysis. Renal Insufficiency, Chronic. Cohort Studies. Hemodialysis. Mortality.
Avaliação da sobrevida de cinco anos em hemodiálise no
Brasil: uma coorte de 3.082 pacientes incidentes
Assessment of a ive-year survival on hemodialysis in Brazil: a
cohort of 3,082 incident patients
I
NTRODUCTIONDeveloped countries are the virtually source of all epidemiological studies re-garding outcomes of patients on hemo-dialysis (HD). Most nephrologists in
Brazil has the third largest contingent of patients on maintenance HD worldwide.2 However, little is
known regarding survival rate and predictors of mor-tality risk in that population. It is estimated that about 70,000 patients are on maintenance HD and 8,000 on peritoneal dialysis in the country.3 Previous
stud-ies suggest important differences between the profile of the population on HD, in Brazil, and the one in developed countries.1,3-5
The objectives of the present study were to draw the profile of a large HD population in a develop-ing country, and to define the long-term predictors of death risk in this setting.
M
ETHODSThis is a retrospective analysis of all incident patients on HD at every dialysis center franchised by Fresenius Medical Care in Brazil, from January 1, 2000 to June 30, 2004. The 25 dialysis facilities were distributed among 7 out of 26 states of Brazil: Rio de Janeiro (n = 13), Brasília (n = 3), Ceará (n = 3), Pernambuco (n = 2), Piauí (n = 2), Minas Gerais (n = 1), and São Paulo (n = 1). Patients included in this study were followed-up until June 30, 2009. Data were censored at five years of follow-up. Primary outcome was all cause mortality. Patients younger than 18 years-old and those who died before 90 days on HD were excluded from the analysis.
DATA SOURCE
Data were extracted from Latin America Fresenius Medical Care database. Information at every dialy-sis facility were collected using the same electronic record, which was called Fresenius Medical Care Register, and was monthly sent to the headquarter of the Registry in Buenos Aires, Argentina. Demographic, clinical and laboratory data, on a monthly basis, from all patients, were collected.
STATISTICAL ANALYSIS
Continuous variables were expressed as mean ± stan-dard deviation or median and interquartiles range. Categorical variables were presented as frequencies. The survival rate was calculated by Kaplan-Meier method; curves were compared by the Log-Rank test. Hazard ratio for death was estimated by a Cox pro-portional model with adjustment for demographic, clinical, and laboratory variables. Only laboratory variables that showed p-values lower than 0.10 in the univariate assessment were included in the multivari-ate analysis. At the end, p-values lower than 0.05 were
considered significant. The software SPSS, version 18.0 for Windows, was used for statistical analysis.
R
ESULTSA total of 3,221 incident patients were initially in-cluded in this analysis, but 77 were exin-cluded due to missing data, and 62 were younger than 18 years-old. The baseline characteristics of the remaining 3,082 patients are presented in Table 1. Patients were 52 ± 16 years-old, 57.8% were men and 20.4% were diabetics. The prevalence of hepatitis C and B and human immunodeficiency virus (HIV) posi-tive serology were 4.2, 1.3 and 0.5%, respecposi-tively. Native arteriovenous fistula, graft and double-lumen catheter were the initial vascular access in 50.2, 0.4 and 49.4% of patients, respectively. However, such
Table 1 CHARACTERISTICSOFTHEINCIDENTPATIENTS
(n = 3,082)
Gender (% males) 57.8
Age (years-old) 52 ± 16
< 40 (%) 22.1
40 to 49 (%) 20.5
50 to 59 (%) 22.9
≥ 60 (%) 34.5
Primary renal disease (%)
Diabetic Nephropathy 20.4
Hypertensive Nephrosclerosis 17.9
Chronic Glomerulonephritis 8.5
Others 18.6
Unknown 34.6
Body mass index (kg/m2) 22.7 ± 4.4
Positive anti-HCV (%) 4.2
Positive HBsAg (%) 1.3
Positive HIV (%) 0.5
Hematocrit (%) 30.6 ± 6.2
Serum albumin (g/dL) 3.8 ± 0.5
Creatinine (mg/dL) 8.2 ± 3.0
Phosphorus (mg/dL) 5.0 ± 1.7
Calcium (mg/dL) 9.0 ± 1.1
Intact PTH (pg/mL) 154 (49 – 272)
for each decade increment. Five-year survival rates for patients < 40 years-old, 40 to 49 years-old, 50 to 59 years-old and ≥ 60 years-old were 83.5, 73.5, 54.3 and 37.9%, respectively (Figure 2). Serum albu-min values at entrance were available in 2,846 cases (92.3%). Patients with serum albumin below the me-dian (3.8 g/dL) at initiation of dialysis also presented survival rates lower than those with serum albumin ≥ 3.8 g/dL (52.5 versus 66.0%; p < 0.0001), as seen in Figure 3.
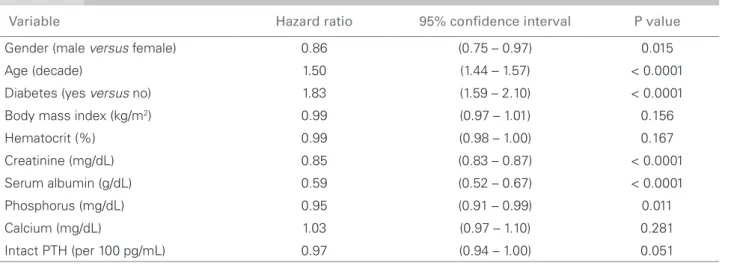
In the univariate analysis, age (hazard ratio – HR = 1.50; 95% confidence interval – CI: 1.44 - 1.57 per decade; p < 0.0001), diabetes (HR = 1.83; 95%CI: 1.59 - 2.10; p < 0.0001), female gender (HR = 1.16; 95%CI: 1.03 - 1.33; p = 0.015), serum creatinine at admission (HR = 0.85 per mg/dL; 95%CI: 0.83 - 0.87; p < 0.0001), serum albumin (HR = 0.59 per g/dL; 95%CI: 0.52 - 0.67; p < 0.0001), and serum phos-phorus (HR = 0.95 per mg/dL; 95%CI: 0.91 - 0.99; p = 0.011) were associated with the risk of mortality (Table 2).
After adjustment, in a Cox proportional model, the only variables that persisted associated with the risk of death were age (HR = 1.44; 95%CI: 1.35 - 1.53 per decade; p < 0.0001), diabetes (HR = 1.51; 95%CI: 1.25 - 1.82; p < 0.0001), serum creati-nine (HR = 0.92 per mg/dL; 95%CI: 0.88 - 0.95; p < 0.0001), serum albumin (HR = 0.76 per g/dL; 95% CI: 0.64 - 0.90; p = 0.001), and serum phos-phorus (HR = 1.06 per mg/dL; 95%CI: 1.01 - 1.13; p = 0.04), as seen in Table 3.
Figure 1. Survival curves according to diabetes status.
Number at risk
p<0.0001 Sur viv al (%) Non-diabetics 0 0 20 40 60 80 100
12 24 36 48 60
Months 2452 630 1954 477 1542 358 1239 273 1039 201 866 155 Diabetics Non-diabetics Diabetics
Number at risk
p<0.0001 Sur viv al (%) Non-diabetics 0 0 20 40 60 80 100
12 24 36 48 60
Months 2452 630 1954 477 1542 358 1239 273 1039 201 866 155 Diabetics Non-diabetics Diabetics
Number at risk
p < 0.0001
Sur viv al (%) Non-diabetics 0 0 20 40 60 80 100
12 24 36 48 60
Months 2452 630 1954 477 1542 358 1239 273 1039 201 866 155 Diabetics Non-diabetics Diabetics
Number at risk
p < 0.0001
Sur viv al (%) Non-diabetics 0 0 20 40 60 80 100
12 24 36 48 60
Months 2452 630 1954 477 1542 358 1239 273 1039 201 866 155 Diabetics Non-diabetics Diabetics
Number at risk
p < 0.0001
Sur viv al (%) Non-diabetics 0 0 20 40 60 80 100
12 24 36 48 60
Months 2452 630 1954 477 1542 358 1239 273 1039 201 866 155 Diabetics Non-diabetics Diabetics
Number at risk
Sur viv al (%) 0 0 20 40 60 80 100
12 24 36 48 60
Months
< 40 y
≥ 60 y 40 to 49 y 50 to 59 y
< 40 y
≥ 60 y 40 to 49 y 50 to 59 y
680 633 707 1062 554 523 563 791 439 414 449 598 366 350 353 443 317 305 286 332 280 266 226 249 Number at risk
Sur viv al (%) 0 0 20 40 60 80 100
12 24 36 48 60
Months < 40 y
≥ 60 y 40 to 49 y 50 to 59 y
< 40 y
≥ 60 y 40 to 49 y 50 to 59 y
680 633 707 1062 554 523 563 791 439 414 449 598 366 350 353 443 317 305 286 332 280 266 226 249
Figure 2. Survival curves according to age ranges. All survival rate comparisons by Log Rank were signiicantly different (p < 0.001).
Figure 3. Survival curves according to baseline serum albumin. Sur viv al (%) 0 0 20 40 60 80 100
12 24 36 48 60
≥ 3.8 g/dL < 3.8 g/dL
Number at risk
Months
p<0.0001
≥ 3.8 g/dL < 3.8 g/dL
1489 1357 1289 1096 1005 844 824 656 672 541 565 437 Sur viv al (%) 0 0 20 40 60 80 100
12 24 36 48 60
≥ 3.8 g/dL < 3.8 g/dL
Number at risk
Months
p < 0.0001
≥ 3.8 g/dL < 3.8 g/dL
1489 1357 1289 1096 1005 844 824 656 672 541 565 437
variable was not considered in further analysis, since only 60.9% of the patients had data regarding initial vascular access.
A total of 2,061 patients dropped out before com-pleting the five-year follow-up (47.4% died, 30.8% were transferred to other center, 15.3% had a kid-ney transplant, 2.5% were shift to peritoneal dialysis, 1.4% were recovering from renal function, and 1.3% abandoned the treatment).
D
ISCUSSIONThe survival rate seen in our population was higher than the one in the United States, similar to several European countries and close to the outstanding out-comes seen in Japan.4-6 Such low mortality rate could
be partially explained by the age of our HD popula-tion and a lower proporpopula-tion of diabetics when com-pared to HD patients in developed countries.4-7 Only
33.8% of patients were more than 60 years-old, in ac-cordance with the relatively young profile of Brazilian population. In 2000, for instance, only 8.6% (14.5 million people) of general Brazilian population were older than 60.8 Thus, the profile of HD patients is
a mirror of the national demographic pyramid. It should be pointed that the age profile of Brazilian population seems to be quickly changing, due to the persistent low-birth rate and progressive increase of life expectancy in Brazil.9
The low prevalence of diabetes is also a plausible explanation for the good outcome. The percentage of diabetes in the studied population was less than half the one reported in United States and slight lower than in most European countries.4,5
Other factors that could contribute to the low mortality rate are the almost universal use of native fistula as definitive vascular access, the accomplish-ment of at least 240 minutes per session by a vast majority of the patients, and the full time presence of nephrologists at all dialysis facilities, which is a legal local obligation.10
Most of the practices and procedures regarding safety on dialysis are the legacy of the reaction coordi-nated by the Minister of Health and Brazilian Society of Nephrology, following a tragedy that shocked the country. In 1996, 50 patients on maintenance HD in a single dialysis center at Caruaru, Pernambuco state, died after being exposed to microcystin-contaminated Table 2 UNIVARIATEANALYSISOFDEATHRISK
Variable Hazard ratio 95% conidence interval P value
Gender (male versus female) 0.86 (0.75 – 0.97) 0.015
Age (decade) 1.50 (1.44 – 1.57) < 0.0001
Diabetes (yes versus no) 1.83 (1.59 – 2.10) < 0.0001
Body mass index (kg/m2) 0.99 (0.97 – 1.01) 0.156
Hematocrit (%) 0.99 (0.98 – 1.00) 0.167
Creatinine (mg/dL) 0.85 (0.83 – 0.87) < 0.0001
Serum albumin (g/dL) 0.59 (0.52 – 0.67) < 0.0001
Phosphorus (mg/dL) 0.95 (0.91 – 0.99) 0.011
Calcium (mg/dL) 1.03 (0.97 – 1.10) 0.281
Intact PTH (per 100 pg/mL) 0.97 (0.94 – 1.00) 0.051
PTH: parathyroid hormone.
Table 3 MULTIVARIATEANALYSISOFDEATHRISKBYA COXREGRESSIONMODEL
Variable Hazard ratio 95% conidence interval P value
Gender (male versus female) 0.98 (0.82 – 1.16) 0.776
Age (decade) 1.44 (1.35 – 1.53) < 0.0001
Diabetes (yes versus no) 1.51 (1.25 – 1.82) < 0.0001
Body mass index (kg/m2) 0.98 (0.96 – 1.01) 0.125
Creatinine (mg/dL) 0.92 (0.88 – 0.95) < 0.0001
Serum albumin (g/dL) 0.76 (0.64 – 0.90) 0.001
Phosphorus (mg/dL) 1.06 (1.01 – 1.13) 0.035
Intact PTH (per 100 pg/mL) 1.00 (0.97 – 1.03) 0.767
water.11 Since then, strict rules for dialysis providers
were implemented,10 which, probably, have
contrib-uted to improve the outcome on dialysis nationwide. The profile of our HD population and long-term survival are similar to the findings of another cohort study with 1,009 incident patients from Southern Brazil.12
Regarding the variables associated with the risk of death, we confirmed several of the well-known risk factors as strong predictors of death, like age and diabetes. The adjusted risk of death increased 44% per each additional decade of life, and it was 51% higher for diabetic patients. The prevalence of obesity and consequently of diabetes are increasing faster in developing countries like Brazil than in industrialized nations.13 Thus, one can anticipate a new challenge
for the near future to keep the survival rate in HD in the current level.
In contrast to previous studies addressing popu-lations from developed countries,14 body mass index
was not found to be a predictor of survival in our HD population.
Serum albumin and serum creatinine were in-versely associated with the mortality risk. Such labo-ratory variables are dependent on clinical conditions and body muscle mass, respectively, and they are not modifiable factors in most cases. Increased se-rum phosphorus was associated with a higher risk of death. Even though such risk associated with serum phosphorus was not found to be as strong as that as-sociated with serum albumin or creatinine, the former is a modifiable factor, and early attention to the con-trol of hyperphosphatemia should be paid.
This study presents several limitations. The analy-sis was restricted to patients who survived the first three months on HD. We excluded early mortality from the analysis, because most patients were admit-ted in the clinics only after discharge from hospital where they started HD. Moreover, we would not be able to estimate the actual early mortality rate since many patients died just after initiating dialysis in the hospitalization period. Thus, the mortality rate would be higher if deaths that occurred in the first 90 days of dialysis had been considered. However, the same criteria have been used in most epidemiological stud-ies of HD population, including those we used as reference.4,5 Finally, we should consider that the
stud-ied population could not be completely representative of a nationwide feature, since near half of the patients are from Rio de Janeiro State.
As far as we know, this is the largest cohort of in-cident patients on HD from a developing country. We
believe that while a national registry is not available, this study can provide important information regard-ing the profile and predictors of survival in mainte-nance HD in Brazil.
In conclusion, the mortality rate on HD in this Brazilian cohort was found to be relatively low, but the population is younger and has a lower preva-lence of diabetes than the ones reported for developed countries.
A
PPENDIXThe dialysis facilities that participated in the study are the following ones:
• Clínica de Doenças Renais (CDR), Ingá and São Lourenço affiliates- Niterói, Rio Bonito – Rio de Janeiro, Macaé, Três Rios, Barra do Piraí, Barra Mansa, Santo Antônio de Pádua, Nova Iguaçu, São João de Meriti, Botafogo, Anil – Rio de Janeiro, Cascadura – Rio de Janeiro, Rio de Janeiro States;
• Centro de Terapia Nefrológica (Cetene) – São Paulo (SP);
• Instituto Mineiro de Nefrologia – Belo Horizonte (MG);
• Clínica do Rim – Petrolina (PE), Nefroclínica – Recife (PE);
• Clínica Pró-Nefron – Fortaleza (CE), Protorim – Fortaleza (CE), Prorim – Fortaleza (CE);
• Clinefro – Clínica Nefrológica do Piauí – Teresina (PI), Unirim – Parnaíba (PI);
• Nephron Serviços Médicos, Mix Park Sul, Gama and Taguatinga affiliates, Brasília (DF);
• Unidades Mix Park Sul, Gama e Taguatinga.
R
EFERENCESZatz R, Romão JE Jr, Noronha IL. Nephrology in Latin 1.
America, with special emphasis on Brazil. Kidney Int 2003;83(Suppl):S131-4.
Grassmann A, Gioberge S, Moeller S, Brown G. 2.
ESRD patients in 2004: global overview of patient numbers, treatment modalities and associated trends. Nephrol Dial Transplant 2005;20: 2587-93.
Sesso RD, Lopes AA, Thomé FS, Lugon JR, Burdmann 3.
EA. Brazilian Dialysis Census, 2009. J Bras Nefrol 2010;32:380-4.
U.S. Renal Data System 2009. USRDS Annual Data 4.
Report. National Institutes of Health, National Institute of Diabetes and Digestive and Kidney Diseases, Bethesda, MD; 2009.
Stel VS, van de Luijtgaarden MW, Wanner C, Jager 5.
KJ. The 2008 ERA-EDTA Registry Annual Report- a précis. NDT Plus 2011;4:1-13.
Goodkin DA, Young EW, Kurokawa K, Prütz KG, 6.
Europe, Japan, and the United States: case-mix effects. Am J Kidney Dis 2004;44(Suppl):S16-21.
Miskulin D, Bragg-Gresham J, Gillespie BW, Tentori 7.
F, Pisoni RL, Tighiouart H, et al. Key comorbid conditions that are predictive of survival among hemodialysis patients. Clin J Am Soc Nephrol 2009;4:1818-26.
Instituto Brasileiro de Geografia e Estatística. Censo 8.
2000. [cited 2011 Jun 21]. Available from: www.ibge. gov.br/censo/.
Instituto Brasileiro de Geografia e Estatística. Censo 9.
2010. [cited 2011 Jun 21]. Available from: www.ibge. gov.br/censo2010.
Agência Nacional de Vigilância Sanitária. Resolução da 10.
Diretoria Colegiada – RDC Nº 154; de 15 de junho de 2004.
Jochimsen EM, Carmichael WW, An JS, Cardo 11.
DM, Cookson ST, Holmes CE, et al. Liver failure and death after exposure to microcystins at a hemodialysis center in Brazil. N Engl J Med 1998;338:873-8. Silva LA, Mezzomo NF, Pansard HM, Arantes LC, 12.
Rempel W, Argenta LC, et al. Sobrevida em hemodiálise crônica: estudo de uma coorte de 1.009 pacientes em 25 anos. J Bras Nefrol 2009;31:190-7.
Wild SH, Roglic G, Green A, Sicree R, King H. Global 13.
prevalence of diabetes: estimates for the year 2000 and projections for 2030. Diabetes Care 2004;27:1047-53. Kalantar-Zadeh K, Streja E, Kovesdy CP, Oreopoulos 14.