Revista Brasileira de
Engenharia Agrícola e Ambiental
Campina Grande, PB, UAEA/UFCG – http://www.agriambi.com.br
v.20, n.10, p.930-935, 2016
Bean grain hysteresis with induced mechanical damage
Renata C. Campos
1, Paulo C. Corrêa
1, Lara S. Fernandes
1,
Fernanda M. Baptestini
1, Cristian F. Costa
1& Jaime D. Bustos-Vanegas
1DOI: http://dx.doi.org/10.1590/1807-1929/agriambi.v20n10p930-935
A B S T R A C T
This study aimed to evaluate the effect of mechanical damage on the hysteresis of beans with induced mechanical damage under different conditions of temperature and relative humidity. Beans (Phaseolus vulgaris L.) harvested manually with 35% water content (w.b.) were used. Part of this product was subjected to induced mechanical damage by Stein Breakage Tester and controlled drying (damaged and control sample), for sorption processes. The sorption isotherms of water were analyzed for different temperature conditions: 20, 30, 40 and 50 °C; and relative humidity: 0.3; 0.4; 0.5; 0.7 and 0.9 (decimal). Equilibrium moisture content data were correlated with six mathematical models, and the Modified Oswin model was the one that best fitted to the experimental data. According to the above mentioned isotherms, it was possible to observe the phenomenon of hysteresis of damaged and control samples, and this phenomenon was more pronounced in control ones.
Histerese de grãos de feijão
com danificação mecânica induzida
R E S U M O
Este trabalho teve como objetivo avaliar o efeito da danificação mecânica na histerese de grãos de feijão, em diferentes condições de temperatura e umidade relativa. Foram utilizados grãos de feijão (Phaseolus vulgaris L.) colhidos manualmente com teor de água de 35% (b.u.). Parte desse produto foi submetido à danificação mecânica induzida (via Stein Breakage Tester) e a secagem controlada (amostra danificada e testemunha), para os processos de dessorção e adsorção. As isotermas de adsorção e dessorção da água foram analisadas para diferentes condições de temperatura: 20, 30, 40 e 50 °C e umidade relativa: 0,3; 0,4; 0,5; 0,7 e 0,9 (decimal). Os dados de teor de água de equilíbrio foram correlacionados com seis modelos matemáticos; o modelo Oswin Modificado foi o que melhor se ajustou aos dados experimentais. Uma vez visualizadas as isotermas supracitadas foi possível verificar o fenômeno da histerese das amostras danificadas e testemunha, fenômeno este mais pronunciado na amostra testemunha.
Key words: mechanical damage
equilibrium moisture content sorption isotherms
mathematical modeling Phaseolus vulgaris L.
Palavras-chave: danos mecânicos equilíbrio higroscópico isotermas de sorção modelagem matemática Phaseolus vulgaris L.
1 Universidade Federal de Viçosa/Departamento de Engenharia Agrícola/Laboratório de Propriedades Físicas e Avaliação de Qualidade. Viçosa, MG. E-mail:
[email protected] (Corresponding author); [email protected]; [email protected]; [email protected]; [email protected]; [email protected]
Introduction
Brazil stands out as the largest global producer of bean (MAPA, 2015). According to the estimation made in May 2016 by CONAB (2016), for the 2015/2016 season, Brazil will produce 3,182.7 thousand tons of bean and the state of Paraná will be responsible for most of the production, followed by Minas Gerais and Bahia. For being reniform and having a thin integument, the bean seed is very susceptible to mechanical damages. Because of that, in the operation of harvest and threshing, special attention should be paid to the techniques that will be employed and to the regulations of the devices to avoid crushing, cracking and breaking of the seeds (EMBRAPA, 2004).
Mechanical damage modifies technological and qualitative parameters of agricultural products. Corrêa et al. (2008) observed that the structural alterations caused by the induced mechanical damage changed the water absorption rate by bean grains. The level of such damage directly influences the various grain-processing operations, such as drying, water adsorption and water absorption.
For the same condition of temperature and relative humidity, the equilibrium moisture content achieved by most agricultural products subjected to a process of adsorption is lower than that of desorption. The difference between the equilibrium moisture contents achieved in desorption and adsorption is called hysteresis (Wolf et al., 1972). Due to this phenomenon, it is important that the equilibrium isotherms be determined for both desorption and adsorption. Sorption isotherms can be obtained through mathematical models, which have been studied by various researchers (Costa et al., 2011; Sousa et al., 2013; Paglarini et al., 2013; Corrêa et al., 2014; Silva et al., 2015).
Given the above, this study aimed to evaluate the effect of mechanical damage on the hysteresis of bean grains with induced mechanical damage, under different conditions of temperature and relative humidity.
Material and Methods
The study was conducted at the Laboratory of Physical Properties and Evaluation of Agricultural Products Quality of the National Center of Training in Storage, located at the Federal University of Viçosa, in Viçosa, MG, Brazil.
Common bean grains (Phaseolus vulgaris L.), cultivar ‘Vermelho 2157’, were manually harvested and threshed (in order to avoid as much as possible any type of mechanical damage), with approximately 35% water content (w.b.).
The bean grains were divided into three subsamples: one as a control (without physical damage) and the others used in the processes of desorption and adsorption.
To study the adsorption process, a subsample was initially subjected to drying at controlled temperature of 40 ºC until the water content of 5% (w.b.) The water contents of the product were determined through the method of the oven, at 105 ± 1 ºC, for 24 h, in three replicates (Brasil, 2009).
The mechanical damage was induced in the bean grains using the Stein Breakage Tester, model CK2-M. 100-g samples
of clean grains (from the subsamples) and each one was placed in steel container with diameter of 9 cm, which threw the grains against the wall of the container for 4 min at 1800 rotations min-1; immediately after, the damaged samples were subjected
to desorption and adsorption.
The level of damage was indirectly evaluated through the electrical conductivity of the solution of the exudates of the grains, using a portable conductivity meter (Digimed - Model DM3).
To obtain the hygroscopic equilibrium moisture content through the static method, the grains were placed in a climatic chamber (Tecnopon - THL 1200). The temperatures used were 20, 30, 40 and 50 ± 1 ºC, combined with relative humidity values of 30, 40, 50, 70 and 90 ± 3%. Three replicates were used for each condition.
Mathematical models (Eqs. 1 to 6) commonly used to describe sorption phenomena in agricultural products were fitted to the observed data of hygroscopic equilibrium obtained for each condition of temperature and relative humidity.
- Modified Oswin
(
)
(
)
1c w w a bt Xe
1 A A
+ =
−
- Modified Henderson
(
)
(
)
1 c w l n 1 A Xe
a T b
−
=
− +
- Modified Halsey
(
)
( )
1 c
w exp a bT Xe
ln A
−
=
−
- Sigma-Copace
( )
( )
{
w}
Xe=exp a− bT + c exp A
- Chung-Pfost
(
) ( )
wXe= − ⋅a b ln c T ln A− ⋅
- GAB
(
w)(
ww w)
abc A Xe
1 c A 1 c A bc A
⋅ =
− ⋅ − ⋅ + ⋅
where:
Ue - equilibrium moisture content, %, d.b.; Aw - water activity, decimal;
T - temperature, ºC; and,
a, b, and c - coefficients that depend on the product (a, b and c are determined for each temperature).
(1)
(2)
(3)
(4)
(5)
The mathematical models were fitted through nonlinear regression by the Gauss-Newton method using the software Statistica 7.0®. The degree of fit of each model was verified
considering the magnitudes of the coefficients of determination (R2) and the standard deviation of the estimate (SE) (Eq. 7),
relative mean error (P) (Eq. 8) and residual distribution (degree of randomness).
the difference between the water contents for damaged and control grains tends to decrease.
The parameters of the models fitted to the data of hygroscopic equilibrium moisture content of the grains through desorption for the samples, aiming at different conditions of temperature and relative humidity and their respective values of coefficient of determination (R2), standard deviation of the
estimate (SE), relative mean error (P) and residual distribution, are presented in Tables 2 and 3.
According to Tables 2 and 3, the utilized mathematical models showed coefficients of determination (R2) higher than
95% and reduced values of standard deviation of the estimate (SE) and relative mean error (P), lower than 10% (Özdemir & Devres, 1999), indicating good adequacy of the models to explain the studied phenomenon, except for GAB, with 68.3, 25.6 and 19.6%, respectively.
(
Yi Yˆi)
SE
RDF
−
=
∑
i i i
ˆ Y Y 100
P
n Y
−
=
∑
where:
Yi - value observed experimentally, %, d.b.; Ŷi - value estimated by the model, %, d.b.; n - number of observed data; and,
RDF - residual degrees of freedom (number of observed data minus the number of parameters of the model).
For the best fit, the model must show R2 higher than 95%
and P and SE lower than 10% (Özdemir & Devres, 1999), besides random distribution of residuals.
Results and Discussion
The control bean sample and the sample subjected to induced mechanical damage showed mean values of electrical conductivity in the exudates of 29.88 and 152.38 μS cm-1 g-1,
respectively. The value of electrical conductivity for the sample subjected to induced mechanical damage was 5 times higher compared with the control sample. According to the Tukey test at 0.05 probability level, it was possible to verify significant differences between the control and the damaged sample.
The mean water contents for the hygroscopic equilibrium of bean obtained through the desorption process, for the temperatures of 20, 30, 40 and 50 ºC and water activity from 0.3 to 0.9 (decimal), are presented in Table 1.
According to Table 1, for all conditions of temperature and relative air humidity, the water content of the damaged grains was lower. In this table, it is also possible to observe that, for the increase in the vapor pressure of the ambient air,
Temperature (ºC)
Relative humidity of the ambient air (decimal)
0.3 0.4 0.5 0.7 0.9
20 Control 12.03 12.27 13.20 19.26 31.55
Damaged 11.29 11.89 12.94 18.41 30.87
30 Control 09.44 10.53 12.61 16.85 32.24
Damaged 09.19 10.25 11.83 16.06 31.20
40 Control 07.72 08.56 11.00 16.48 33.01
Damaged 07.79 08.50 10.59 15.95 32.59
50 Control 07.44 08.53 09.50 15.23 28.94
Damaged 07.46 08.12 09.36 14.50 28.40
Table 1. Mean values for equilibrium moisture content (% d.b.) of bean grains for control and damaged samples, obtained through desorption as a function of temperature (ºC) and water activity of the ambient air (decimal)
Models Estimate of the parameters R
2 SE P Residual
distribution (%)
Modied Oswin
a = 14.07605
0.984 1.021 5.797 Random
b = -0.07630 c = 2.16400
Modied Henderson
a = 0.0002
0.962 1.572 9.667 Biased
b = 106.6569 c = 1.2250
Modied Halsey
a = 4.498716
0.987 0.903 4.318 Random
b = 0.013176 c = 1.818582
Sigma-Copace
a = 0.538859
0.975 1.259 6.958 Biased
b = 0.006340 c = 1.267446
Chung-Pfost
a = 51.85773
0.957 1.669 10.282 Biased
b = 9.38822 c = 66.33299
GAB
a = 8.9652
0.683 25.593 19.557 Biased
b = 0.7526 c = 12.2333
Table 3. Estimate of parameters of hygroscopic equilibrium models for bean grains in the damaged sample, obtained through desorption
Models Estimate of the parameters R
2 SE P Residual
distribution (%)
Modied Oswin
a = 14.75937
0.986 0.975 4.935 Random
b = -0.08473 c = 2.17828
Modied Henderson
a = 0.00026
0.967 1.492 8.881 Biased
b = 94.32552 c = 1.23211
Modied Halsey
a = 4.624518
0.988 0.910 4.561 Random
b = 0.014227 c = 1.830394
Sigma-Copace
a = 0.602950
0.979 1.191 6.194 Biased
b = 0.006863 c = 1.259787
Chung-Pfost
a = 52.61405
0.963 1.580 9.702 Biased
b = 9.64256 c = 59.36635
GAB
a = 7.3625
0.756 22.564 16.158 Biased
b = 0.5968 c = 11.2563
Table 2. Estimate of parameters of the hygroscopic equilibrium models for bean grains in the control sample, obtained through desorption
(7)
The model that best represented grain hygroscopicity was selected based on the randomness of the residual distribution, highest coefficient of determination (R2) and lowest magnitudes
of the standard deviation of the estimate (SE) and relative mean error (P). This criterion was also used in the selection of the best model for the adsorption.
It was observed that Modified Oswin and Modified Halsey models showed random residual distribution, besides lower values of standard deviation of the estimate and relative mean error, indicating more adequate fit to the experimental data; thus, these were the models that best fitted statistically to the experimental data and can be recommended for the estimation of equilibrium moisture content for bean grains subjected to desorption.
Table 4 showed the mean water contents for the hygroscopic equilibrium of beans obtained through adsorption.
For most of the conditions of temperature and relative air humidity (Table 5), the water content of bean grains subjected to induced mechanical damage was higher than the water content of undamaged grains.
Tables 5 and 6 show the parameters of the models fitted to the data of hygroscopic equilibrium moisture content of the samples, with their respective values of coefficient of determination (R2), standard deviation of the estimate (SE)
and relative mean error (P).
According to Tables 5 and 6, the utilized mathematical models showed R2 higher than 97% and reduced values of SE
and P, lower than 10%, indicating good adequacy of the models to explain the phenomenon of adsorption.
It is observed that the Modified Oswin, Modified Halsey and Sigma-Copace models were the ones that best fitted statistically to the experimental data; thus, they can be recommended for the estimation of the equilibrium moisture content of bean grains subjected to adsorption.
Thus, the Modified Oswin model, in general, showed the best results for desorption and adsorption, being recommended for the estimation of equilibrium moisture contents of bean grains.
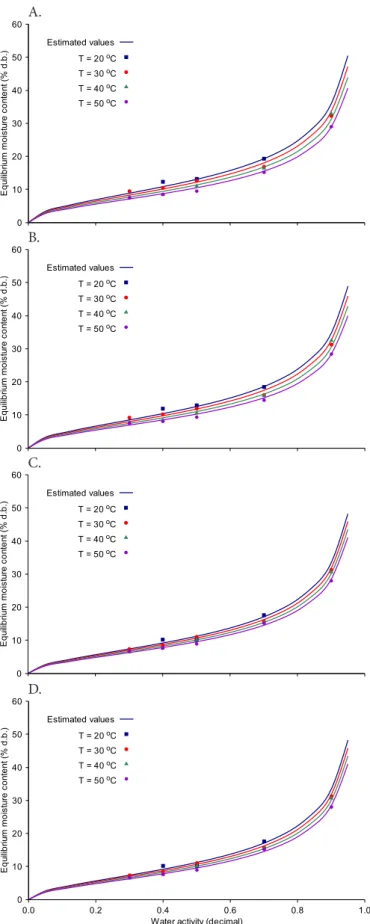
Figure 1 shows the results (experimental and calculated by the Modified Oswin model) referring to the processes of adsorption and desorption for damaged and control samples.
According to Figure 1, the hygroscopic equilibrium curves obtained through desorption and adsorption for bean grains showed a sigmoid shape, typical of many agricultural products: Chaves et al. (2015); Hassini et al. (2015), Oliveira et al. (2010; 2014a; b); Siqueira et al. (2012); Smaniotto et al. (2012); Sousa et al. (2013) and Costa et al. (2013). It is also observed that the increase of temperature promotes reduction in the equilibrium moisture content of the grains, following the same tendency of the other agricultural products.
Based on the presented isotherms, the product can be adequately managed aiming at the maintenance of its water content at the levels recommended for a safe storage. The graphs of sorption isotherms can also be used to define the period most suitable to bean grain storage in the various regions of the country, taking into consideration the data of temperature and relative humidity.
Figure 2 shows the phenomenon of hysteresis through desorption and adsorption isotherms estimated by the Modified Oswin model, for the temperature of 20 ºC to exemplify the above mentioned phenomenon.
According to Figure 2, the values of hygroscopic equilibrium moisture content obtained through desorption Models Estimate of the
parameters R
2 SE P Residual
distribution (%)
Modied Oswin
a = 12.33483
0.995 0.5526 4.03 Random
b = -0.05566 c = 2.01759
Modied Henderson
a = 0.0002
0.986 1.337 7.275 Biased
b = 163.3494 c = 1.1312
Modied Halsey
a = 3.950579
0.992 0.835 5.236 Random
b = 0.009989 c = 1.702599
Sigma-Copace
a = 0.232399
0.993 0.783 4.446 Random
b = 0.005013 c = 1.366165
Chung-Pfost
a = 57.8135
0.975 2.221 9.337 Biased
b = 9.6676 c = 149.4429
GAB
a = 6.670046
0.985 1.718 6.013 Biased
b = 0.871878 c = 8.527795
Table 5. Estimate of parameters of the hygroscopic equilibrium models for bean grains in the control sample, obtained through adsorption
Temperature (ºC)
Relative humidity of the ambient air (decimal)
0.3 0.4 0.5 0.7 0.9
20 Control - 10.18 10.18 17.53
-Damaged - 10.40 10.78 17.48
-30 Control 7.28 08.50 11.10 15.72 31.26
Damaged 7.78 09.16 11.41 15.58 29.73
40 Control 6.48 07.66 10.13 15.54 30.73
Damaged 7.10 07.88 10.19 15.74 30.24
50 Control 6.67 07.64 08.92 15.22 27.99
Damaged 6.72 07.82 09.26 15.86 27.94
Table 4. Mean values of equilibrium moisture content (% d.b.) of bean grains, for control and damaged samples, obtained through adsorption as a function of temperature (ºC) and water activity of the ambient air (decimal)
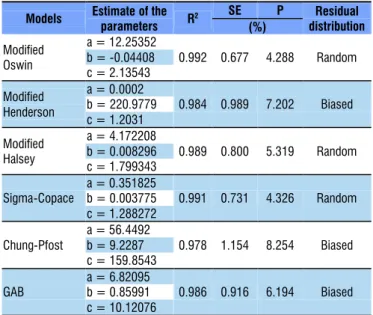
Table6. Estimate of parameters of hygroscopic equilibrium models for bean grains in the damaged sample, obtained through adsorption
Models Estimate of the parameters R
2 SE P Residual
distribution (%)
Modied Oswin
a = 12.25352
0.992 0.677 4.288 Random
b = -0.04408 c = 2.13543
Modied Henderson
a = 0.0002
0.984 0.989 7.202 Biased
b = 220.9779 c = 1.2031
Modied Halsey
a = 4.172208
0.989 0.800 5.319 Random
b = 0.008296 c = 1.799343
Sigma-Copace
a = 0.351825
0.991 0.731 4.326 Random
b = 0.003775 c = 1.288272
Chung-Pfost
a = 56.4492
0.978 1.154 8.254 Biased
b = 9.2287 c = 159.8543
GAB
a = 6.82095
0.986 0.916 6.194 Biased
Figure 1. Values observed and estimated by the Modified
Oswin model of the equilibrium moisture content of bean grains, obtained through desorption for control (A) and damaged (B) samples and obtained through adsorption for control (C) and damaged (D) samples
Figure 2. Desorption and adsorption isotherms estimated
by the Modified Oswin model for 20 ºC for the control (A)
and damaged (B) samples
0 10 20 30 40 50 60 Eq ui libr iu mm oi st ur ec on te nt (% d. b.
) Estimated values
T = 20 Co T = 30 Co T = 40 Co T = 50 Co
0 10 20 30 40 50 60 Eq ui libr iu mm oi st ur ec on te nt (% d. b.
) Estimated values
T = 20 Co T = 30 Co T = 40 Co T = 50 Co
0 10 20 30 40 50 60 Eq ui libr iu mm oi st ur ec on te nt (% d. b.
) Estimated values
T = 20 Co T = 30 Co T = 40 Co T = 50 Co
0 10 20 30 40 50 60
0.0 0.2 0.4 0.6 0.8 1.0
Eq ui libr iu mm oi st ur ec on te nt (% d. b. )
Water activity (decimal) Estimated values
T = 20 Co T = 30 Co T = 40 Co T = 50 Co
A. B. C. D. 0 10 20 30 40 50 60 70 80 Eq ui libr iu mm oi st ur ec on te nt (% d. b. ) Desorption Adsorption A. B. 0 10 20 30 40 50 60 70 80
0.0 0.2 0.4 0.6 0.8
Eq ui libr iu mm oi st ur ec on te nt (% d. b. )
Water activity (decimal) Desorption
Adsorption
are higher than those obtained through adsorption, evidencing the phenomenon of hysteresis. In addition, the control sample exhibited greater magnitude between the phenomena of
desorption and adsorption, compared with the damaged sample, which points out that maintaining the integrity of the grains favors the maintenance of moisture inside them. For constant values of relative humidity, the difference between the water contents obtained through desorption and adsorption decreases with the increase in temperature, pointing to a direct relationship between the phenomenon of hysteresis and temperature; similar result was obtained by Corrêa et al. (2014), studying hygroscopic equilibrium of coffee grains.
Conclusions
1. Grains subjected to induced mechanical damage showed higher values of equilibrium moisture content in comparison to undamaged grains, under the same conditions of temperature and relative humidity.
2. Based on statistical analyses, the Modified Oswin model showed the best fit to the experimental data, for both desorption and adsorption.
3. Hysteresis showed greater magnitude between desorption and adsorption in the control sample, which evidences the fact that maintaining the integrity of the grains favors the maintenance of the moisture inside them.
Literature Cited
Chaves, T. H.; Resende, O.; Oliveira, D. E. C. de; Smaniotto, T. A. de S.; Sousa, K. A. Isotermas e calor isostérico das sementes de pinhão-manso. Engenharia na Agricultura, v.23, p.9-18. 2015. CONAB - Companhia Nacional de Abastecimento.
Acompanhamento da safra brasileira - Grãos. Safra 2015/2016. v.3, n.8. Oitavo levantamento/maio - 2016.
Corrêa, P. C.; Botelho, F. M.; Botelho, S. C. C.; Goneli, A. L. D. Isoterma de sorção de água de frutos de Coffea canefora. Revista Brasileira de Engenharia Agrícola e Ambiental, v.18, p.1047-1052. 2014. http:// dx.doi.org/10.1590/1807-1929/agriambi.v18n10p1047-1052 Corrêa, P. C.; Resende, O.; Ribeiro, D. M.; Jarén, C.; Arazuri, S.
Resistance of edible beans to compression. Journal of Food Engineering, v.86, p.172-177. 2008. http://dx.doi.org/10.1016/j. jfoodeng.2007.09.021
Costa, L. M; Resende, O.; Oliveira, D. E. C. de. Isotermas de dessorção e calor isostérico dos frutos de crambe. Revista Brasileira de Engenharia Agrícola e Ambiental, v.17, p.412-418. 2013. http:// dx.doi.org/10.1590/S1415-43662013000400009
Costa, L. M; Resende, O.; Sousa, K. A; Gonçalves, D. Coeficiente de difusão efetivo e modelagem matemática da secagem de sementes de crambe. Revista Brasileira de Engenharia Agrícola e Ambiental, v.15, p.1089-1096, 2011. http://dx.doi.org/10.1590/ S1415-43662011001000014
EMBRAPA - Empresa Brasileira de Pesquisa Agropecuária. Produção de Sementes Sadias de Feijão Comum em Várzeas Tropicais. Sistemas de produção. n.4. Versão eletrônica. 2004. <http:// sistemasdeproducao.cnptia.embrapa.br/FontesHTML/Feijao/ FeijaoVarzeaTropical/colheita_mecanizada.htm>. 5 Jul. 2015. Hassini, L.; Bettaieba, E.; Desmorieuxb, H.; Torresc, S. S.; Touild, A.
Desorption isotherms and thermodynamic properties of prickly pear seeds. Industrial Crops and Products, v.67, p.457-465, 2015. http://dx.doi.org/10.1016/j.indcrop.2015.01.078
MAPA - Ministério da Agricultura, Pecuária e Abastecimento. Perfil do feijão no Brasil. <http://www.agricultura.gov.br/vegetal/ culturas/feijao/saiba-mais>. 5 Jul. 2015.
Oliveira, D. E. C.; Resende, O.; Campos, R. C.; Donadon, J. R. Obtenção e modelagem das isotermas de dessorção e do calor isostérico para sementes de arroz em casca. Revista de Ciências Agrárias, v.42, p.203-210, 2014a.
Oliveira, D. E. C.; Resende, O.; Chaves, T. H.; Souza, K. A.; Smaniotto, T. A. S. Propriedades termodinâmicas das sementes de pinhão manso. Bioscience Journal, v.30, p.147-157. 2014b.
Oliveira, G. H. H.; Corrêa, P. C.; Araújo, E. F.; Valente, D. S. M.; Botelho, F. M. Desorption isotherms and thermodynamic properties of sweet corn cultivars (Zea mays L.). International Journal of Food Science & Technology, v.45, p.546-554. 2010. http://dx.doi.org/10.1111/j.1365-2621.2009.02163.x
Özdemir, M.; Devres, Y. O. The thin layer drying characteristics of hazelnuts during roasting. Journal of Food Engineering, v.42, p.225-233, 1999. http://dx.doi.org/10.1016/S0260-8774(99)00126-0
Paglarini, C. S.; Silva, F. S.; Porto, A. G.; Piasson, D.; Santos, P. Histerese das isotermas de sorção da polpa de manga (Mangifera indica L.) variedade manteiga. Revista Brasileira de Engenharia Agrícola e Ambiental, v.17, p.299-305, 2013. http://dx.doi. org/10.1590/S1415-43662013000300008
Silva, H. W.; Costa, L. M.; Resende, O.; Oliveira, D. E. C.; Soares, R. S.; Vale, L. S. R. Higroscopicidade das sementes de pimenta (Capsicum chinense L.). Revista Brasileira de Engenharia Agrícola e Ambiental, v.19, p.780-784, 2015. http://dx.doi. org/10.1590/1807-1929/agriambi.v19n8p780-784
Siqueira, V. C.; Resende, O.; Chaves, T. H. Propriedades físicas das sementes de pinhão-manso ao longo da secagem em diferentes temperaturas. Semina: Ciências Agrárias, v.33, p.2705-2714, 2012. http://dx.doi.org/10.5433/1679-0359.2012v33Supl1p2705 Smaniotto, T. A. S.; Resende, O.; Oliveira, D. E. C.; Sousa, K. A. de;
Campos, R. C. Isotermas e calor latente de dessorção dos grãos de milho da cultivar AG 7088. Revista Brasileira de Milho e Sorgo, v.11, p.312-322, 2012. http://dx.doi.org/10.18512/1980-6477/rbms.v11n3p312-322
Sousa, K. A. de; Resende, O.; Costa, L. M. Isotermas de dessorção das sementes de nabo forrageiro obtidas pelos métodos dinâmico e estático. Revista Brasileira de Engenharia Agrícola e Ambiental, v.17, p.216-222, 2013. http://dx.doi.org/10.1590/ S1415-43662013000200013