ACPD
11, 30487–30526, 2011Validation with ozonesondes
J. L. Moody et al.
Title Page
Abstract Introduction
Conclusions References
Tables Figures
◭ ◮
◭ ◮
Back Close
Full Screen / Esc
Printer-friendly Version Interactive Discussion
Discussion
P
a
per
|
Dis
cussion
P
a
per
|
Discussion
P
a
per
|
Discussio
n
P
a
per
|
Atmos. Chem. Phys. Discuss., 11, 30487–30526, 2011 www.atmos-chem-phys-discuss.net/11/30487/2011/ doi:10.5194/acpd-11-30487-2011
© Author(s) 2011. CC Attribution 3.0 License.
Atmospheric Chemistry and Physics Discussions
This discussion paper is/has been under review for the journal Atmospheric Chemistry and Physics (ACP). Please refer to the corresponding final paper in ACP if available.
A Multi-sensor Upper Tropospheric Ozone
Product (MUTOP) based on TES ozone
and GOES water vapor: validation with
ozonesondes
J. L. Moody1, S. R. Felker1, A. J. Wimmers2, G. Osterman3, K. Bowman3, A. M. Thompson4, and D. W. Tarasick5
1
University of Virginia, Charlottesville, VA, USA
2
Cooperative Institute for Meteorological Satellite Studies, Madison, WI, USA
3
NASA Jet Propulsion Laboratory, Pasadena, CA, USA
4
Pennsylvania State University, University Park, PA, USA
5
Environment Canada, Downsview, Ontario, Canada
Received: 3 October 2011 – Accepted: 15 October 2011 – Published: 14 November 2011
Correspondence to: J. L. Moody ([email protected])
ACPD
11, 30487–30526, 2011Validation with ozonesondes
J. L. Moody et al.
Title Page
Abstract Introduction
Conclusions References
Tables Figures
◭ ◮
◭ ◮
Back Close
Full Screen / Esc
Printer-friendly Version Interactive Discussion
Discussion
P
a
per
|
Dis
cussion
P
a
per
|
Discussion
P
a
per
|
Discussio
n
P
a
per
|
Abstract
Accurate representation of ozone in the extratropical upper troposphere (UT) remains a challenge. However, the implementation of hyper-spectral remote sensing using satellite instruments such as the Tropospheric Emission Spectrometer (TES) provides an avenue for mapping ozone in this region, from 500 to 300 hPa. As a polar orbiting
5
satellite TES observations are limited, but in this paper they are combined with geo-stationary satellite observations of water vapor. This paper describes a validation of the Multi-sensor UT Ozone Product (MUTOP). MUTOP is statistical retrieval method, a derived product image based on the correlation of two remotely sensed quantities, TES ozone, against geostationary (GOES) specific humidity and modeled potential
10
vorticity, a dynamical tracer in the UT. These TES-derived UT ozone mixing ratios are compared to coincident ozonesonde measurements of layer-average UT ozone mixing ratios made during the NASA INTEX/B field campaign in the spring of 2006; the region for this study is effectively the GOES west domain covering the Eastern North Pacific Ocean and the Western United States. This intercomparison evaluates MUTOP skill
15
at representing ozone magnitude and variability in this region of complex dynamics. In total, 11 ozonesonde launch sites were available for this study, providing 127 indi-vidual sondes for comparison; the overall mean ozone of the 500–300 hPa layer for these sondes was 78.0 ppbv. MUTOP reproduces in-situ measurements reasonably well, producing an UT mean of 82.3 ppbv, with a mean absolute error of 12.2 ppbv
20
and a root mean square error of 16.4 ppbv relative to ozonesondes across all sites. An overall UT mean bias of 4.3 ppbv relative to sondes was determined for MUTOP. Considered in the context of past TES validation studies, these results illustrate that MUTOP is able to maintain accuracy similar to TES while expanding coverage to the entire GOES-West satellite domain. In addition MUTOP provides six-hour temporal
25
ACPD
11, 30487–30526, 2011Validation with ozonesondes
J. L. Moody et al.
Title Page
Abstract Introduction
Conclusions References
Tables Figures
◭ ◮
◭ ◮
Back Close
Full Screen / Esc
Printer-friendly Version Interactive Discussion
Discussion
P
a
per
|
Dis
cussion
P
a
per
|
Discussion
P
a
per
|
Discussio
n
P
a
per
|
always represent a lack of TES-derived product skill, but often results from discrepan-cies driven by observations made in the presence of strong meteorological gradients.
1 Introduction
Extensive scientific effort has been directed toward accurately characterizing ozone variability in the extratropical upper troposphere (UT); nevertheless, ozone prediction
5
in this region from 500 to 300 hPa is difficult due to the presence of fine-scale filamen-tary features that shift with weather patterns, and the layer’s position as a mixing region between stratospheric and tropospheric reservoirs of air (Gettleman et al., 2011; Bow-man et al., 2007; Fairlie et al., 2007; Wernli and Sprenger, 2007). The identification of these advective filaments and spiral features in potential vorticity and water vapor
10
fields has long been understood as evidence of conditions favorable for stratosphere-to-troposphere (STT) exchange and mesoscale chemical mixing (Appenzeller et al., 1996a; Methven and Hoskins, 1998; Stohl and Trickl, 1999; Wimmers et al., 2003). The complexity of these mixing processes and jet stream dynamics in the UT region lead to heightened ozone error in the UT in most chemical transport models. For example,
15
Tarasick et al. (2007) found that two Canadian air quality forecast models (AURAMS and CHRONOS) perform poorly in the UT relative to ozonesonde measurements. Re-sults from their study showed that both models tend to significantly under-estimate UT ozone, with the AURAMS model exhibiting a difference of as much as 80–90 % and the CHRONOS model exhibiting maximum differences near 50 %. Among reasons
20
for this poor model performance, the authors suggest cross-boundary transport, in-cluding stratospheric influence, as well as NOx emissions and resulting in-situ ozone
production from lightning strikes (Cooper et al., 2006, 2007), and sub-grid-scale con-vective lifting of planetary boundary layer ozone and ozone precursors. Even chemical models using assimilation of satellite column ozone data, such as the RAQMS model,
25
ACPD
11, 30487–30526, 2011Validation with ozonesondes
J. L. Moody et al.
Title Page
Abstract Introduction
Conclusions References
Tables Figures
◭ ◮
◭ ◮
Back Close
Full Screen / Esc
Printer-friendly Version Interactive Discussion
Discussion
P
a
per
|
Dis
cussion
P
a
per
|
Discussion
P
a
per
|
Discussio
n
P
a
per
|
in accurately capturing the presence and variability of ozone in the UT suggests that new methods, based on satellite observations specific to the upper troposphere, may provide a realistic companion approach.
In order to test the validity of UT ozone measurements made by the Tropospheric Emission Spectrometer (TES) and in an attempt to address the problems with
cur-5
rent UT ozone modeling noted above, Felker et al. (2011) developed a Multi-sensor UT Ozone Product (MUTOP). MUTOP is a derived field, an empirical product based on the statistical correlations between TES-observed UT ozone mixing ratios and two quasi-conservative synoptic-dynamic tracers for ozone in the UT: specific humidity (based on the Geostationary Operational Environmental Satellite (GOES) water vapor channel)
10
and potential vorticity (PV) from the Global Forecast System (GFS) model. Blend-ing the advantages of two remote sensBlend-ing platforms by usBlend-ing GOES along with TES, the MUTOP product provides temporal and spatial coverage similar to a geostationary view, while gaining TES’s ability to characterize UT ozone. As such, MUTOP fills an important niche in presenting the broader meteorological context for ozone transport
15
and variability at fixed locations like ozone sounding sites.
This approach to combining observations from more than one satellite platform or sensor has been successfully employed by other investigators to derive estimates of tropospheric column ozone (Fishman et al., 2003; Ziemke, et al., 2006; Schoeberl, 2007; Osterman et al., 2008). Previously, observations from two instruments on Aura,
20
the ozone monitoring instrument (OMI) and the microwave limb sounder (MLS) have been used to evaluate individual events and to provide a global climatology of tropo-spheric and stratotropo-spheric columns of ozone (Doughty et al., 2011; Ziemke et al., 2011). Most recently, Tang and Prather (2011) compared instantaneous ozone observations from four Aura instruments, TES, OMI, MLS, and HIRDLS (the High Resolution
Dy-25
ACPD
11, 30487–30526, 2011Validation with ozonesondes
J. L. Moody et al.
Title Page
Abstract Introduction
Conclusions References
Tables Figures
◭ ◮
◭ ◮
Back Close
Full Screen / Esc
Printer-friendly Version Interactive Discussion
Discussion
P
a
per
|
Dis
cussion
P
a
per
|
Discussion
P
a
per
|
Discussio
n
P
a
per
|
and on a time scale as short as hours at a given location. Our results are consistent with this previous work, but it seems useful to establish that the goal of this paper is different. The broader object of MUTOP is to illustrate that observations from the polar orbiting instrument TES when put into context with geostationary observations can in fact reasonably map the variability in a dynamic quantity like UT ozone at the time scale
5
of a few hours.
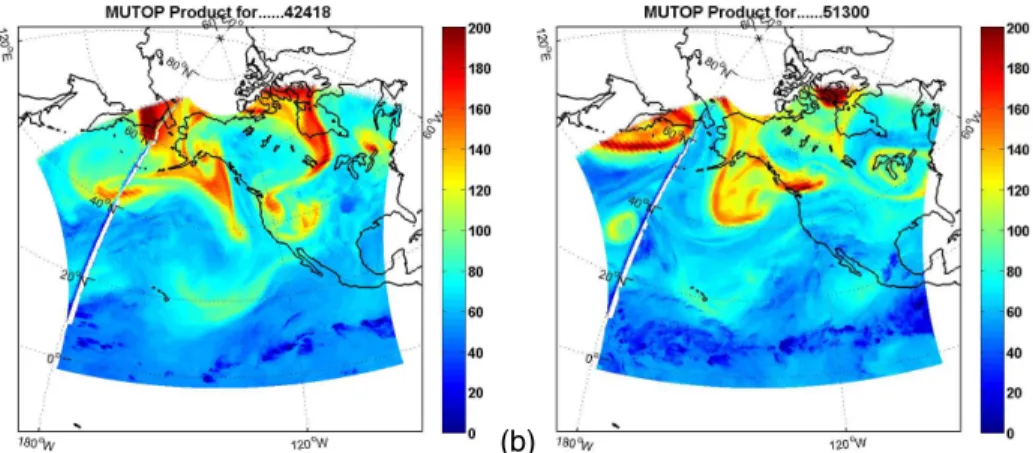
An example of the TES-derived MUTOP product is shown in Fig. 1, it illustrates the layer-average volume mixing ratio (VMR) of ozone in the upper troposphere for two specific times, (a) 24 April 18:00 UTC, and (b) 13 May 00:00 UTC, with values typi-cally ranging from 40 to 250 ppb. The image product retains the horizontal resolution
10
of the GOES specific humidity fields, with a temporal resolution of 6 h (determined by the assimilation of the GFS temperature fields used to derive GOES specific humidity). The advantage of MUTOP imagery is that it readily depicts the meteorological context of upper-tropospheric ozone enhancement; features like ridges, troughs, cutoff lows, mesoscale streamers and vortex roll-up are all readily identified, and MUTOP
anima-15
tions clearly illustrate the dynamic fluctuation of ozone in the upper troposphere (see supplementary image animation, Felker et al., 2011).
This paper presents MUTOP product validation: it compares the derived multi-sensor ozone product at specific sonde-launch locations against layer-averaged ozonesondes. Results from this work are presented relative to previous, independent validation
stud-20
ies that were based on the TES ozone retrievals themselves.
1.1 Previous TES validation efforts and results
Several sources provide specific background information on the TES instrument and its ozone retrieval methodology (Beer, 1992, 2006; Bowman et al., 2002; Clough et al., 2006). Previous validation of TES ozone retrieval performance was carried out in the
25
ACPD
11, 30487–30526, 2011Validation with ozonesondes
J. L. Moody et al.
Title Page
Abstract Introduction
Conclusions References
Tables Figures
◭ ◮
◭ ◮
Back Close
Full Screen / Esc
Printer-friendly Version Interactive Discussion
Discussion
P
a
per
|
Dis
cussion
P
a
per
|
Discussion
P
a
per
|
Discussio
n
P
a
per
|
set of coincident ozonesonde launches. Since there were not a large number of TES overpasses with corresponding sonde launches at the time, the authors were forced to use loose coincidence criteria (observations made within 48 h and 600 km) to allow for a large enough paired dataset. Statistical results were divided into categories by region (northern mid-latitudes, sub-tropics, etc.) and by height (lower troposphere and
5
upper troposphere) in the atmosphere.
Once a larger set of data was available, a similar TES validation study was carried out by Nassar et al. (2008) to examine the performance of revised TES version 2 (V002) column ozone retrievals. With a larger data set available to them, the authors were able to tighten the coincidence criteria to 9 h and 300 km between sonde launches
10
and TES overpass column retrievals. In a test of the effects of non-coincidence, the authors also validated based on an even tighter coincidence criteria of 3 h and 100 km. Separation into categories by region and atmospheric height was similar to the Worden et al. (2007) study.
While the former two studies focused on comparison of TES column retrievals
15
of ozone to ozonesonde measurements, the third validation study by Richards et al. (2008) used airborne Differential Absorption LiDAR (DIAL) measurements from the Intercontinental Chemical Transport Experiment Phase B (INTEX-B) field campaign for validation of TES column ozone. The comparisons used in their study were all from flight legs over the North Pacific, out of Anchorage, Alaska and Hawaii during INTEX/B,
20
the period from mid-April to mid-May 2006. The coincidence criterion for their study was 3 h. In all three of these TES validation studies the TES averaging kernel was applied to the measured validation data to account for differences in vertical resolution (see Worden et al., 2007 for details).
1.2 Validation techniques and overall goals 25
ACPD
11, 30487–30526, 2011Validation with ozonesondes
J. L. Moody et al.
Title Page
Abstract Introduction
Conclusions References
Tables Figures
◭ ◮
◭ ◮
Back Close
Full Screen / Esc
Printer-friendly Version Interactive Discussion
Discussion
P
a
per
|
Dis
cussion
P
a
per
|
Discussion
P
a
per
|
Discussio
n
P
a
per
|
To assess the realism of these empirical UT estimates of ozone, we compare the TES-derived product, MUTOP, to ozonesonde measurements. Statistical results quantify the general ability of MUTOP to accurately represent ozone fluctuations across a large spatial domain. Beyond statistical analysis of the product’s overall performance, a sec-ondary goal is to present individual MUTOP and ozonesonde comparisons in case
5
study format in order to illustrate the meteorological context for both good and poor agreement between product and sonde. This allows for differentiating between poten-tial sampling error and actual product skill error. Sampling error, in this context, refers to non-coincidence of measurements in space, time, or both. We find these errors are associated with strong meteorological gradients in the vicinity of sounding sites at the
10
time of in situ observations.
2 Data sets
2.1 Multi-sensor UT Ozone Product (MUTOP)
The Multi-sensor Upper Tropospheric Ozone Product (MUTOP) is derived from the mul-tiple regression of TES-observed UT ozone mixing ratios (based on TES V002), against
15
GOES Layer Average Specific Humidity (GLASH) brightness values, and Global Fore-cast System (GFS) modeled potential vorticity (PV). Felker et al. (2011) showed that despite an inverse correlation between specific humidity and PV, collinearity did not destabilize the regression, and the two variables provided complimentary power, with GOES specific humidity explaining more of the TES ozone variance in lower PV air,
20
while PV explained more of the variance in TES ozone in extremely dry air. The strength of the overall relationship supports the assumption that UT ozone mixing ratios should be enhanced in regions of atmospheric aridity (low specific humidity) and high PV as a result of dynamical processes associated with STT exchange. The regres-sion results (Table 1, Felker et al., 2011) were used as a statistical retrieval of MUTOP
25
ACPD
11, 30487–30526, 2011Validation with ozonesondes
J. L. Moody et al.
Title Page
Abstract Introduction
Conclusions References
Tables Figures
◭ ◮
◭ ◮
Back Close
Full Screen / Esc
Printer-friendly Version Interactive Discussion
Discussion
P
a
per
|
Dis
cussion
P
a
per
|
Discussion
P
a
per
|
Discussio
n
P
a
per
|
April and 16 May 2006 at 6 h intervals (00:00, 06:00, 12:00, and 18:00 UTC); to view a multi-day animation of the MUTOP imagery, see the supplementary material in Felker et al. (2011).
2.2 Ozonesonde data
Ozonesonde data from 11 stations across the United States and Canada (Fig. 2) are
5
included in this study. The datasets are from two sources: (1) the INTEX Ozonesonde Network Study 2006 (IONS06) database (http://croc.gsfc.nasa.gov/intexb/ions06.html, Thompson et al., 2007a,b), and (2) the Global Monitoring Division (GMD) of the Earth System Research Laboratory (ESRL) database (http://www.esrl.noaa.gov/gmd). All of the data used for validation purposes are from electro-chemical concentration cell
10
(ECC) ozonesondes, which employ the reaction of potassium iodide (KI) with ozone to generate a current proportional to the amount of ozone passing through the instru-ment chamber (Komhyr, 1986; Komhyr et al., 1995). Past investigations have revealed that ozonesondes of this type have a precision of about 5 % and accuracy of about 10 % in the troposphere (Smit et al., 2007; Deshler et al., 2008; Tarasick and Slater,
15
2008). A typical sonde ascent rate is about 4–5 m s−1, with measurements made ap-proximately every 10 s during ascent.
3 Methodology
3.1 Matching ozonesondes to MUTOP estimates
In order to validate MUTOP against in-situ ozonesonde measurements, it was first
20
ACPD
11, 30487–30526, 2011Validation with ozonesondes
J. L. Moody et al.
Title Page
Abstract Introduction
Conclusions References
Tables Figures
◭ ◮
◭ ◮
Back Close
Full Screen / Esc
Printer-friendly Version Interactive Discussion
Discussion
P
a
per
|
Dis
cussion
P
a
per
|
Discussion
P
a
per
|
Discussio
n
P
a
per
|
a maximum weight coming from near the center of the layer, around 400 hPa. Table 1 illustrates the weights used for each layer.
Overall there were 127 ozonesonde profiles from 11 launch sites over the GOES-West domain during the INTEX-B campaign that were used in this validation study. With the exception of Hilo, Hawaii, all of the sonde launch sites used were located
5
within the continental United States or Canada. To match each individual layer-average ozone volume mixing ratio (VMR) measurement from a sonde to the most coinci-dent MUTOP estimate, the closest product pixel to the latitude and longitude of the ozonesonde launch site was used. However, it is important to note that ozonesondes are not spatially-fixed column measurements; measurements are made along the
tra-10
jectory of the ascending balloon based on actual wind patterns. The impacts of this will be discussed in a set of case studies. With respect to temporal coincidence, all sonde launches were kept in the data set in order to provide a large enough sample for statistical analysis. Since MUTOP imagery was created at 6 h intervals, the maxi-mum possible time separation between sonde launch and the most coincident MUTOP
15
image was 3 h.
3.2 Evaluations of MUTOP performance
The performance of the TES-derived UT ozone product was determined based on its error and bias relative to coincident ozonesonde measurements. Time series plots are presented in order to demonstrate overall product performance with respect to
20
capturing the timing of UT ozone variations at each individual ozonesonde launch site. First, based on numerical comparison of TES-derived MUTOP to coincident sonde-derived UT ozone measurements, the mean absolute error (MAE), root mean square error (RMSE), and overall UT ozone product bias, were determined and are reported on a site-by-site basis for each sounding location. These same statistical error and bias
25
ACPD
11, 30487–30526, 2011Validation with ozonesondes
J. L. Moody et al.
Title Page
Abstract Introduction
Conclusions References
Tables Figures
◭ ◮
◭ ◮
Back Close
Full Screen / Esc
Printer-friendly Version Interactive Discussion
Discussion
P
a
per
|
Dis
cussion
P
a
per
|
Discussion
P
a
per
|
Discussio
n
P
a
per
|
We have identified specific cases where MUTOP significantly over-predicts or under-predicts the sonde-derived estimate, and in both instances we illustrate the meteoro-logical conditions that appear to explain the mismatch. These cases are identified as sampling error; they occur with synoptic situations that produce strong gradients, con-ditions under which the multi-sensor product may represent a different air mass from
5
that which the ozonesonde sampled.
4 Results
4.1 Time series evaluations
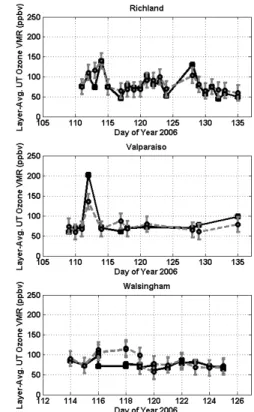
Plots of time series comparisons between ozonesonde-measured layer-average UT ozone and multi-sensor estimates of layer-average UT ozone are provided in Fig. 3
10
for the sounding sites with more than ten launches during the INTEX-B study period. These generally illustrate good product skill at reproducing the site specific timing and magnitude of variations in UT ozone. Overall these figures suggest that MUTOP cap-tures ozone variability in the UT fairly accurately. For example, the MUTOP results for Kelowna, British Columbia track the synoptic/dynamic response of the ozonesondes
15
going from∼150 ppb down to∼60 ppb, and then later capture two more spikes over
150 ppb as the UT responded to the passage of upper level troughs. At Bratt’s Lake, the product tracks the gradual increase in ozone, while at Trinidad Head, California the product, like the ozonesondes, did not observe as much dynamic range in ozone. In the case study section, it is shown that for some instances of significant under-prediction
20
ACPD
11, 30487–30526, 2011Validation with ozonesondes
J. L. Moody et al.
Title Page
Abstract Introduction
Conclusions References
Tables Figures
◭ ◮
◭ ◮
Back Close
Full Screen / Esc
Printer-friendly Version Interactive Discussion
Discussion
P
a
per
|
Dis
cussion
P
a
per
|
Discussion
P
a
per
|
Discussio
n
P
a
per
|
4.2 Statistical validation
Results are compiled in Table 2. Overall, MUTOP displayed a mean absolute error (MAE) of 12.2 ppbv and a root mean square error (RMSE) of 16.4 ppbv relative to ozonesonde measurements. Generally, TES-derived MUTOP was biased high rela-tive to sondes, 4.3 ppbv±15.9 ppbv. Specific average values, errors, and biases are 5
also listed for each sounding site. This tabulation shows that average ozone mixing ratios and variability in UT ozone are site dependent. Nevertheless, biases and errors are fairly consistent between sites, with almost all sites (except Valparaiso, Indiana, discussed below) showing MUTOP to be biased high. Figure 4a shows the overall cor-relation between ozonesonde-measured layer-average UT ozone and the TES-derived
10
MUTOP estimates; the correlation coefficient is 0.824, indicating that MUTOP accounts for∼68 % of the observed variability in UT ozone over this domain. Figure 4b, the
fre-quency distribution of error, illustrates the error distribution. There are 23 soundings with errors that are more than one standard deviation away from the mean. An analy-sis of the MUTOP imagery for each of these days illustrates that this level of mismatch
15
always occurs in the vicinity of strong meteorological gradients in MUTOP. Several of these represent instances when soundings were launched just ahead of or just behind a transient feature like a streamer or a cutofflow. Examples of these conditions are presented as case studies.
4.3 Error and bias comparisons 20
A comparison of these statistical results to the outcomes from previous TES validation studies (Table 3), shows that The MUTOP performs comparably to TES itself, with similar errors and biases. Multi-sensor UT ozone product RMSE was 16.4 ppbv. These results are very similar to those found in Nassar et al. (2008) for TES performance in the Northern Hemisphere (NH) mid-latitude UT. In the Nassar et al. (2008) study, in
25
ACPD
11, 30487–30526, 2011Validation with ozonesondes
J. L. Moody et al.
Title Page
Abstract Introduction
Conclusions References
Tables Figures
◭ ◮
◭ ◮
Back Close
Full Screen / Esc
Printer-friendly Version Interactive Discussion
Discussion
P
a
per
|
Dis
cussion
P
a
per
|
Discussion
P
a
per
|
Discussio
n
P
a
per
|
TES RMSE of 17.8 ppbv and a NH mid-latitude Spring UT TES RMSE of 19.2 ppbv. This suggests that the derived multi-sensor UT ozone product being validated in this study has equivalent or slightly better skill at predicting layer-average UT ozone mixing ratios as compared to TES itself, while providing spatial-synoptic coverage far beyond what is available from individual TES overpasses.
5
Bias estimates were also very similar, with NH mid-latitude bias of 5.9 ppbv±17.8 ppbv and NH mid-latitude spring season bias of 8.3±19.2 ppbv
in Nassar et al. (2008) as compared to 4.3 ppbv±15.9 ppbv within the GOES-West
domain in this study. While these results from Nassar et al. (2008) are exclusively for the NH mid-latitudes, this study includes one site in the NH sub-tropics (Hilo, HI), the
10
remainder of profiles used in this study were from mid-latitude locations.
The comparability of these results is rather encouraging given the different approach they represent. This study validates the TES-derived multi-sensor UT ozone product (MUTOP), while in Nassar et al. (2008), the authors were validating TES itself by ap-plying the TES averaging kernel to the ozonesonde profiles. However, the similarity
15
of these results does suggest that the MUTOP product is robust and furthers the idea that TES may have an overall positive UT ozone bias. MUTOP provides a relatively good representation of layer-averaged TES retrievals in the UT at a spatial scale and resolution which has not been previously available.
In the TES validation study by Richards et al. (2008), aircraft DIAL and in-situ
FAS-20
TOZ ozone measurements were used for comparison to TES V002 retrievals. They were also dealing with the same INTEX period as is used in this study. For flights out of Hawaii, Richards et al. (2008) found a TES UT (500 to 300 hPa) ozone bias and error of 3.11 ppbv±13.65 ppbv. For flights out of Anchorage, Alaska, they found a TES UT
(500 to 300 hPa) ozone bias and error of 9.05 ppbv±25.33 ppbv. Again these results 25
ACPD
11, 30487–30526, 2011Validation with ozonesondes
J. L. Moody et al.
Title Page
Abstract Introduction
Conclusions References
Tables Figures
◭ ◮
◭ ◮
Back Close
Full Screen / Esc
Printer-friendly Version Interactive Discussion
Discussion
P
a
per
|
Dis
cussion
P
a
per
|
Discussion
P
a
per
|
Discussio
n
P
a
per
|
In a rather different ozone assessment, Ziemke et al. (2006, 2011), used a 2-D in-terpolation of stratospheric ozone from the microwave limb sounder (MLS) to derive fields of stratospheric column and they used ozone monitoring instrument (OMI) ob-servations to derive total column ozone. The difference between these quantities was derived as the tropospheric ozone residual, TOR, or tropospheric column. It was noted
5
that the method works well as long as horizontal gradients in the stratospheric column are relatively small. They compare derived tropospheric columns to ozonesondes for several of the locations used here, including Kelowna, Bratts Lake, Hilo, Egbert, and Boulder, and found RMS errors ranging from 6.6 to 12.4 ppbv. Their resulting global climatology is a valuable contribution. However, the relative advantage of MUTOP, with
10
comparable validation to previous work, is the ability to observe fine-scaled features and discern the temporal evolution of UT ozone.
4.4 Case study validation
In this section, several specific ozonesonde measurements and corresponding MU-TOP estimates have been examined with respect to the synoptic-dynamical situation
15
at the approximate time of sonde launch. The goal here was to examine under what conditions the MUTOP statistical retrieval has high/low predictive skill. We also identify potential reasons for error in situations of poor predictive skill, defined as events with errors (MUTOP-ozonesonde) greater than 1.5 standard deviations from the mean. To generalize, 8 events that had error greater than+1.5 standard deviation from the mean 20
error, of these 7 were associated with soundings launched on the edge of a strong gra-dient in MUTOP where the sonde does not appear to have sampled the meteorological feature, e.g., a dry air, high PV streamer, or a cutofflow. There were 9 events that had errors greater than−1.5 standard deviation from the mean, and 5 of these were
asso-ciated with soundings launched into a cutofflow indicative of a low tropopause, so the
25
ACPD
11, 30487–30526, 2011Validation with ozonesondes
J. L. Moody et al.
Title Page
Abstract Introduction
Conclusions References
Tables Figures
◭ ◮
◭ ◮
Back Close
Full Screen / Esc
Printer-friendly Version Interactive Discussion
Discussion
P
a
per
|
Dis
cussion
P
a
per
|
Discussion
P
a
per
|
Discussio
n
P
a
per
|
preceding or following these outlier cases.
4.4.1 Kelowna, British Columbia – 21–22 April 2006
On 21 April at 00:00 UTC, there was very good agreement between the TES-derived MUTOP value of 65 ppbv and the Kelowna ozonesonde observation of 69 ppbv taken at 23:16 UTC on 20 April (Julian Day (JD) 110), within 45 min of the time shown in
5
the MUTOP image. This value is representative of a broad region of UT ozone in the range of 60–70 ppb in the continental Pacific Northwest Region. However, within 18 h, (by 18:00 UTC on 21 April, JD 111) a dry air streamer positioned off the NW coast had advanced to a point just west of Kelowna (Fig. 5a), and by 00:00 UTC on 22 April, the leading edge of the dry air streamer, and its associated ozone enhancement, were
10
positioned over the sounding location (Fig. 5b). The difference between these two MUTOP images shows the rapid eastward propagation of the streamer feature and the very strong UT ozone gradient along its leading edge. On 21 April at 18:00 UTC the multi-sensor ozone product shows the layer-average UT ozone above Kelowna to be∼70–80 ppbv, while 6 h later at 00:00 UTC on the 22nd, the product estimates an 15
ozone volume mixing ratio of 110 ppbv. However, he actual sounding was made in between the time of these two MUTOP images, it was launched at 23:16 UTC on 21 April 44 min before the MUTOP image shown in Fig. 5b. It is apparent from the actual sounding information that the ozonesonde passed through the very eastern edge of a dry air streamer feature in the UT. Significant changes in UT moisture and ozone
20
can be seen in the ozonesonde profiles in Fig. 5c, with a shift from a moist UT the day before with an ozone mixing ratios of∼69 ppbv (black lines) to a much drier UT
with stronger winds (60 to 70 knots), a lower tropopause, and layer-average UT ozone of∼80 ppbv (blue lines). However, the most significant ozonesonde differences are
observed in the region from 300 to 200 hPa, above the UT region of interest captured
25
by MUTOP.
ACPD
11, 30487–30526, 2011Validation with ozonesondes
J. L. Moody et al.
Title Page
Abstract Introduction
Conclusions References
Tables Figures
◭ ◮
◭ ◮
Back Close
Full Screen / Esc
Printer-friendly Version Interactive Discussion
Discussion
P
a
per
|
Dis
cussion
P
a
per
|
Discussion
P
a
per
|
Discussio
n
P
a
per
|
considered. Since the sonde launch was in an area of strong moisture and ozone gradients in the UT, simply the time difference between the sounding launch and the MUTOP product will cause the two methods to sample different air masses in the UT. In fact, looking at the wind speeds and directions throughout the ozonesonde flight up to 300 hPa, it is evident that the sonde balloon was pushed north-northeastward with
5
50 to 80 knot winds and remained out ahead of the UT ozone enhancement (Fig. 5b). Hodograph analysis (not shown) combined with consideration of the rapid movement of the streamer suggests that a combination of these two meteorological factors could have contributed considerably to the 30 ppbv difference in the estimate of ozone vol-ume mixing ratio between MUTOP and the sounding. This suggests that the lack of
10
correspondence between the TES-derived product and the sonde may be driven by time mismatch in the presence of strong meteorological gradients, and therefore may not represent product error in MUTOP.
4.4.2 Richland, Washington – 23 April 2006
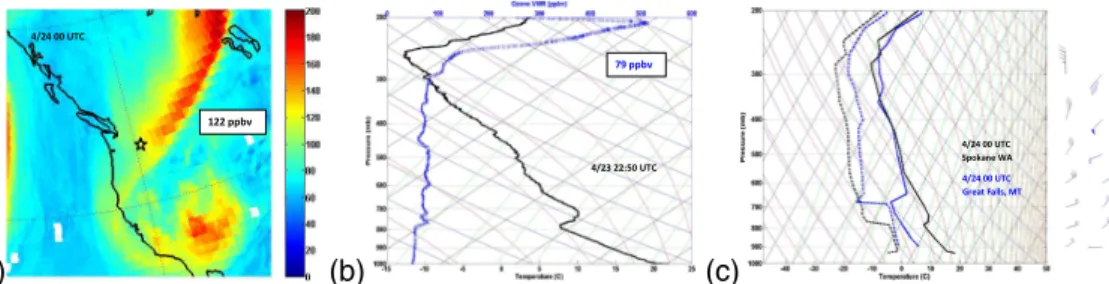
Considerable MUTOP error observed relative to the ozonesonde launch from Richland,
15
Washington at 22:50 UTC on 23 April (JD 113) arise under conditions similar to the for-mer case in British Columbia. In the Richland case, the ozonesonde was launched on the western edge of this same evolving dry air streamer in the UT. For this time and location, the balloon was launched along the trailing edge of a corresponding region of stronger gradients in UT moisture and ozone. For 24 April at 00:00 UTC, the
multi-20
sensor ozone product shows that the sonde launch site was on the southwestern edge of the dry air feature and that there was less ozone-rich UT air to the south and west of Richland (Fig. 6a). The multi-sensor product predicted a layer-average UT ozone mix-ing ratio of 122 ppbv while the ozonesonde launched from Richland observed 79 ppbv. In terms of ozone volume mixing ratio magnitude and error, this is very similar to the
25
previous case from Kelowna, BC.
ACPD
11, 30487–30526, 2011Validation with ozonesondes
J. L. Moody et al.
Title Page
Abstract Introduction
Conclusions References
Tables Figures
◭ ◮
◭ ◮
Back Close
Full Screen / Esc
Printer-friendly Version Interactive Discussion
Discussion
P
a
per
|
Dis
cussion
P
a
per
|
Discussion
P
a
per
|
Discussio
n
P
a
per
|
used along with the multi-sensor UT ozone product image (Fig. 6a). The ozonesonde profile from 22:50 UTC shows gradually-increasing tropospheric ozone values from the surface to 300 hPa, with a larger ozone enhancement right above 300 hPa, just below the tropopause near 260 hPa (Fig. 6b). However, since this enhancement is above the 300 hPa level, it is not included in the sonde average by the layer-averaging scheme
5
used in this study. Figure 6c shows two separate radiosonde profiles from 00:00 UTC on the 24 April. The Spokane, Washington profile (in black) shows the thermody-namic structure and wind profile of the atmosphere on the western edge of the dry air streamer while the Great Falls, Montana profile (in blue) shows the air mass differences on the eastern edge of the streamer feature. One can see the marked wind shift in the
10
UT region from a northeasterly jet on the west side to a southwesterly jet on the east side of this upper-level feature. These NE winds on the western flank of the high ozone, low specific humidity streamer MUTOP feature will push the sonde balloon toward the SW, toward lower UT ozone values of∼80–90 ppbv. As with the last case, the
addi-tional radiosonde data provide evidence that sampling error may be an issue in high
15
winds and strong ozone gradient regions in the UT, particularly when observed winds keep the balloon ahead of the advancing MUTOP-predicted UT ozone enhancements. By the next day, 24 April JD114, there was excellent agreement (as seen in Fig. 3, the time series for Richland) between the ozonesonde (138 ppbv) and MUTOP (140 ppbv). The broadened streamer was located over the sounding site, the feature having
con-20
tinued to elongate and advect retrograde from the NE to SW, moving over Richland. In this location the balloon was more likely to sample the feature. Figure 1, which was used to illustrate a full MUTOP image, is from 24 April 18:00 UTC, the sonde launch time on JD 114 and it clearly shows the streamer forming an upper level low over the vicinity of Richland.
25
4.4.3 Valparaiso, Indiana – 22 April 2006
ACPD
11, 30487–30526, 2011Validation with ozonesondes
J. L. Moody et al.
Title Page
Abstract Introduction
Conclusions References
Tables Figures
◭ ◮
◭ ◮
Back Close
Full Screen / Esc
Printer-friendly Version Interactive Discussion
Discussion
P
a
per
|
Dis
cussion
P
a
per
|
Discussion
P
a
per
|
Discussio
n
P
a
per
|
sampled different air masses due to a combination of temporal separation and sonde drift in high wind regions along the edge of strong UT ozone gradients. These condi-tions kept the ozonesonde from observing the highest ozone seen in the TES-derived imagery. In this next case, we illustrate that strong winds may also enhance the ozone the sonde observes in the upper troposphere. As show in Fig. 3, sondes launched
5
from Valparaiso, Indiana, on 21 and 23 April found very good agreement between the MUTOP product and the sonde measurements. However, on 22 April, JD 112, the one mismatch, a serious MUTOP under prediction (135 ppbv, Fig. 7a) of the sonde observed ozone value (202 ppbv, Fig. 7b) drives the overall negative bias (−7.2 ppbv,
Table 2) observed for Valparaiso. This sonde launch occurred on the southern edge of
10
a deepening cutofflow feature, under an upper level jet with strong vertical wind shear. Winds in the layer of high ozone were 50 to 70 knots, WSW, and had the potential to advect the sonde further into the cutoff low. Perhaps even more relevant is the fact that the MUTOP image is from 18:00 UTC, and the balloon, launched at 19:00 UTC, would not be expected to ascend to the UT level until about 19:30 UTC. However, the
15
next MUTOP image, from 00:00 UTC, indicates there was indeed an increasing amount of ozone in the base of the cutoff low, with the highest ozone increasing from 160 to 200 ppb in three hours. The combination of the ozone increasing with time in the cut-off
low, and the winds advecting the balloon deeper into the upper-level feature suggest that the closest MUTOP image underestimated the amount of ozone the sonde would
20
encounter during its ascent. This again demonstrates the error is influenced by timing and the dynamic meteorological conditions.
4.4.4 Edmonton, Alberta – 10 May 2006
The case study from Edmonton, Alberta, Canada demonstrates a synoptic situation in which the multi-sensor UT ozone product appears to have accurately characterized
25
ACPD
11, 30487–30526, 2011Validation with ozonesondes
J. L. Moody et al.
Title Page
Abstract Introduction
Conclusions References
Tables Figures
◭ ◮
◭ ◮
Back Close
Full Screen / Esc
Printer-friendly Version Interactive Discussion
Discussion
P
a
per
|
Dis
cussion
P
a
per
|
Discussion
P
a
per
|
Discussio
n
P
a
per
|
streamer feature in the UT led to an enhancement of ozone in the layer. In this case, the product estimated an UT layer-average ozone volume mixing ratio of 102 ppbv, while the ozonesonde measured 99 ppbv.
This ozonesonde launch took place at a time when there was a strong UT ozone gradient around Edmonton, conditions contributing to high product error in other cases
5
we have shown; but the MUTOP performed very well here. The reasons for this become more apparent after examining the time coincidence and the ozonesonde profile and column winds (Fig. 8). In this case, time match is excellent, especially after considering sonde ascent time to the 500–300 hPa layer. Also, the sonde observed relatively light and variable wind velocities up to 300 hPa, suggesting that sonde drift was negligible
10
and that the sonde and product should have observed the same UT air mass despite the strong gradient in ozone. Figure 8b shows an ozone enhancement around 300 hPa consistent with tropopause folding, which seems to have been well-characterized in the GFS PV field as well; upper-tropospheric potential vorticity (PV) in this regions was 1.7 PV units, not shown.
15
4.4.5 Kelowna, British Columbia – 12 May 2006
The final case study examines product performance under a situation of an ozone ex-treme. MUTOP shows a region of high ozone (Fig. 9a); a sequence of weather maps (not shown) illustrate that this feature is a short wave travelling along the periphery of a larger trough over the Pacific. This shortwave feature was captured by the Kelowna
20
ozonesonde, seen as a spike in Fig. 3 (Kelowna time series, Julian Day 132), but was gone by the time of the next sounding, having rotated northward. The ozonesonde launched from Kelowna, BC on 12 May, JD 132, measured the highest layer-average UT ozone of all the sondes used in this MUTOP validation. The ozonesonde was launched at 23:16 UTC into the upper level short-wave trough over the Pacific
North-25
ACPD
11, 30487–30526, 2011Validation with ozonesondes
J. L. Moody et al.
Title Page
Abstract Introduction
Conclusions References
Tables Figures
◭ ◮
◭ ◮
Back Close
Full Screen / Esc
Printer-friendly Version Interactive Discussion
Discussion
P
a
per
|
Dis
cussion
P
a
per
|
Discussion
P
a
per
|
Discussio
n
P
a
per
|
while MUTOP from 13 May at 00:00 UTC estimated 203 ppbv. The ozonesonde profile (Fig. 9b), as well as the very high layer-average PV value (7.0 PV units, not shown), indicate that the layer-averaging in this case mostly represents the lower stratosphere (the stratosphere begins at∼450 hPa according to the thermodynamic profile of the
ozonesonde). Since the time separation between ozonesonde launch and MUTOP is
5
fairly small (45 min) and the UT ozone enhancement is fairly broad spatially, it is likely that the error here is more related to the MUTOP ozone retrieval skill in the lower strato-sphere. Based on the linear fit of observations in the work reported here (Fig. 4a) and by Nassar et al. (2008, Fig. 3, Northern Midlatitudes), in spite of the overall positive bias in the data, MUTOP (and TES) will under-predict extreme ozone values (greater
10
than 150 ppbv), suggesting that these methods will under-predict ozone in the lower stratosphere. In fact, previous TES versus sonde validations Nassar et al. (2008) have truncated ozonesondes at the thermal tropopause, while Richards et al. (2008) note a negative bias for profiles influenced by a low troposphere and greater stratospheric contributions. This could obviously have influenced the negative bias observed for
Val-15
paraiso, as the previous case study discussed an event with significant stratospheric enhancement of the regions we have defined as the UT (300 to 500 hPa). Based on a truncated UT layer analysis like Nassar, the ozonesonde layer-average VMR for this Kelowna event would be ∼180 ppbv (including only the layer from 500 to 450 hPa),
rather than 232 ppbv which includes the layer from 500 to 300 hPa. Given that we have
20
retained the full UT layer in averaging the sonde, we would expect that MUTOP will under-predict the observed ozone in events with a low tropopause.
The MUTOP error in this specific case relative to the ozonesonde measurement is approximately 12.5 %, which is not unreasonable for such an extreme case, and is within the 5–15 % error range reported by Richards et al. (2008).
ACPD
11, 30487–30526, 2011Validation with ozonesondes
J. L. Moody et al.
Title Page
Abstract Introduction
Conclusions References
Tables Figures
◭ ◮
◭ ◮
Back Close
Full Screen / Esc
Printer-friendly Version Interactive Discussion
Discussion
P
a
per
|
Dis
cussion
P
a
per
|
Discussion
P
a
per
|
Discussio
n
P
a
per
|
5 Discussion
5.1 Possible reasons for observed error
As demonstrated by the overall correlation, the time series plots by station, and the selection of case studies, while MUTOP performs fairly well overall in estimating ac-tual UT ozone, there are instances in which large errors were observed. This does
5
not necessarily mean that MUTOP is in error because the features are likely displaced from the location corresponding to the balloon sounding by a small but critical distance. This mismatch over short time and space scales has been largely ignored in previous validation work. In the case studies, we consider reasons for error on the basis of the meteorology. We can reasonably assume that interpolating MUTOP to the exact time
10
and place of the ozonesonde (when it reaches the UT 500–300 hPa layer) using the feature preserving morphing tools developed by Wimmers and Velden (2011) for ad-vecting microwave imagery would reduce the number of extreme errors (errors greater than ± one standard deviation). These efforts are beyond the scope of this study,
however, they might prove worthy of further research.
15
It is important to acknowledge that error can be introduced into MUTOP at several different steps. First, there can be error in the actual products that the multi-sensor estimate is based on. Since MUTOP depends on correlations of TES-observed UT ozone, GOES derived specific humidity (in the form of GLASH brightness values), and GFS-modeled potential vorticity, error can be contributed from any of these three
20
product components.
TES V002 UT ozone error has already been evaluated in two papers (Nassar et al., 2008; Richards et al., 2008). TES error can be related to problems in a-priori estimates, retrieval methodologies, and lack of sensitivity (Worden et al., 2004; Bowman et al., 2006).
25
ACPD
11, 30487–30526, 2011Validation with ozonesondes
J. L. Moody et al.
Title Page
Abstract Introduction
Conclusions References
Tables Figures
◭ ◮
◭ ◮
Back Close
Full Screen / Esc
Printer-friendly Version Interactive Discussion
Discussion
P
a
per
|
Dis
cussion
P
a
per
|
Discussion
P
a
per
|
Discussio
n
P
a
per
|
and Moody, 2001). In the second problem, the satellite retrieval is saturated by mois-ture in the upper layers of the UT and is unable to observe potentially dry intrusions beneath, thus overestimating UT layer-average specific humidity between 500 and 300 hPa. It should also be noted that the GLASH product performance diminishes at very high GOES satellite zenith angles due to increased path length through the
5
atmosphere (Wimmers and Moody, 2001), which will also result in an overestimate of layer average specific humidity. This issue could impact the sites furthest away from the GOES west nadir point (135◦W longitude, 0◦N latitude), which in this validation
study, were Walsingham, Valparaiso, and Egbert. Table 2 shows these sites do have the largest RMSE.
10
Finally, GFS-modeled PV error can be generated if either UT temperature or UT wind fields are poorly modeled. While estimates of atmospheric temperature are fairly good in modern numerical models, wind fields can still exhibit error in magnitude, direction, and spatiotemporal placement, which has the potential to mis-locate MUTOP features. This is another factor that has the potential to produce errors in the vicinity of strong
15
gradients.
5.2 Ideas for further validation
While the results of this validation study are promising for operational use of MUTOP, further validation should characterize the product’s performance in other regions of the geostationary domain (GOES East, Meteosat) and during different seasons and years.
20
The current validation effort has only examined MUTOP skill during the spring season, corresponding to the time frame and domain of the INTEX-B field campaign. The statistical retrieval is based on empirical relationships based on data from the spring; therefore it is possible that the MUTOP in its current form may not perform as well in other seasons. Since Mid-latitude stratosphere-troposphere exchange is generally
25
ACPD
11, 30487–30526, 2011Validation with ozonesondes
J. L. Moody et al.
Title Page
Abstract Introduction
Conclusions References
Tables Figures
◭ ◮
◭ ◮
Back Close
Full Screen / Esc
Printer-friendly Version Interactive Discussion
Discussion
P
a
per
|
Dis
cussion
P
a
per
|
Discussion
P
a
per
|
Discussio
n
P
a
per
|
Another limitation of the current validation is that the comparisons are based on only one year (2006) of data, and therefore cannot account for any inter-annual variability in the UT ozone relationships with PV and upper level (UL) aridity. To test this, validation against ozonesondes or other UT ozone measurements from other years could also be carried out in the future. Ozonesonde launches provide validation sources for a
spa-5
tially limited portion of the GOES-West domain, and only included three ozonesondes from Hilo, Hawaii. Since a large database of airborne Differential Absorption LiDAR (DIAL) ozone measurements is available from flights during the INTEX-B campaign, it could be useful to compare profile measurements from these flights to coincident MU-TOP estimates, analogous to Richards et al. (2008). This would extend validation over
10
more of the North Pacific. Finally, detailed temporal interpolation would improve prod-uct/sonde timing issues, and hodograph analysis of individual sondes could improve the spatial coincidence issues.
It is worth noting that for this one season analyzed, we do observe a relatively con-sistent enhancement of ozone over the subtropical Pacific between 20 and 35◦N (see
15
the region of green indicating 80 to 120 ppbv in Fig. 1, or review the image anima-tion of Felker et al., 2011). Although this product represents the layer average ozone from 300 to 500 hPa, these enhancements may reflect the influence of stratosphere-to-troposphere (STT) transfer of ozone along the subtropical jet, as was recently analyzed and reported by Trickl et al. (2011), and Manney et al. (2011). These are considerably
20
weaker than the enhancements associated with the troughs and meridional streamers associated with the dynamics of the polar jet stream that are traceable with UT ozone mixing ratios of 120 to over 200 ppbv.
The intention of this research was to create and validate a near real-time product of remotely-sensed UT ozone based on extrapolating TES observations to the GOES
25
ACPD
11, 30487–30526, 2011Validation with ozonesondes
J. L. Moody et al.
Title Page
Abstract Introduction
Conclusions References
Tables Figures
◭ ◮
◭ ◮
Back Close
Full Screen / Esc
Printer-friendly Version Interactive Discussion
Discussion
P
a
per
|
Dis
cussion
P
a
per
|
Discussion
P
a
per
|
Discussio
n
P
a
per
|
a statistical retrieval of upper troposphere ozone based on GOES and GFS PV in near real-time could provide a unique assessment of dynamically forced UT ozone at high spatial and temporal resolution, providing a dynamical context for on-going ozonesonde networks, and might prove useful as a remotely sensed index of upper level frontal activity like the PVI index of Cai (2003).
5
References
Appenzeller, C., Davies, H. C., and Norton: Fragmentation of stratospheric intrusions, J. Geo-phys. Res., 101, 1435–1456, 1996a.
Appenzeller, C., Holton, J. R., and Rosenlof, K. H.: Seasonal variation of mass transport across the tropopause, J. Geophys. Res., doi:10.1029/1996JD00821, 1996b.
10
Beer, R.: Remote Sensing by Fourier Transform Spectrometry, Wiley, New York, 1992.
Beer, R.: TES on the aura mission: scientific objectives, measurements, and analysis overview, IEEE T. Geosci. Remote Sens., 44, 1102–1105, 2006.
Bowman, K. P., Pan, L. L., Campos, T., and Gao, R.: Observations of fine-scale transport struc-ture in the upper troposphere from the High-performance Instrumented Airborne Platform 15
for Environmental Research, J. Geophys. Res., 112, D18111, doi:10.1029/2007JD008685, 2007.
Bowman, K. W., Steck, T., Worden, H. M., Worden, J., Clough, S., and Rodgers, C.: Capturing time and vertical variability of tropospheric ozone: a study using TES nadir retrievals, J. Geophys. Res., 107(D23), 4723, doi:10.1029/2002JD002150, 2002.
20
Bowman, K. W., Rodgers, C. D., Kulawik, S. S., Worden, J., Sarkissian, E., Osterman, G., Steck, T., Lou, M., Eldering, A., Shepard, M. Worden, H., Lampel, M., Clough, S., Brown, P., Rinsland, C., Gunson, M., and Beer, R.: Tropospheric emission spectrometer: retrieval method and error analysis, IEEE T. Geosci. Remote Sens., 44(5), 1297–1307, doi:10.1109/TGR S.2006.871234, 2006.
25
Cai, M.: Potential vorticity intrusion index and climate variability of surface temperature, Geo-phys. Res. Lett., 30, 1119, doi:10.1029/2002GL015926, 2003.
ACPD
11, 30487–30526, 2011Validation with ozonesondes
J. L. Moody et al.
Title Page
Abstract Introduction
Conclusions References
Tables Figures
◭ ◮
◭ ◮
Back Close
Full Screen / Esc
Printer-friendly Version Interactive Discussion
Discussion
P
a
per
|
Dis
cussion
P
a
per
|
Discussion
P
a
per
|
Discussio
n
P
a
per
|
jacobians for tropospheric emission spectrometer retrievals, IEEE T. Geosci. Remote Sens., 44, 1308–1323, 2006.
Cooper, O. R., Stohl, A., Trainer, M., Thompson, A. M., Witte, J. C., Oltmans, S. J., Morris, G., Pickering, K. E., Crawford, J. H., Chen, G., Cohen, R. C., Bertram, T. H., Wooldridge, P., Perring, A., Brune, W. H., Merrill, J., Moody, J. L., Tarasick, D., Nedelec, P., Forbes, G., 5
Newchurch, M. J., Schmidlin, F. J., Johnson, B. J., Turquety, S., Baughcum, S. L., Ren, X., Fehsenfeld, F. C., Meagher, J. F., Spichtiger, N., Brown, C. C., McKeen, S. A., McDer-mid, I. S., and Leblanc, T.: Large upper tropospheric ozone enhancements above mid-latitude North America during summer: in situ evidence from the IONS and MOZAIC ozone measurement network, J. Geophys. Res., 11, D24S05, doi:10.1029/2006JD007306, 2006. 10
Cooper, O. R., Trainer, M., Thompson, A. M., Oltmans, S. J., Tarasick, D. W., Witte, J. C., Stohl, A., Eckhardt, S., Lelievekl, J., Newchurch, M., Johnson, B. J., Portmann, R. W., Kalnajs, L., Dubey, M. K., Leblanc, T., McDermid, I. S., Forbes, G., Wolfe, D., Carey-Smith, T., Morris, G. A., Lefer, B., Rappengluck, B., Joseph, E., Schmidlin, F., Meagher, J., Fehsen-feld, F. C., Keating, T. J., Van Curen, R. A., and Minschwaner, K.: Evidence for a recurring 15
Eastern North America upper tropospheric ozone maximum during summer, J. Geophys. Res., 112, D23304, doi:10.1029/2007JD008710, 2007.
Deshler, T., Mercer, J. L., Smit, H. G., Stubi, R., Levrat, G., Johnson, B. J., Oltmas, S. J., Kivi, R., Thompson, A. M., Witte, J., Davies, J., Schmidli, F. J., Brothers, G., and Sasaki, T.: Atmo-spheric comparison of electrochemical cell ozonesondes from different manufacturers, and 20
with different cathode solution strengths: the balloon experiment on Standards for ozoneson-des, J. Geophys. Res., 113, D04307, doi:10.1029/2007JD008975, 2008.
Doughty, D. C., Thompson, A. M., Schoeberl, M. R., Stajner, I., Wargan, K., and Hui, W. C. J.: An intercomparison of tropospheric ozone retrievals derived from two aura instruments and measurements in Western North America in 2006, J. Geophys. Res., 116, D06303, 25
doi:10.1029/2010JD014703, 2011.
Fairlie, T. D., Avery, M. A., Pierce, R. B., Al-Saadi, J., Dibb, J., and Sachse, G.: Impact of multiscale dynamical processes and mixing on the chemical composition of the upper tropo-sphere and lower stratotropo-sphere during the intercontinental chemical transport experiment – North America, J. Geophys. Res., 112, D16S90, doi:10.1029/2006JD007923, 2007.
30
ACPD
11, 30487–30526, 2011Validation with ozonesondes
J. L. Moody et al.
Title Page
Abstract Introduction
Conclusions References
Tables Figures
◭ ◮
◭ ◮
Back Close
Full Screen / Esc
Printer-friendly Version Interactive Discussion
Discussion
P
a
per
|
Dis
cussion
P
a
per
|
Discussion
P
a
per
|
Discussio
n
P
a
per
|
doi:10.5194/acp-3-893-2003, 2003.
Felker, S. R., Moody, J. L., Wimmers, A. J., Osterman, G., and Bowman, K.: A multi-sensor upper tropospheric ozone product (MUTOP) based on TES Ozone and GOES water vapor: derivation, Atmos. Chem. Phys., 11, 6515–6527, doi:10.5194/acp-11-6515-2011, 2011. Gettelman, A., Hoor, P., Pan, L. L., Randel, W. J., Hegglin, M. I., and Birner, T.: The ex-5
tratropical upper troposphere and lower stratasphere, Rev. Geophys., 49(RG303), 1–31, doi:10.1029/2011RG000355, 2011.
Komhyr, W. D.: Operations handbook-Ozone measurements t 40-km altitude with model 4A electrochemical concentration cell (ECC) ozonesondes (used with 1680 MHz radiosondes), NOAA Tech. Memo. ERL ARL-149, Air Resour. Lab., Boulder, Colo, 49 pp., 1986.
10
Komhyr, W. D., Barnes, R. A., Brothers, G. B., Lathrop, J. A., and Opperman, D. P.: Elec-trochemical concentration cell ozonesonde performance evaluation during STOIC 1989, J. Geophys. Res., 100, 9231–9244, 1995.
Manney, G. L., Hegglin, M. I., Daffer, W. H., Santee, M. L., Ray, E. A., Pawson, S., Schwartz, M. J., Boone, C. D., Froidevaux, L., Livesey, N. J., Read, W. G., and Walker, K. A.: 15
Jet characterization in the upper troposphere/lower stratosphere (UTLS): applications to cli-matology and transport studies, Atmos. Chem. Phys., 11, 6115–6137, doi:10.5194/acp-11-6115-2011, 2011.
Methven, J. and Hoskins, B.: Spirals in potential vorticity. Part I.: Measures of structure, J. Atmos. Sci., 55, 2053–2066, 1998.
20
Nassar, R., Logan, J. A., Worden, H. M., Megretskaia, I. A., Bowman, K. W., Osterman, G. B., Thompson, A. M., Tarasick, D. W., Austin, S., Claude, H., Dubey, M. K., Hocking, W. K., Johnson, B. J., Joseph, E., Merrill, J., Morris, G. A., Newchurch, M., Oltmans, S. J., Posny, F., Schmidlin, F. J., Vomel, H., Whiteman, D. N., and Whitte, J. C.: Validation of Tropospheric Emission Spectrometer (TES) nadir ozone profiles using ozonesonde measurements, J. 25
Geophys. Res., 113, D15S17, doi:10.1029/2007JD008819, 2008.
Osterman, G. B., Kulawik, S. S., Worden, H. M., Richards, N. A. D., Fisher, B. M., Eldering, A., Shephard, M. W., Froidevaux, L., Labow, G., Luo, M., Herman, R. L., Bowman, K. W., and Thompson, A. M.: Validation of Tropospheric Emission Spectrometer (TES) measurements of the total, stratospheric, and tropospheric column abundance of ozone, J. Geophys. Res., 30
113, D15S16, doi:10.1029/2007JD008801, 2008.
ACPD
11, 30487–30526, 2011Validation with ozonesondes
J. L. Moody et al.
Title Page
Abstract Introduction
Conclusions References
Tables Figures
◭ ◮
◭ ◮
Back Close
Full Screen / Esc
Printer-friendly Version Interactive Discussion
Discussion
P
a
per
|
Dis
cussion
P
a
per
|
Discussion
P
a
per
|
Discussio
n
P
a
per
|
Sachse, G., Thompson, A., Cohen, R., Dibb, J., Crawford, J., Rault, D., Martin, R., Szyk-man, J., and FishSzyk-man, J.: Chemical data assimilation estimates of continental US ozone and nitrogen budgets during the Intercontinental Chemical Transport Experiment – North America, J. Geophys. Res., 112, D12S21, doi:10.1029/2006JD007722, 2007.
Richards, N. A. D., Osterman, G. B., Browell, E. V., Hair, J. W., Avery, M., and Li, Q. B.: Val-5
idation of tropospheric emission spectrometer ozone profiles with aircraft observations dur-ing the intercontinental chemical transport experiment–b, J. Geophys. Res.-Atmos., 113, D16s29, doi:10.1029/2007jd008815, 2008.
Schoeberl, M. R., Ziemke, J. R., Bojkov, B., Livesey, N., Duncan, B., Strahan, S., Froide-vaux, L., Kulawik, S., Bhartia, P. K., Chandra, S., Levelt, P. F., Witte, J. C., Thompson, A. M., 10
Cuevas, E., Redondas, A., Tarasick, D. W., Davies, J., Bodeker, G., Hansen, G., John-son, B. J., Oltmans, S. J., Vomel, H., Allaart, M., Kelder, H., Newchurch, M., Godin-Beekmann, S., Ancellet, G., Claude, H., Andersen, S. B., Kyro, E., Parrondos, M., Yela, M., Zablocki, G., Moore, D., Dier, H., von der Gathen, P., Viatte, P., Stubi, R., Calpini, B., Skrivankova, P., Dorokhov, V., de Backer, H., Schmidlin, F. J., Coetzee, G., Fujiwara, M., 15
Thouret, V., Posny, F., Morris, G., Merrill, J., Leong, C. P., Koenig-Langlo, G., and Joseph, E.: A trajectory-based estimate of the tropospheric ozone column using the residual method, J. Geophys. Res.-Atmos., 112, D24s49, doi:10.1029/2007JD008773, 2007.
Smit, H. G. J., Straeter, W., Johnson, B., Oltmans, S., Davies, J., Tarasick, D. W., Hoegger, B., Stubi, R., Schmidlin, F., Northam, T., Thompson, A., Witte, J., Boyd, I. and Posny, F.: As-20
sessment of the performance of ECC-ozonesondes under quasi-flight conditions in the en-vironmental simulation chamber: insights from the Juelich Ozone Sonde Intercomparison Experiment (JOSIE), J. Geophys Res., 112, D19306, doi:10.1029/2006JD007308, 2007. Stohl, A. and Trickl, T.: A textbook example of long-range transport: simultaneous observation
of ozone maxima of stratospheric and North American origin in the free troposphere over 25
Europe, J. Geophys. Res., 104, 30445–30462, doi:10.1029/1999JD900803, 1999.
Tang, Q. and Prather, M. J.: Five blind men and an elephant: can NASA Aura measurements quantify the stratosphere-troposphere exchange of ozone flux?, Atmos. Chem. Phys. Dis-cuss., 11, 26897–26941, doi:10.5194/acpd-11-26897-2011, 2011.
Tarasick, D. W. and Slater, R.: Ozone in the troposphere: measurements, climatology, budget, 30
and trends, Atmos.-Ocean., 46(1), 93–115, doi:10.3137/ao.460105, 2008.
ACPD
11, 30487–30526, 2011Validation with ozonesondes
J. L. Moody et al.
Title Page
Abstract Introduction
Conclusions References
Tables Figures
◭ ◮
◭ ◮
Back Close
Full Screen / Esc
Printer-friendly Version Interactive Discussion
Discussion
P
a
per
|
Dis
cussion
P
a
per
|
Discussion
P
a
per
|
Discussio
n
P
a
per
|
Pudykiewicz, J. A., Kallaur, A., Moffet, R., Menard, R., Robichaud, A., Cooper, O. R., Olt-mans, S. J., Witte, J. C., Forbes, G., Johnson, B. J., Merrill, J., Moody, J. L., Morris, G., Newchurch, M. J., Schmidlin, F. J., and Joseph, E.: Comparison of Canadian air quality fore-cast models with tropospheric ozone profile measurements above midlatitude North Amer-ica during the IONS/ICARTT campaign: evidence for stratospheric input, J. Geophys. Res.-5
Atmos., 112, D12s22, doi:10.1029/2006jd007782, 2007.
Thompson, A. M., Stone, J. B., Witte, J. C., Miller, S. K., Pierce, R. B., Chatfield, R. B., Olt-mans, S. J., Cooper, O. R., Loucks, A. L., Taubman, B. F., Johnson, B. J., Joseph, E., Kucsera, T. L., Merrill, J. T., Morris, G. A., Hersey, S., Forbes, G., Newchurch, M. J., Schmidlin, F. J., Tarasick, D. W., Thouret, V., and Cammas, J. P.: Intercontinental chem-10
ical transport experiment ozonesonde network study (ions) 2004: 1. Summertime upper troposphere/lower stratosphere ozone over Northeastern North America, J. Geophys. Res.-Atmos., 112, D12s12 doi:10.1029/2006jd007441, 2007a.
Thompson, A. M., Stone, J. B., Witte, J. C., Miller, S. K., Oltmans, S. J., Kucsera, T. L., Ross, K. L., Pickering, K. E., Merrill, J. T., Forbes, G., Tarasick, D. W., Joseph, E., 15
Schmidlin, F. J., McMillan, W. W., Warner, J., Hintsa, E. J., and Johnson, J. E.: Intercontinen-tal chemical transport experiment ozonesonde network study (ions) 2004: 2. Tropospheric ozone budgets and variability over Northeastern North America, J. Geophys. Res.-Atmos., 112, D12s13, doi:10.1029/2006jd007670, 2007b.
Thompson, A. M., Yorks, J. E., Miller, S. K., Witte, J. C., Dougherty, K. M., Morris, G. A., Baum-20
gardner, D., Ladino, L., and Rappengl ¨uck, B.: Tropospheric ozone sources and wave ac-tivity over Mexico City and Houston during MILAGRO/Intercontinental Transport Experiment (INTEX-B) Ozonesonde Network Study, 2006 (IONS-06), Atmos. Chem. Phys., 8, 5113– 5125, doi:10.5194/acp-8-5113-2008, 2008.
Trickl, T., B ¨artsch-Ritter, N., Eisele, H., Furger, M., M ¨ucke, R., Sprenger, M., and Stohl, A.: High-25
ozone layers in the middle and upper troposphere above Central Europe: potential import from the stratosphere along the subtropical jet stream, Atmos. Chem. Phys., 11, 9343–9366, doi:10.5194/acp-11-9343-2011, 2011.
Wimmers, A. J. and Moody, J. L.: A fixed-layer estimation of upper tropospheric specific hu-midity from the GOES water vapor channel: parameterization and validation of the altered 30
brightness temperature product, J. Geophys. Res., 106, 17115–17132, 2001.
ACPD
11, 30487–30526, 2011Validation with ozonesondes
J. L. Moody et al.
Title Page
Abstract Introduction
Conclusions References
Tables Figures
◭ ◮
◭ ◮
Back Close
Full Screen / Esc
Printer-friendly Version Interactive Discussion
Discussion
P
a
per
|
Dis
cussion
P
a
per
|
Discussion
P
a
per
|
Discussio
n
P
a
per
|
doi:10.1175/2010JAMC2589.1, 2011
Wimmers, A. J., Moody, J. L., Browell, E. V., Hair J. W., Grant, W. B., Butler, C. F., Fenn, M. A., Schmidt, C. C., Li, J., and Ridley, B. A.: Signatures of tropopause folding in satellite im-agery, J. Geophys. Res., 108(D4), 8360, doi:10.1029/2001JD001358, 2003.
Wernli, H. and Sprenger, M.: Identification and ERA-15 climatology of potential vorticity 5
streamers and cutoffs near the extratropical tropopause, J. Atmos. Sci., 64, 1569–1586, doi:10.1175/JAS3912.1, 2007.
Worden, J. S., Kulawik, S. S., Shepard, M., Clough, S., Worden, H., Bowman, K., and Gold-man, A.: Predicted errors of Tropospheric Emission Spectrometer nadir retrievals from spec-tral window selection, J. Geophys. Res., 109, D09308, doi:10.1029/2004JD004522, 2004. 10
Worden, H. M., Logan, J. A., Worden, J. R., Beer, R., Bowman, K., Clough, S. A., Eldering, A., Fisher, B. M., Gunson, M. R., Herman, R. L., Kulawik, S. S., Lampel, M. C., Luo, M., Megret-skaia, I. A., Osterman, G. B., and Shepard, M. W.: Comparisons of Tropospheric Emission Spectrometer (TES) ozone profiles to ozonesondes: methods and initial results, J. Geophys. Res., 112, D03309, doi:10.1029/2006JD007258, 2007.
15
Ziemke, J. R., Chandra, S., Duncan, B. N., Froidevaux, L., Bhartia, P. K., Levelt, P. F., and Waters, J. W.: Tropospheric ozone determined from Aura OMI and MLS: evaluation of mea-surements and comparison with the Global Modeling Initiative’s Chemical Transport Model, J. Geophys. Res.-Atmos., 111, D19303, doi:10.1029/2006JD007089, 2006.
Ziemke, J. R., Chandra, S., Labow, G. J., Bhartia, P. K., Froidevaux, L., and Witte, J. C.: 20