–
Groundwater recharge behavior based on surface runoff
hydrographs in two basins of the Minas Gerais State
doi: 10.4136/ambi-agua.1127
Matheus Fonseca Durães*; Carlos Rogério de Mello
Universidade Federal de Lavras - Lavras, MG, Brasil Departamento de Engenharia, Núcleo Água e Solo *Corresponding author: e-mail: [email protected],
ABSTRACT
The interaction between the surface and groundwater occurs in a dynamic and interconnected way allowing the use of direct and indirect methods for hydro-geological characterization and its contribution to the surface flow. The recession rates and the groundwater flow can be obtained by using the Barnes’ Method. Precipitation is the main component associated with the aquifer recharge process and may also be expressed as a Precipitation Concentration Index (PCI). This work presents recharge data sets based on the separation of the surface hydrograph for the Paraopeba and Sapucaí river basins, in Minas Gerais State. The effect of precipitation on groundwater recharge in the Sapucaí basin is more significant than that of the Paraopeba basin due to predominant land-use and its water and climatic regimes. The contribution of the base flow to total runoff in the Sapucaí basin could exceed 70% in some sub-basins, especially those near the Mantiqueira Range, demonstrating that even in areas with high rainfall concentration the influence of the Atlantic Forest in this process is highly significant.
Keywords: Barne’s method, recharge, precipitation.
Comportamento da recarga de agua subterránea com base em
hidrogramas de escoamento superficial em duas bacias hidrográficas
do Estado de Minas Gerais
RESUMO
concentração de chuvas a influência da Mata Atlântica neste processo é altamente significativa.
Palavras-chave: método de Barnes, recarga, precipitação.
1. INTRODUCTION
Water availability in a basin normally is determined through the water balance, quantifying precipitation, evapo-transpiration, soil moisture and surface runoff. The first two components can be measured directly or indirectly from weather stations and soil moisture devices while the surface runoff is measured in fluviometric stations.
Groundwater resources are strategic in many regions around the world due to the scarcity or even the total unavailability of surface water. Knowledge of aquifer recharge is an aid for optimal exploitation of groundwater (Melo et al., 2005).
Groundwater recharge can be defined as the percolation of water through the soil profile into the saturated zone, forming a reserve of additional water. Recharge can occur naturally by rainfall, by rivers and even by irrigation (Melo et al. 2005).
Estimation of the recharge rates can be performed based on data sets of discharges with the hydrograph components separated, being the most common estimates based upon groundwater flow, or base flow (Chen and Lee, 2003). This estimate can be made based on hydrographs, using a variety of manual (Barnes, 1939) or automated methods (Eckhardt, 2005). The hydrograph can be separated into four phases over time: (i) ascension or growth curve, which corresponds to the increase in flow that occurs as a result of precipitation, (ii) the peak region of the hydrograph, where the maximum flow occurs, (iii) decreasing curve, corresponding to the progressive decrease of the direct surface runoff until it vanishes and (iv) recession or depletion curve, which corresponds only to base flow contribution.
Base flow analysis can be extremely useful in the evaluation of aquifer reserves, storage capacity, in study of river systems and in watershed management, as it represents the contribution of groundwater to the surface flow as well as the natural regulatory capacity of the basin (Price, 2011).
Therefore, the objective of this study was to evaluate the average representative groundwater recharge behavior in two important basins of the Minas Gerais State based on the analysis of surface runoff hydrographs.
2. MATERIALS AND METHODS
2.1. Characterization of the study area
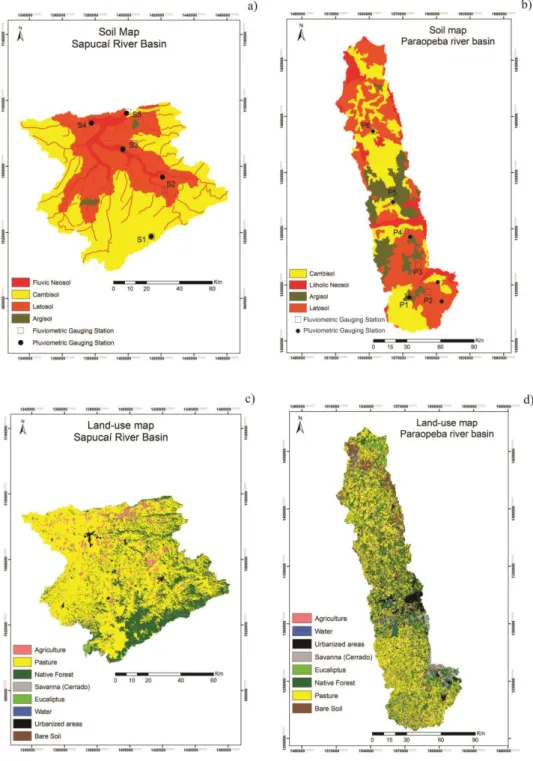
The study areas are the Paraopeba river basin, which is a tributary of the São Francisco River, located in Central region of Minas Gerais State at the amplitude of coordinates -20°51’00”S and -18°34’58” S Latitude and -45°10’59”W and -43°37’59” W Longitude, with a drainage area of about 13,640 km². Sapucaí river basin is the other studied area, composing part of the Grande River basin, located in the Southern Minas Gerais, at the amplitude of coordinates -22°33’16” S and -22°53’8.5” S Latitude and -45°42’5” W and -45°44’7” W Longitude, with a drainage area of about 8,882 km².
facilities. It is noteworthy that both reservoirs, besides their power generation function, have a hydrological function of outflow regularization downstream from them.
The predominant soils in the Sapucaí basin (Figure 1a) are Latosols (32.04%), Cambisols (56.38%), Argisols (0.72%) and Fluvic Neosols (10.87%). For Paraopeba basin (Figure 1b), the dominant soil classes are Latosols (39.68%), Cambisols (34.97%), Argisols (16.97%) and Litholic Neosols (8.39%), according to that presented in Durães et al. (2011). Table 1 shows the percentages and distribution of land use classes for each basin, while Figure 1 (c, d) depicts the spatial distribution of the respective classes.
Table 1. Percentage distribution of land use classes in the basins studied.
Land use % in Paraopeba Basin % in Basin Sapucaí
Agriculture 7.55 13.77
Water 0.98 0.05
Urbanization 2.08 0.81
Savanna
(Cerrado) 2.82 0.46
Eucalyptus 1.85 0.37
Native Forest 23.83 23.82
Pasture 51.47 60.27
Bare soil 9.41 0.45
2.2. Data base
Fluviometric and rainfall data sets applied to the study were obtained from the National Water Agency, through the website HIDROWEB/ANA (www.hidroweb.ana.gov.br). Tables 2 and 3 show the basic information from fluviometric and pluviometric gauging stations, respectively Figure 1(a and b) also presents the spatial localization of the gauging stations in each of the studied basins.
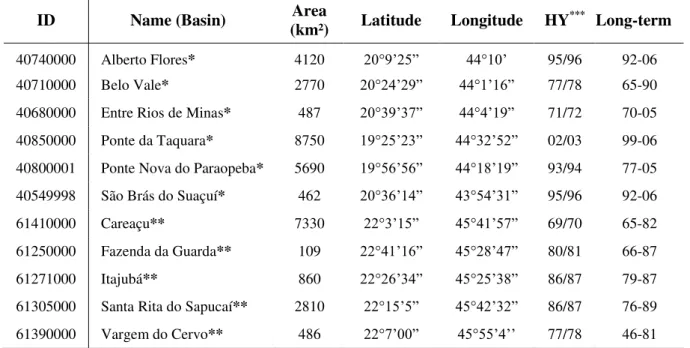
Table 2. Basic characterization of the fluviometric stations used in this study.
ID Name (Basin) (km²) Area Latitude Longitude HY*** Long-term
40740000 Alberto Flores* 4120 20°9’25” 44°10’ 95/96 92-06
40710000 Belo Vale* 2770 20°24’29” 44°1’16” 77/78 65-90
40680000 Entre Rios de Minas* 487 20°39’37” 44°4’19” 71/72 70-05 40850000 Ponte da Taquara* 8750 19°25’23” 44°32’52” 02/03 99-06 40800001 Ponte Nova do Paraopeba* 5690 19°56’56” 44°18’19” 93/94 77-05 40549998 São Brás do Suaçuí* 462 20°36’14” 43°54’31” 95/96 92-06
61410000 Careaçu** 7330 22°3’15” 45°41’57” 69/70 65-82
61250000 Fazenda da Guarda** 109 22°41’16” 45°28’47” 80/81 66-87
61271000 Itajubá** 860 22°26’34” 45°25’38” 86/87 79-87
61305000 Santa Rita do Sapucaí** 2810 22°15’5” 45°42’32” 86/87 76-89 61390000 Vargem do Cervo** 486 22°7’00” 45°55’4’’ 77/78 46-81
Note:*: Paraopeba River Basin; **: Sapucaí River Basin; *** HY: Hydrological Year.
Table3. Basic characterization of the pluviometric stations used in this study.
ID Name Latitude Longitude Basin
2043013 Congonhas – Linígrafo 20°31’19” 43°49”48” Paraopeba
2043005 Conselheiro Lafaiete 20°39’54” 43°46’40” Paraopeba
2044007 Entre Rios de Minas 20°39’40” 44°4’14” Paraopeba
2044008 Melo Franco 20°11’52” 44°7’15” Paraopeba
1944031 Ponte da Taquara 19°25’24” 44°32’54” Paraopeba
1944004 Ponte Nova do Paraopeba 19°57’20” 44°18’24” Paraopeba
2245070 Brasópolis 22°28’17” 45°37’19” Sapucaí
2245074 Careaçu 22°3’10” 45°41’56” Sapucaí
2245010 Fazenda da Guarda 22°41’20” 45°28’53” Sapucaí
2245083 São João de Itajubá 22°22’32” 45°26’49” Sapucaí
2245085 Vargem do Cervo 22°7’56” 45°55’40” Sapucaí
2.3. Precipitation Concentration Index – PCI
Precipitation is one of the most important components of the hydrological cycle, directly affecting the availability of water resources. In this context, there are a variety of indicators that assess its behavior, providing information about its temporal variability and allowing evaluation of the hydrological processes (Apaydin et al., 2006). Thus, the Precipitation Concentration Index (PCI) may be recommended since it allows inferences on rain concentration behavior (Luis et al., 2011), and can have a direct influence on the groundwater recharge process and on base flow behavior.
The PCI (Oliver, 1980), proposed as an indicator of rain concentration (Michiels et al., 1992), can be calculated based on the average precipitation of each month (Pi) of the year,
according to the following Equation 1:
2 12 1 i i 12 1 i 2 i P P ICP
[1]
According to Luis et al. (2011), we can classify the concentration of precipitation for a given region as “Uniform” (PCI <10), “Moderately Seasonal” (PCI between 11 and 15), “Seasonal” (PCI between 16 and 20) and “Irregular” (PCI> 20).
2.4. Hydrograph analyzes
To estimate the groundwater recharge from the discharge data sets, we used a method based on the recession-curve displacement, known as Barnes’ Method. Through the daily flows (hydrographs) and daily precipitation data sets corresponding to the respective representative hydrological year (HY), recession curves and recession coefficients were defined following the fundamentals of the exponential Equation 2 of Maillet:
t
exp Q
Qt t1 [2]
the faster and slower flows often occur simultaneously and could be grouped to surface or groundwater flows, as occurs with subsurface flow in headwater basins (Chappell, 2005). Therefore, although they are arbitrary techniques, they can be adequate due to their representativeness of the results.
The Barnes’ Method is often used in hydrogeology to evaluate the potential for groundwater recharge of shallow aquifers, considering that it provides results close to reality. This method relies on the linearity of the recession when this is analyzed with flow rates on a logarithmic scale, since groundwater flow is basically the result of the recharging process (Prince, 2011).
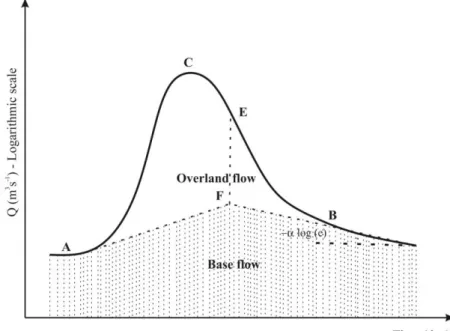
When the hydrographs are plotted on semi-log paper, with time (in days) on arithmetic scale on the abscissa and the logarithm of the flow rate (m³ s-1) on the ordinate, the recession of the groundwater flow is represented by a line whose slope is - ⍺ [log (e)] (Figure 2). Subsequently, this line is extended toward the y-axis to the vertical that passes through the inflection point "E", defining point "F", which is then attached to the "A" point (ascension point of hydrograph). The portion underlying this line corresponds to the base flow (Figure 2).
Figure 2. Graphical method of Barnes (adapted from Costa and Bacellar, 2010).
3. RESULTS AND DISCUSSION
The average annual precipitation for the Paraopeba river basin was 1,453 mm, with a minimum of 1,254 mm and a maximum of 1,580 mm for the years studied. For the Sapucaí river basin, the average annual rainfall was 1,529 mm, with a minimum of 1,256 mm and a maximum of 1,739 mm.
classify the Sapucai basin with a precipitation concentration regime of “Moderately Seasonal”, while Paraopeba basin is classified as “Seasonal”, meaning that in the first basin the precipitation throughout the year is better distributed.
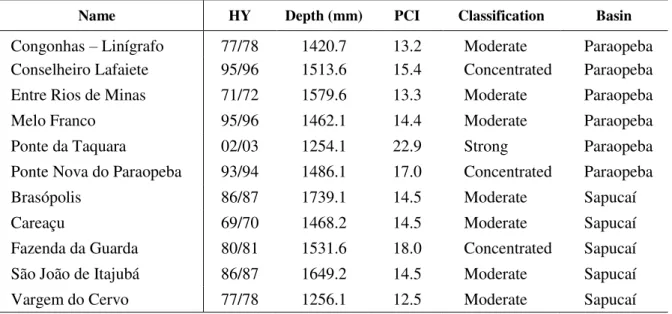
Table 4. Precipitation behavior of the representative hydrological years in the basins studied.
Name HY Depth (mm) PCI Classification Basin
Congonhas – Linígrafo 77/78 1420.7 13.2 Moderate Paraopeba
Conselheiro Lafaiete 95/96 1513.6 15.4 Concentrated Paraopeba
Entre Rios de Minas 71/72 1579.6 13.3 Moderate Paraopeba
Melo Franco 95/96 1462.1 14.4 Moderate Paraopeba
Ponte da Taquara 02/03 1254.1 22.9 Strong Paraopeba
Ponte Nova do Paraopeba 93/94 1486.1 17.0 Concentrated Paraopeba
Brasópolis 86/87 1739.1 14.5 Moderate Sapucaí
Careaçu 69/70 1468.2 14.5 Moderate Sapucaí
Fazenda da Guarda 80/81 1531.6 18.0 Concentrated Sapucaí
São João de Itajubá 86/87 1649.2 14.5 Moderate Sapucaí
Vargem do Cervo 77/78 1256.1 12.5 Moderate Sapucaí
Ponte Nova do Paraopeba station, located in the Paraopeba basin, presented behavior similar to Fazenda da Guarda station (rainfall more concentrated), but it should be noted that the concentrated character of the rain in that region is more significant because the land use is predominantly extensive pasture and urbanized areas, reducing the groundwater recharge conditions, especially affecting water infiltration into the soil.
Analyzing the representative hydrological years for the Paraopeba basin, we see an average base flow of 320.74 mm, corresponding to 61.2% of the total runoff and 22.1% of the average precipitation for the hydrological years. Regarding the Sapucaí basin, there was an average base flow of 511.2 mm, corresponding to 63.4% of the total runoff and 33.43% of the precipitation. These results demonstrate the importance of the pluvial regime on the recharge process, where in the basin with more concentration of precipitation (Paraopeba) there is lower recharge depth (Table 5).
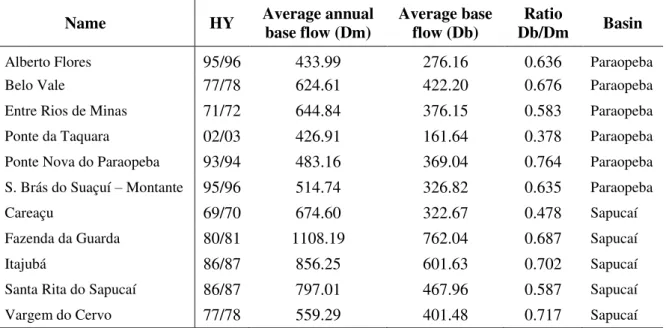
For Fazenda da Guarda station, the base flow was approximately 762 mm, which corresponds to 49.75% of the precipitation. Although there is a higher concentration of precipitation in this station in relation to the Sapucai river basin is a whole, this result demonstrates the contribution to recharge, storage and base flow regulation of the Atlantic Forest environments, especially in the Mantiqueira Range. However, as noted earlier, in these environments the participation of subsurface flow can be significant and can even be counted as base flow due to the difficulties associated with the uncertainty of flow separation methods. Menezes et al. (2009), analyzing a simplified water balance in two micro-catchments of the Mantiqueira Range occupied by Atlantic Forest and extensive pasture, found that the base flow is three times greater for the first micro-catchment. This result was explained due to the positive impact of the Atlantic Forest on the formation of the preferential flows in the soil profile.
authors concluded that the soil quality, characterized based on hydrological indicators of soil, is considerably higher in the Mantiqueira Range environment occupied by Atlantic Forest.
Table 5. Behavior of base flow in the fluviometric sections studied.
Name HY Average annual base flow (Dm) Average base flow (Db) Db/Dm Ratio Basin
Alberto Flores 95/96 433.99 276.16 0.636 Paraopeba
Belo Vale 77/78 624.61 422.20 0.676 Paraopeba
Entre Rios de Minas 71/72 644.84 376.15 0.583 Paraopeba
Ponte da Taquara 02/03 426.91 161.64 0.378 Paraopeba
Ponte Nova do Paraopeba 93/94 483.16 369.04 0.764 Paraopeba
S. Brás do Suaçuí – Montante 95/96 514.74 326.82 0.635 Paraopeba
Careaçu 69/70 674.60 322.67 0.478 Sapucaí
Fazenda da Guarda 80/81 1108.19 762.04 0.687 Sapucaí
Itajubá 86/87 856.25 601.63 0.702 Sapucaí
Santa Rita do Sapucaí 86/87 797.01 467.96 0.587 Sapucaí
Vargem do Cervo 77/78 559.29 401.48 0.717 Sapucaí
For Wittenberg and Sivapalan (1999), only a small portion of the precipitation acts directly on the groundwater recharge and may be greater than 30% in temperate regions and less than 5% in semi-arid conditions. In this context, the Sapucaí river basin presents a higher proportion between base runoff and precipitation of the representative hydrological year in relation to the Paraopeba river basin due to some important aspects, highlighting the less urbanized area, better rainfall distribution throughout the hydrological year and lower atmospheric demand due to meteorological conditions of a Cwb climate, closer to subtropical, with milder temperatures in the summer, and a better preserved headwater region, with representative Atlantic Forest areas.
4. CONCLUSIONS
The average base runoff was 320.74 mm for the Paraopeba basin and 511.2 mm for the Sapucaí basin., with the ratio between this and total runoff more significant for the latter, especially in its headwater region (Mantiqueira Range), whose base flow and precipitation ratio corresponded to 49.75%, proving to be a strategic area regarding the recharge of aquifers and water availability.
The temporal concentration of precipitation for the Paraopeba basin ranged from “Seasonal” to “Irregular”, while for the Sapucaí river basin this variation was from “Moderately Seasonal” to “Seasonal”, demonstrating the negative effect of this concentration on groundwater recharge conditions of the first basin.
5. REFERENCES
ALVARENGA, C. C.; MELLO, C. R.; MELLO, J. M.; SILVA, A. M.; CURI, N. Índice de qualidade do solo associado à recarga de água subterrânea (IQSRA) na bacia hidrográfica
APAYDIN, H.; ERPUL, G.; BAYRAMIN, I.; GABRIELS, D. Evaluation of indices for characterizing the distribution and concentration of precipitation: a case for the region of Southeastern Anatolia Project, Turkey. Journal of Hydrology, Amsterdam, v. 328, n. 3-4, p. 726–732, 2006. http://dx.doi.org/10.1016/j.jhydrol.2006.01.019
BARNES, B. S. The structure of discharge recession curves. Transactions of American Geophysical Union, Washington, v. 20, n. 2, p. 721-725, 1939. http://dx.doi.org/ 10.1029/TR020i004p00721
CHAPPELL, N. A. Water pathways in humid forests: myths vs. observations. Water Science and Technology, Viena, v. 48, n. 1, p. 32-46, 2005.
CHEN, W.; LEE, C. Estimating ground-water recharge from streamflow records.
Environmental Geology, New York, v. 44, n. 3, p. 257-265, 2003. http://dx.doi.org/10.1007/s00254-002-0753-2
COSTA, F. M.; BACELLAR, L. A. P. Caracterização hidrogeológica de aquíferos a partir do fluxo de base. Revista Brasileira de Recursos Hídricos, Porto Alegre, v. 15, n. 3, p. 173-183, 2010.
DURAES, M. F.; MELLO, C. R.; NAGHETTINI, M. Applicability of the SWAT model for hydrologic simulation in Paraopeba River Basin, MG. Cerne, Lavras, v. 17, n. 4, p. 481-488, 2011.
ECKHARDT, K. How to construct recursive digital filters for base flow separation?
Hydrological Processes, Hoboken, v. 19, n. 2, p. 507-515, 2005. http://dx.doi.org/10.1002/hyp.5675
LUIS, M.; GONZÁLES-HIDALGO, J. C.; BRUNETTI, M.; LONGARES, L. A. Precipitation concentration changes in Spain 1946-2005. Natural Hazards and Earth System Sciences, Munich, v. 11, n. 5, p. 1259-1265, 2011. http://dx.doi.org//10.5194/nhess-11-1259-2011
MELLO, C.R.; CURI, N. Hydropedology. Ciência e Agrotecnologia, Lavras, v. 36, n. 2, p. 137-146, 2012. http://dx.doi.org/10.1590/S1413-70542012000200001
MELO, J. G.; STEIN, P.; VASCONCELOS, M. B.; SILVA, F. H. R. Fatores condicionantes na recarga do aquífero Açu na borda sudoeste na bacia Potiguar, RN. Águas Subterrâneas, São Paulo, v. 19, n. 2, p. 105-122, 2005.
MENEZES, M. D.; JUNQUEIRA JUNIOR, J. A.; MELLO, C. R.; SILVA, A. M.; CURI, N.; MARQUES, J. J. Dinâmica hidrológica de duas nascentes, associada ao uso do solo, características pedológicas e atributos físico-hídricos na sub-bacia hidrográfica do Ribeirão Lavrinha - Serra da Mantiqueira (MG). Scientia Forestalis (IPEF), Piracicaba, v. 37, n. 82, p. 175-184, 2009.
MICHIELS, P.; GABRIELS, D.; HARTMANN, R. Using the seasonal land temporal precipitation concentration index for characterizing monthly rainfall distribution in Spain. Catena, Amsterdam, v. 19, n. 1, p. 43–58, 1992. http://dx.doi.org/10.1016/0341-8162(92)90016-5
PRICE, K. Effects of watershed topography, soils, land us, and climate on baseflow hydrology in humid regions: a review. Progress in Physical Geography, Thousand Oaks, v. 35, n. 4, p. 465-492, 2011. http://dx.doi.org/10.1177/0309133311402714