GEOGRAPHIA
NAPOCENSIS
An.
III, nr. 1 /
2009
geografie.acad-cluj.ro
ASSESSING THE AVERAGE MULTI-ANNUAL RUNOFF
IN THE TUR RIVER BASIN
Oana POP 1, Csaba HORVÁTH 2 1
Universitatea”Babeş-Bolyai” Cluj-Napoca, Facultatea de Geografie, str. Clinicilor 5-7, 400006, Cluj-Napoca, România
2
Academia Română, Filiala Cluj, Colectivul de Geografie, str. Republicii nr.9, Cluj-Napoca, România
ABSTRACT.- Assessing the average multi-annual runoff in the Tur River Basin. The rivers multiannual runoff is the mean parameter for evaluating the rivers water resources and represents an important characteristic in the rivers water utilization research. The inventory methods to asses the average multi-annual runoffs are various, depending mostly from the available database. In this study we used data from eight hydrometrical stations representing data between the years 1979 and 2007. We present in this study a base method of assessing the average multiannual runoff resolved with traditional and modern GIS methods.
Keywords: multi-annual average runoff, correlation, validity curve.
1. General problems.
The Tur River Basin is situated in the North-Western part of Romania. The basin tributaries are part of the countries north river group, formed in humid climatic conditions, with annual precipitation of 700-1200 mm/year. The rivers hydrologic regime is variable because of the accentuated pluviosity of the climate and because of the frequent warming’s in the winter which are reflected in the regime of the main collector and its tributaries – the regime type is west-pericarpathian.
GEOGRAPHIA
NAPOCENSIS
An.
III, nr. 1 /
2009
geografie.acad-cluj.ro
wide valleys and smooth hills contribute also to the climatic elements homogeneity.
2. Multi-annual average runoff assessment.
The average runoff is one of the most general indicator for the rivers water resources. It represents the rivers water potential proportion, being very important in all the studies which want to research the rational water utilization possibilities.
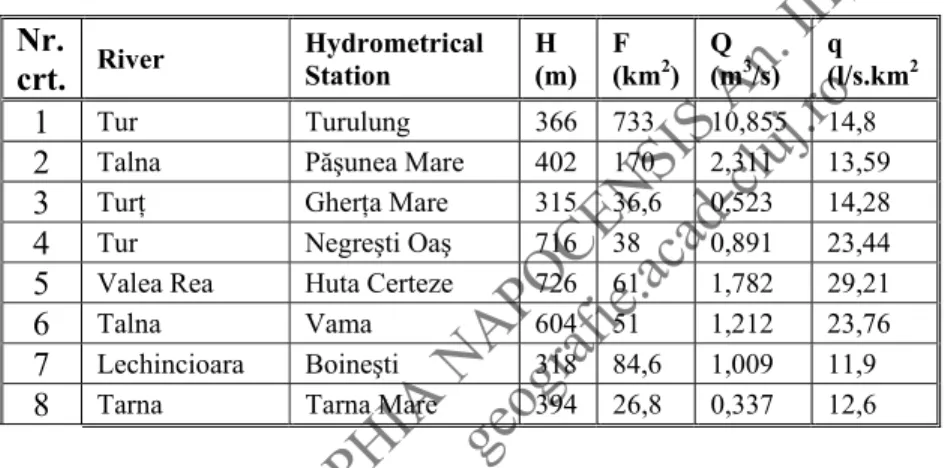
The runoff yearly variation is varying in time and space, because the variation amplitude of the yearly runoff is determined as much by the climatic characteristics as by the surface of the hydrographic basins (Sorocovschi, 2005). For the study of the Tur River Basin runoff condition characteristics we used data from eight hydrological stations, with data between the years 1979 and 2007. The correlation between the values of the specific average runoff and the hydrometrical stations basins average altitude (Table 1.) permitted the identification of a validity curve (fig. 1.).
Table 1.Base data for the multi-annual average runoff (1979-2007)
Nr. crt. River
Hydrometrical Station
H (m)
F (km2)
Q (m3/s)
q
(l/s.km2
1 Tur Turulung 366 733 10,855 14,8
2 Talna P şunea Mare 402 170 2,311 13,59
3 Tur Gher a Mare 315 36,6 0,523 14,28
4 Tur Negreşti Oaş 716 38 0,891 23,44
5 Valea Rea Huta Certeze 726 61 1,782 29,21
6 Talna Vama 604 51 1,212 23,76
7 Lechincioara Boineşti 318 84,6 1,009 11,9
8 Tarna Tarna Mare 394 26,8 0,337 12,6
GEOGRAPHIA
NAPOCENSIS
An.
III, nr. 1 /
2009
geografie.acad-cluj.ro
With the curves equation we extrapolated the values to altitudes which doesn’t have hydrometrical measurements. Accordingly, after imputing the stations average altitudinal values and the average specific multiannual runoff data we used the “CurveExpert 1,3” software to find the best curve which fit the database.
So, the accepted curve was a linear one and its equation is,
y = a + bx
where the coefficients are equal to, a=4,0 and b=0,025.
Also, with the creation of the maps, by reintroducing the computed data on the altitudinal stripes, it was possible to asses the river basin average runoff value by the software statistical tools. The digital elevation model was classified at 50 m intervals and then it was reclassified with the computed data creating a new grid surface, on which we could run the Cell Statistic extension of the software for the resolution of the original grid (40 meters). So, the river basin average multi-annual runoff value equaled 353,5 mm.
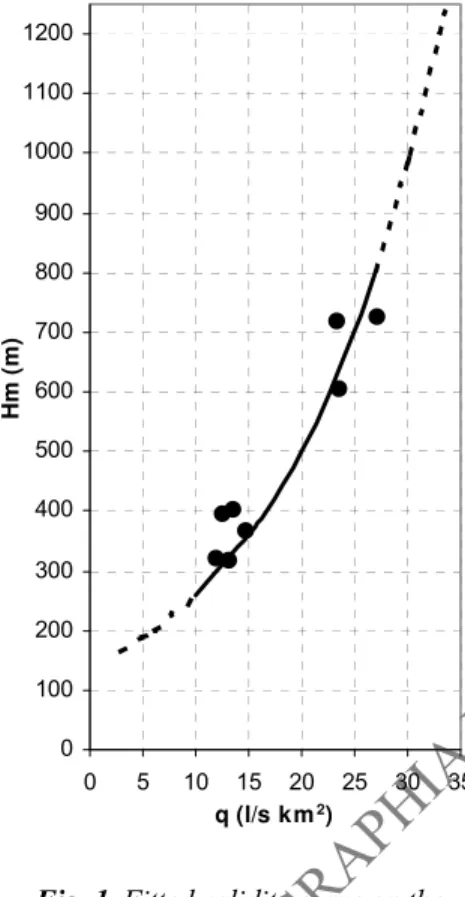
For assessing and verifying the computed data, we used the values of the Turulung hydrometrical station (Table 3.), the last station on the Tur River in Romania. So, the computed runoff value of 10,535
m3/s, is according to the acceptable error, reaching only 2,63% using the measured multiannual data of the station which is 10,855 m3/s.
0 100 200 300 400 500 600 700 800 900 1000 1100 1200
0 5 10 15 20 25 30 35 q (l/s km2)
Hm
(
m
)
Fig. 1. Fitted validity curve on the specific runoff and the average altitude
GEOGRAPHIA
NAPOCENSIS
An.
III, nr. 1 /
2009
geografie.acad-cluj.ro
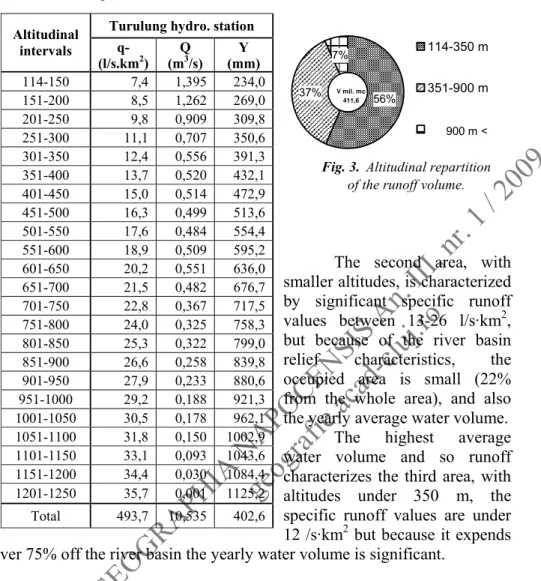
Fig. 2. Tur River Basin specific runoff map (l/s·km2)
From the study of the computed data (Table 2) we observe that in the altitudinal interval of 114 and 350 meters the annual runoff volume is significant, in summing 231,6 million m3 water/year, representing 56% from the total runoff volume (Fig. 3.).
The next altitudinal interval between 351 and 900 meters represents 37% from the annual runoff volume, respectively 152,4 million m3 water/year. The highest altitudes, over 900 meters represent only 7% of the multi-annual runoff volume.
GEOGRAPHIA
NAPOCENSIS
An.
III, nr. 1 /
2009
geografie.acad-cluj.ro
Table 2.Tur River Basin runoff repartition on altitudinal intervals.
Tur River Basin Altitudinal
intervals q-
(l/s.km2)
F (km2)
Q (m3/s)
V (mil. m3)
Y (mm)
% of entire volume
114-150 7,4 527,189 3,911 123,349 234,0 30,0
151-200 8,5 147,917 1,262 39,795 269,0 9,7
201-250 9,8 92,492 0,909 28,654 309,8 7,0
251-300 11,1 63,586 0,707 22,292 350,6 5,4
301-350 12,4 44,829 0,556 17,544 391,3 4,3
351-400 13,7 37,943 0,520 16,396 432,1 4,0
401-450 15,0 34,277 0,514 16,209 472,9 3,9
451-500 16,3 30,653 0,499 15,745 513,6 3,8
501-550 17,6 27,517 0,484 15,256 554,4 3,7
551-600 18,9 26,984 0,509 16,061 595,2 3,9
601-650 20,2 27,342 0,551 17,388 636,0 4,2
651-700 21,5 22,446 0,482 15,190 676,7 3,7
701-750 22,8 16,116 0,367 11,563 717,5 2,8
751-800 24,0 13,533 0,325 10,262 758,3 2,5
801-850 25,3 12,722 0,322 10,165 799,0 2,5
851-900 26,6 9,692 0,258 8,139 839,8 2,0
901-950 27,9 8,355 0,233 7,357 880,6 1,8
951-1000 29,2 6,429 0,188 5,923 921,3 1,4
1001-1050 30,5 5,834 0,178 5,613 962,1 1,4
1051-1100 31,8 4,731 0,150 4,745 1002,9 1,2
1101-1150 33,1 2,815 0,093 2,938 1043,6 0,7
1151-1200 34,4 0,881 0,030 0,955 1084,4 0,2
1201-1250 35,7 0,026 0,001 0,030 1125,2 0,0
Total - 1164,3 13,1 411,6 353,5 100,0
3. Conclusions
In the Tur river basin we can distinguish three different areas regarding the average multi-annual runoff, so we have an area which has altitudes over 900 meters, an other one with altitudes between 350 and 900 meters, and the last one altitudes under 350 meters.
GEOGRAPHIA
NAPOCENSIS
An.
III, nr. 1 /
2009
geografie.acad-cluj.ro
(only 3% from the whole studied area) the corresponding water volume is also modest.
Table 2. Assessing and verifying the computed data.
The second area, with smaller altitudes, is characterized by significant specific runoff values between 13-26 l/s·km2, but because of the river basin relief characteristics, the occupied area is small (22% from the whole area), and also the yearly average water volume.
The highest average water volume and so runoff characterizes the third area, with altitudes under 350 m, the specific runoff values are under 12 /s·km2 but because it expends over 75% off the river basin the yearly water volume is significant.
Turulung hydro. station Altitudinal
intervals q-
(l/s.km2) Q (m3/s)
Y (mm)
114-150 7,4 1,395 234,0
151-200 8,5 1,262 269,0
201-250 9,8 0,909 309,8
251-300 11,1 0,707 350,6
301-350 12,4 0,556 391,3
351-400 13,7 0,520 432,1
401-450 15,0 0,514 472,9
451-500 16,3 0,499 513,6
501-550 17,6 0,484 554,4
551-600 18,9 0,509 595,2
601-650 20,2 0,551 636,0
651-700 21,5 0,482 676,7
701-750 22,8 0,367 717,5
751-800 24,0 0,325 758,3
801-850 25,3 0,322 799,0
851-900 26,6 0,258 839,8
901-950 27,9 0,233 880,6
951-1000 29,2 0,188 921,3
1001-1050 30,5 0,178 962,1
1051-1100 31,8 0,150 1002,9
1101-1150 33,1 0,093 1043,6
1151-1200 34,4 0,030 1084,4
1201-1250 35,7 0,001 1125,2
Total 493,7 10,535 402,6
Fig. 3. Altitudinal repartition
of the runoff volume.
56% 37%
7% 114-350 m
351-900 m
900 m <
GEOGRAPHIA
NAPOCENSIS
An.
III, nr. 1 /
2009
geografie.acad-cluj.ro
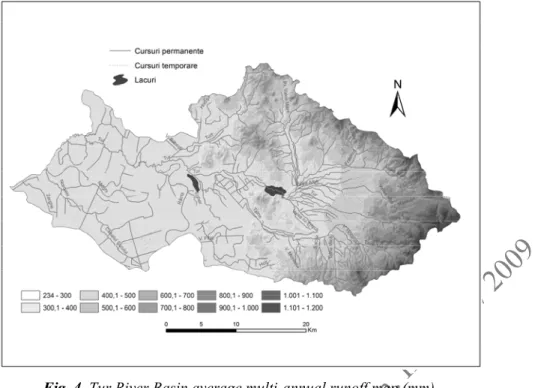
Fig. 4. Tur River Basin average multi-annual runoff map (mm).
R E F E R E N C E S
SOROCOVSCHI V. (1977), Probleme metodologice privind studiul resurselor de apă, Studia Univ. Babeş-Bolyai, nr. 2 ,XXII, Cluj-Napoca.
SOROCOVSCHI V. (2005), Câmpia Transilvaniei. Studiu hidrogeografic, Edit. Casa C r ii de Ştiin , Cluj-Napoca.
SOROCOVSCHI V., HORVATH, CS., BILASCO ŞT. (2009), Water balance in the south part of the Someşean Plateau, Studia Univ. Babeş-Bolyai, nr. 2 , Cluj-Napoca.
STAROSOLSZKY O. (1987), Applied surface hydrology, WaterResources
Publications, Colorado
UJVARI, I. (1972), Geografia apelor României, Edit. Ştiin ific , Bucureşti.
http://www.esri.com/