Yield adaptability and stability of semi-erect cowpea genotypes in the
Northeast region of Brazil by REML/BLUP
1Adaptabilidade e estabilidade produtiva de genótipos de feijão-caupi semieretos no
Nordeste do Brasil via REML/BLUP
Maurisrael de Moura Rocha2*, Kaesel Jackson Damasceno-Silva2, José Ângelo Nogueira de Menezes-Júnior2, Hélio Wilson Lemos de Carvalho3, Antônio Félix da Costa4, João Maria Pinheiro de Lima5, João Felinto dos Santos6, Cândida Hermínia Campos de Magalhães Bertini7, Adriana Rodrigues Passos8 and Otoniel Magalhães Morais9
ABSTRACT - Cowpea is grown in the various soil and climatic conditions of the Northeast region of Brazil. Thus, selecting and developing cultivars with high yield, stability, and adaptability for this region is necessary due to the genotype × environment interaction. The objective of this work was to select cowpea lines of semi-erect plant simultaneously for high yield, adaptability, and genotypic stability in the Northeast region of Brazil by the REML/BLUP procedure. Twenty semi-erect genotypes— 15 lines and five cultivars—were evaluated in 37 environments of the Northeast region from 2013-2015. The experiments were carried out under rainfed conditions in a randomized complete block design with four replications. The adaptability and genotypic stability were evaluated by the REML/BLUP procedure. The environmental variance was the largest factor in the phenotypic variance and the genotype × environment interaction was complex-type, with a grain yield ranging from 277 kg ha-1
(Serra Talhada PE, 2015) to 2,845 kg ha-1 (São Raimundo das Mangabeiras MA, 2013), and an overall mean of 1,342 kg ha-1.
According to the Harmonic Mean of Relative Performance of Genetic Values (HMRPGV) estimates, the lines MNC04-795F-153 and MNC04-795F-159 were those that simultaneously had high yield, adaptability, and genotypic stability, and can be recommended and grown with greater probability of success in the evaluated environments in the Northeast region of Brazil.
Key words:Vigna unguiculata. Grain yield. Genotype × environment interaction. Mixed models.
RESUMO - O feijão-caupi é cultivado em diferentes condições edafoclimáticas da região Nordeste do Brasil. Devido à existência da interação entre genótipos e ambientes, torna-se necessário selecionar e desenvolver cultivares para essa região com alta produtividade, estabilidade e adaptabilidade. Este trabalho teve como objetivo selecionar linhagens de feijão-caupi de porte semiereto, simultaneamente, para alta produtividade, adaptabilidade e estabilidade genotípica na região Nordeste do Brasil, via procedimento REML/BLUP. Foram avaliados 20 genótipos de porte semiereto, sendo 15 linhagens e cinco cultivares, em 37 ambientes da Região Nordeste, no período de 2013 a 2015. Os experimentos foram conduzidos em condições de sequeiro, em delineamento de blocos completos casualizados, com quatro repetições. A adaptabilidade e estabilidade genotípica foram avaliadas via procedimento REML/BLUP. A variância ambiental foi o maior componente da variância fenotípica e a interação genótipos x ambientes foi do tipo complexa, com a produtividade de grãos variando de 277 kg ha-1 (Serra Talhada-PE, 2015)
a 2.845 kg ha-1(São Raimundo das Mangabeiras-MA, 2013) e média geral de 1.342 kg ha-1. De acordo com as estimativas de
média harmônica de desempenho relativo de valores genotípicos (MHPRVG), as linhagens 795F-153 e MNC04-795F-159 reúnem simultaneamente alta produtividade, estabilidade e adaptabilidade genotípica, podendo ser indicadas com maior probabilidade de sucesso para o cultivo nos ambientes de avaliação da região Nordeste do Brasil.
Palavras-chave:Vigna unguiculata. Produtividade de grãos. Interação genótipos x ambientes. Modelos Mistos.
DOI: 10.5935/1806-6690.20170102 *Autor para corresponência
Recebido para publicação em 31/08/2016; aprovado em 08/03/2017
1Pesquisa desenvolvida pela Embrapa (Empresa Brasileira de Pesquisa Agropecuária), Programa de Melhoramento de Feijão-caupi da Embrapa
Meio-Norte, região Nordeste, Teresina-PI, Brasil
2Embrapa Meio-Norte, Teresina-PI, Brasil, [email protected], [email protected], [email protected] 3Embrapa Tabuleiros Costeiros, Aracajú-SE, Brasil, [email protected]
4Instituto Agronômico de Pernambuco, Recife-PE, Brasil, [email protected]
5Empresa de Pesquisa Agropecuária do Rio Grande do Norte, Natal-RN, Brazil, [email protected]
6Empresa Estadual de Pesquisa Agropecuária da Paraíba, João Pessoa-PB, Brasil, [email protected] 7Universidade Federal do Ceará, Fortaleza-CE, Brasil, [email protected]
INTRODUCTION
Cowpea (Vigna unguiculata (L.) Walp.) is an
important legume in the Northeast region of Brazil, and a source of energy and protein. The cultivation of this species generates employment and income for the population of this region. Cowpea is the second most consumed type of bean in Brazil, and its cultivation is concentrated in the North, Northeast, and Center-West regions. There are no official statistics on cowpea production in Brazil; thus, based on the estimates of CONAB (2017), the Northeast region presented in 2016 an area of 1,029,600 ha with a production of 196,100 Mg. This represents 82.56% and 54.00% of the area and production of this legume in Brazil, respectively. The largest national producers are the states of Mato Grosso, Ceará, and Maranhão. The total area for cowpea production in Brazil is 1,247,100 ha and its production is 362,500 Mg, which represents 14.43% of all beans produced in Brazil.
Considering that cowpea is cultivated in a wide range of environments in Brazil, but the occurrence of genotype × environment interaction (G×E) may hinder the selection of superior genotypes and the recommendation
of cultivars (CARVALHO et al., 2016; OLIVEIRA;
FONTES; ROCHA, 2015; ROCHAet al., 2012). Thus, in
the final stages of a breeding program, elite lines are tested in various environments; this allows an investigation of the magnitude of the G×E, adaptability, and yield stability, which subsidize the recommendation of cultivars for broad or specific conditions of adaptation.
In the last 60 years, several methodologies to study the adaptability and stability of genotypes in multiple environments were developed to help the breeder to select the most stable and suitable genotypes for crops in
different environments (CARVALHO et al., 2016). The
most commonly methodologies used in cowpea are the
AMMI (BARROSet al., 2013; DDAMULIRAet al., 2015;
SANTOS et al., 2015), GGE Biplot (OKORONKWO;
NWOFIA, 2016; OLAYIWOLA; SOREMI; OKELEYE,
2015; SANTOS et al., 2016), Bayesian approache
(BARROSOet al., 2016; TEODORO et al., 2015), and
artificial neural networks (TEODOROet al., 2015).
The REML/BLUP procedure has been one of the most used techniques in studies on adaptability and genotypic stability; it is based on mixed models. This procedure estimates the components of variance by the Restricted Maximum Likelihood (REML) and the prediction of genetic values by the Best Linear Unbiased
Prediction (BLUP) (CARIASet al., 2014). It was originally
recommended for studies on quantitative genetics and selection of perennial plants (RESENDE, 2007a,b); however, it has also been used in annual species such as
rice (BORGESet al., 2010), common bean (CHIORATO
et al., 2008; PEREIRAet al., 2016), soybean (TESSELE
et al., 2016), and wheat (SILVAet al., 2011).
Adaptability and stability studies in cowpea using the REML/BLUP procedure have increased (SANTOS
et al., 2016; TORRESet al., 2015, 2016). This is because it allows simultaneous selection for yield, adaptability, and stability in the context of mixed models through the use of the Harmonic Mean of Relative Performance of Genetic Values (HMRPGV) method, proposed by Resende (2004).
The objective of this work was to select semi-erect cowpea lines simultaneously for high yield, adaptability, and genotypic stability in the Northeast region of Brazil by the REML/BLUP procedure.
MATERIAL AND METHODS
Twenty cowpea genotypes of semi-erect plant were evaluated—15 lines and five cultivars—from the Embrapa Meio-Norte Cowpea Breeding Program (Table 1). These lines are part of the value-of-cultivation and use (VCU) trials, which are required for registering new cultivars by the National Register of Cultivars (RNC) of the Ministry of Agriculture, Livestock, and Food Supply (MAPA). These genotypes were selected in intermediate trials, which precede the VCU trials.
The genotypes were evaluated for grain yield
(kg ha-1) in 22 locations in the Northeast region of
Brazil (Table 2) under rainfed conditions from 2013 to 2015. Some VCU trials were conducted in 1, 2, or 3 crop seasons totaling 37 environments. Each environment was represented by the location initial letters and year of the crop season: APOD13, ARAP13, BARR13, CARI13, FREI13, ITAP13, MATA13, REDE13, SRMA13, UMBA13, URUC13, ARAR14, CARI14, BARR14, FEIR14, FREI14, GOIA14, IPAN14, ITAP14, MATA14, SERT14, SUMBA14, ARAR15, AROE15, CAMP15, FEIR15, FREI15, IPAN15, GOIA15, LAGS15, NSDO15, PACA15, SAOJ15, SERT15, SRMA15, UMBA15, and URUC15.
Table 1 - Semi-erect cowpea genotypes evaluated in the Northeast region of Brazil, from 2013 to 2015, their genealogy and commercial subclass (CS)
GC = Genotype code; ML = Mulato; FR = Fradinho; SV = Sempre-verde; BL = Branco Liso; BR = Branco rugoso
GC Genotype Genealogy CS
G21 MNC04-762F-3 TE96-282-22G × (TE96-282-22G × Vita 7) BL
G22 MNC04-762F-9 TE96-282-22G × (TE96-282-22G × Vita 7) BL
G23 MNC04-769F-30 CE-315 × TE97-304G-12 ML
G24 MNC04-769F-48 CE-315 × TE97-304G-12 ML
G25 MNC04-792F-146 MNC00-553D-8-1-2-3 × TV×5058-09C ML
G26 MNC04-769F-62 CE-315 × TE97-304G-12 ML
G27 MNC04-782F-104 (TE97-309G-24 × TE96-406-2E-28-2) × TE97-309G-24 SV
G28 MNC04-792F-143 MNC00-553D-8-1-2-3 × TV×5058-09C ML
G29 MNC04-792F-144 MNC00-553D-8-1-2-3 × TV×5058-09C SV
G30 MNC04-792F-148 MNC00-553D-8-1-2-3 × TV×5058-09C ML
G31 MNC04-795F-153 MNC99-518G-2 × IT92KD-279-3 ML
G32 MNC04-795F-154 MNC99-518G-2 × IT92KD-279-3 SV
G33 MNC04-795F-155 MNC99-518G-2 × IT92KD-279-3 ML
G34 MNC04-795F-159 MNC99-518G-2 × IT92KD-279-3 ML
G35 MNC04-795F-168 MNC99-518G-2 × IT92KD-279-3 BR
G36 BRS Guariba IT85F-2687 × TE87-98-8G BL
G37 BRS Tumucumaque TE96-282-22G × IT87D-611-3 BL
G38 BRS Novaera TE97-404-1F × TE97-404-3F BR
G39 BRS Itaim MNC01-625E-10-1-2-5 × MNC99-544D-101-2-2 FR
G40 BRS Cauamé TE93-210-13F × TE96-282-22G BL
Individual analysis of variance for environments and joint analysis of variance for all environments were performed. The joint analysis of variance considered the effect of genotypes as fixed, and the effect of environments as random. The statistical model used followed the equation:
Yijk = µ + gi + ej + geij+ βk(J) + εijk (1)
where in: Yijk is the observed value of the genotype
i in the environmentj and blockk; µ is the overall mean
of the trait;gi is the effect of the genotypei;ej is the effect
of the environmentj;ge
ij is the effect of the interaction of
the genotype i with the environmentj; βk(J) is the effect
of the block k within the environment j; and εijk is the
experimental error associated with the plotijk.
The mixed models approach through Restricted Maximum Likelihood (REML) and Best Linear Unbiased Prediction (BLUP) multivariate, i.e., REML/BLUP procedure, (RESENDE, 2007b) was used for the analysis of adaptability and stability. This procedure is a method for ordering the genotype simultaneously regarding their
genetic values (yield) and stability; it represents the BLUP procedure under the harmonic mean of the data. The lower the standard deviation of the genotypic behavior in the environments, the greater the harmonic mean of genotypic values (HMGV) in the environments. Thus, selection by the highest HMGV implies both selection for yield and stability (RESENDE, 2007b).
In the context of the mixed models, a simple and efficient measure is the relative performance of genotypic values (RPGV) in the environments, i.e., the adaptability of genetic values. The quantity RPGV*OM refers to the relative performance genotypic value multiplied by the overall mean of all environments, providing the average genotypic value, capitalizing the adaptability (RESENDE, 2007b).
provides the mean genotypic value penalized by instability and capitalized by adaptability.
The following statistical model was used for the randomized block designs with one observation per plot and several environments:
Y = Xb + Zg + Wga + e (2)
where in:y, b, g, ga, ande are the data vectors of
fixed effects (mean of blocks through environments), of genotypic effects of the genotype (random), of effects of the genotype × environment interaction (G×E) (random),
and of random errors, respectively; X, Z andW are the
incidence matrices forb,g, andga, respectively.
The Harmonic Mean of Genotypic Values (HMGV) was used for the evaluation of stability; the RPGV was used for the simultaneous evaluation of yield and adaptability; and the HMRPGV was used for the simultaneous evaluation
of yield, adaptability, and stability. These evaluation were carried out using the following expressions:
(3)
(4)
(5)
where in:nis the number of evaluation environments of
the genotypei;Vgijis the genotypic value of the genotype
i in the environment j, expressed as a proportion of the
average of this environment.
The HMRPGV method (RESENDE, 2007a) has the advantages of providing adaptability and genotypic— rather than phenotypic—stability; allowing the managing
Location Altitude Latitude Longitude Biome Ecosystem Climate
Arapiraca-AL 264 m 09º45’07’’ S 36º39’39’’ W Caatinga Agreste TSu
Feira de Santana-BA 234 m 12º16’01’’ S 38º58’01’’ W Caatinga Sertão BSh
Barreira-CE 123 m 04º17’13’’ S 38º38’34’’ W Caatinga Sertão BSh
Itapipoca-CE 109 m 03º29’38’’ S 39º34’44’’ W Caatinga Sertão TAs
Redenção-CE 88 m 04º13’30’’ S 38º43’46’’ W Caatinga Sertão TQSu
Pacajus-CE 60 m 04º10’22’’ S 38º27’39’’ W Caatinga Sertão BSh
Mata Roma-MA 73 m 03º37’30’’ S 43º06’39’’ W Cerrado Meio-Norte TAw
São R. Mangabeiras-MA 225 m 07º01’19’’ S 45º26’51’’ W Cerrado Meio-Norte TAw
Lagoa Seca-PB 634 m 07º10’15’’ S 35º51’14’’ W Caatinga Agreste TAs
Aroeiras-PB 363 m 07º32’42’’ S 35º42’28’’ W Caatinga Agreste TAs
Araripina-PE 622 m 07º34’33’’ S 40º29’52’’ W Caatinga Sertão BSh
Serra Talhada-PE 444 m 07º59’09’’ S 38º17’45’’ W Caatinga Sertão BSh
Goiana-PE 444 m 07º33’39’’ S 35º00’10’’ W Caatinga Zona da Mata TAs
São João do Piauí-PI 222 m 08º21’28’’ S 42º14’49’’ W Caatinga Sertão BSh
Campo Grande do Piauí-PI 443 m 07º07’55’’ S 41º02’09’’ W Caatinga Sertão BSh
Uruçuí-PI 167 m 07º13’44’’ S 44º33’41’’ W Cerrado Meio-Norte TAw
Apodi-RN 67 m 05º39’50’’ S 37º47’56’’ W Caatinga Sertão BSh
Ipanguaçu-RN 16 m 05º29’52’’ S 36º51’18’’ W Caatinga Sertão BSh
Carira-SE 351 m 10º21’29’’ S 37º42’03’’ W Caatinga Sertão BSh
Frei Paulo-SE 272 m 10º32’56’’ S 37º32’02’’ W Caatinga Sertão BSh
Umbaúba-SE 130 m 11º22’58’’ S 37º39’28’’ W Caatinga Sertão TAs
Nossa S. das Dores-SE 204 m 10º29’30’’ S 37º11’36’’ W Caatinga Sertão TAs
Table 2 - Altitude, geographic coordinate, biome, ecosystem, and climate of the locations where the value-of-cultivation and use trials of semi-erect cowpea were conducted in the Northeast region of Brazil, from 2013 to 2015
of heterogeneity of variances; and providing already-penalized genetic values of instability. Moreover, this method can be applied to any number of environments, eliminate noises of the genotype × environment interaction (G×E), while considering the heritability of these effects; and allows the computation of genetic gain with selection by the three attributes simultaneously.
The analysis of variance was performed using the SAS software (SAS INSTITUTE, 2002). The analyses of adaptability and genotypic stability were performed by the model 54 of the Selegen-Reml/Blup software (RESENDE, 2007b).
RESULTS AND DISCUSSION
The joint analysis of variance for grain yield is presented in Table 3. Although all genotypes have shown a high inbreeding level and some parentage (Table 1) and underwent several selection cycles, they differed
significantly (p<0.0001), denoting the existence of
selectable variability.
Barros et al. (2013), Santos et al. (2015) and
Barrosoet al. (2016), evaluated 20 cowpea genotypes for
yield adaptability and stability in the Mid-North region and in Mato Grosso do Sul, Brazil, respectively, and also found differences between homozygous genotypes.
The environments also differed for grain yield
(p<0.0001), denoting that their eco-physiographic
differences (Table 2) combined with the climatic variations affected this trait.
Barroso et al. (2016) evaluated the grain yield
of 20 cowpea genotypes in six environments of Mato Grosso do Sul and also found differences between the testing environments; affirming that the edaphoclimatic factors had the greatest effect on the adaptability and
stability of the genotypes. Ddamulira et al. (2015),
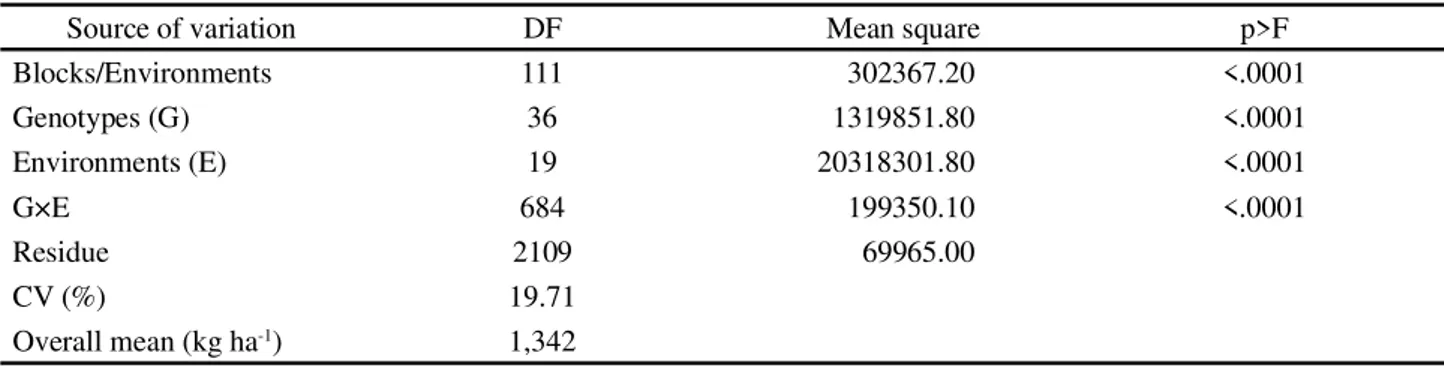
Table 3 - Joint analysis of variance for grain yield of 20 semi-erect cowpea genotypes evaluated in 37 environments of the Northeast region of Brazil, from 2013 to 2015
who evaluated the yield adaptability and stability of 25 cowpea genotypes in three environments in Uganda, and Oliveira, Fontes and Rocha (2015), who evaluated cowpea genotypes in several environments in the state of Amazonas in Brazil, also found different grain yields depending on the environment.
The overall mean grain yield was 1,342 kg ha-1.
This mean is well above the national (369 kg ha-1) and
world (461.30 kg ha-1) mean for yield of cowpea (FREIRE
FILHO, 2011) and is also above the means obtained in other studies on cowpea genotypes in Brazil (BARROS
et al., 2013; BARROSO et al., 2016; SANTOS et al.,
2015; TORRESet al., 2015, 2016). This shows the great
potential of this line group in regard to grain yield and the possibility of selecting lines with higher means than the commercial cultivars.
The environment São Raimundo das Mangabeiras-MA 2013 (SRMangabeiras-MA13) was the most favorable for grain yield
(2,485 kgha-1), while Serra Talhada-PE 2015 (SERT15)
was the least favorable (277 kg ha-1) (Figure 1).
The G×E for grain yield was highly significant
(p<0.0001) (Table 3); it showed the different behavior of
the genotypes depending on the testing environments. This lead to difficulties in the selection of superior genotypes
and recommending cultivars (CARVALHO et al., 2016;
ROCHA et al., 2012), since the cultivars adapted to
a particular condition may not perform well in other environmental conditions (OLAYIWOLA, SOREMI;
OKELEYE, 2015; TEODOROet al., 2015).
According to estimates of components of variance (REML), the environmental variance contributed most to the phenotypic variance (Table 4). It represented 64% of this variance, followed by the G×E (30%), and genotypic (6%) variances.
The preponderance of the environmental variance in relation to the other components of the phenotypic variance are in agreement with the results found in the
Source of variation DF Mean square p>F
Blocks/Environments 111 302367.20 <.0001
Genotypes (G) 36 1319851.80 <.0001
Environments (E) 19 20318301.80 <.0001
G×E 684 199350.10 <.0001
Residue 2109 69965.00
CV (%) 19.71
Figure 1 - Behavior of the grain yield of 37 testing environments obtained from evaluation of 20 semi-erect cowpea genotypes in the Northeast region of Brazil from 2013 to 2015
analysis of variance (Table 3), the information of the test environments (Table 2), and the environment means (Figure 1), which showed marked contrasts between testing environments for grain yield.
Studies evaluating genotypes of common bean
(CHIORATO et al., 2008; PEREIRA et al., 2016) and
cowpea (TORRES et al., 2015; OLIVEIRA; FONTES;
ROCHA, 2015) in multi-environments also found a higher proportion of environmental variance than genotypic and environmental variances for grain yield.
The low genotype variance found in the group of genotypes evaluated (Table 4) was expected considering that some lines showed relation to each other (Table
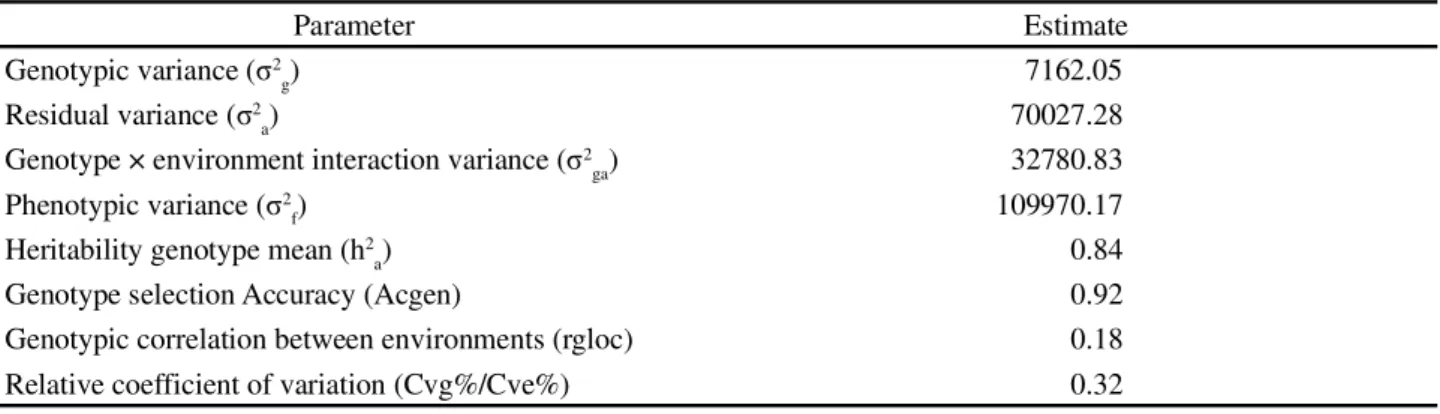
Table 4 - Estimates of components of variance (individual REML) and genetic parameters obtained from the evaluation of 20 semi-erect cowpea genotypes in 37 environments in the Northeast region of Brazil, from 2013 to 2015
1) and all are highly inbred, i.e., they have already undergone several selection cycles for high grain yield.
Torres et al. (2015, 2016) evaluated the grain yield of
20 cowpea genotypes in multi-environments of Mato Grosso do Sul and also found lower estimates for the genotypic variance than environmental and G×E variances.
The trait yield is controlled by several genes and, therefore, is heavily affected by the environment. In spite of the great effect of the environmental factors, denoted by the relative coefficient of variation (0.32), the heritability at an average genotypic level among the various environments was high (0.84) since the environmental
Parameter Estimate
Genotypic variance (σ2
g) 7162.05
Residual variance (σ2
a) 70027.28
Genotype × environment interaction variance (σ2
ga) 32780.83
Phenotypic variance (σ2
f) 109970.17
Heritability genotype mean (h2
a) 0.84
Genotype selection Accuracy (Acgen) 0.92
Genotypic correlation between environments (rgloc) 0.18
effects were minimized. This allowed a high accuracy (0.92) in the selection of lines based on the average of the environments (Table 4). The heritability obtained in the present study was higher than those estimated by
Torreset al. (2015, 2016), who evaluated the grain yield
of 20 cowpea genotypes in multi-environment of Mato Grosso do Sul and found estimates of 0.68 and 0.54.
According to Chiorato et al. (2008), heritability
at average level is determined based on the number of replicates and evaluated plants. In the case of the present study, the size of the evaluation area in the experimental unit may have contributed positively to minimize the environmental effects, since the genotypes were represented by 80 plants in the evaluation area of the plot.
The G×E variance was the second most important (30%) (Table 4), which resulted from the low genotypic correlation between environments (0.18). These results showed the existence of G×E of complex-type, and that
the best lines in one environment will not necessarily be the best in others (RESENDE, 2007a). This represents a certain difficulty in the selection of genotypes with wider adaptation, which justifies considering in the selection of the lines, their stabilities and adaptabilities.
Barros et al. (2013) evaluated the grain yield
of 20 cowpea genotypes in the Mid-North region of Brazil and also found the G×E as the second factor affecting the phenotypic variance. On the other hand,
Torres et al. (2016) observed similar percentages for
the G×E and environmental variances.
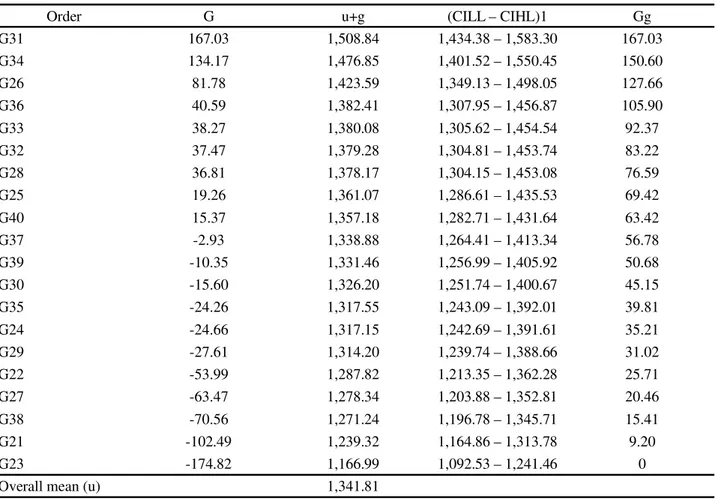
According to the mean component estimates (BLUP) and the confidence intervals associated with
genotypic values (u+g), the lines G31
(MNC04-795F-153), G34 (MNC04-795F-159), and G26 (MNC04-769F-62) were superior than most of the genotypes evaluated and presented the highest genetic gains compared to the overall mean, with 12.45%; 11.22%; and 9.51%, respectively (Table 5). These gains were lower than those
Table 5 - Estimates of mean components (individual BLUP) of the effects (g) and predicted genotypic values (u+g) free from interaction with environments, confidence interval lower limit (CILL), confidence interval higher limit (CIHL) and genetic gain (Gg) of 20 semi-erect cowpea genotypes evaluated in 37 environments of the Northeast region of Brazil, from 2013 to 2015
1Confidence interval associated to the genotypic value estimates, at 95% probability
Order G u+g (CILL – CIHL)1 Gg
G31 167.03 1,508.84 1,434.38 – 1,583.30 167.03
G34 134.17 1,476.85 1,401.52 – 1,550.45 150.60
G26 81.78 1,423.59 1,349.13 – 1,498.05 127.66
G36 40.59 1,382.41 1,307.95 – 1,456.87 105.90
G33 38.27 1,380.08 1,305.62 – 1,454.54 92.37
G32 37.47 1,379.28 1,304.81 – 1,453.74 83.22
G28 36.81 1,378.17 1,304.15 – 1,453.08 76.59
G25 19.26 1,361.07 1,286.61 – 1,435.53 69.42
G40 15.37 1,357.18 1,282.71 – 1,431.64 63.42
G37 -2.93 1,338.88 1,264.41 – 1,413.34 56.78
G39 -10.35 1,331.46 1,256.99 – 1,405.92 50.68
G30 -15.60 1,326.20 1,251.74 – 1,400.67 45.15
G35 -24.26 1,317.55 1,243.09 – 1,392.01 39.81
G24 -24.66 1,317.15 1,242.69 – 1,391.61 35.21
G29 -27.61 1,314.20 1,239.74 – 1,388.66 31.02
G22 -53.99 1,287.82 1,213.35 – 1,362.28 25.71
G27 -63.47 1,278.34 1,203.88 – 1,352.81 20.46
G38 -70.56 1,271.24 1,196.78 – 1,345.71 15.41
G21 -102.49 1,239.32 1,164.86 – 1,313.78 9.20
G23 -174.82 1,166.99 1,092.53 – 1,241.46 0
observed by Torreset al. (2016), who evaluated the grain yield of 20 cowpea genotypes in four environments of Mato Grosso do Sul and found gain estimates for the two best genotypes of 18.79% and 18.04%.
The genetic gain depends on the differential of the selection and heritability of the trait. Although the heritability of grain yield was high, a factor that may
have led to lower gains than those observed by Torreset
al. (2015, 2016) was the differences between the overall
mean and the means of the superior genotypes, which in the present study were small, relatively to the selection differentials founded by the authors above.
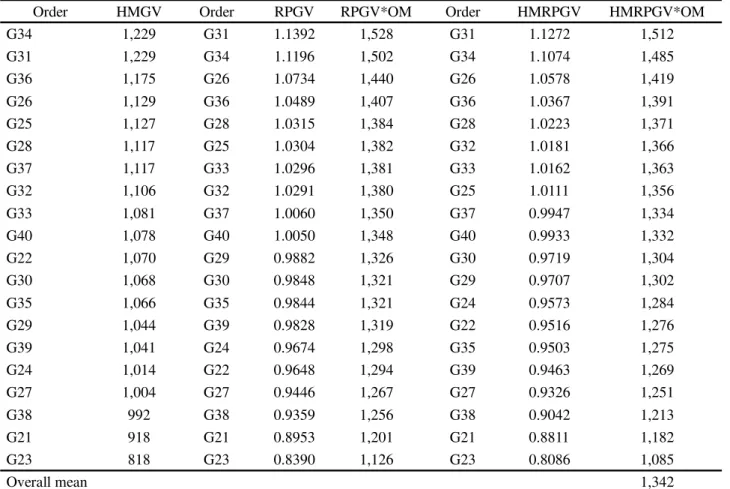
The results of stability (HMGV), adaptability (RPGV), and simultaneous stability and adaptability (HMRPGV) of the genotypes evaluated are presented in Table 6. The five best genotypes, based on the criteria HMGV, RPGV, and HMRPGV were not necessarily the best based on the criterion of the mean genotypic value (Table 5). The coincidence was 80% among the five best
Table 6 - Genetic value stability (HMGV), genetic values adaptability (RPGV), simultaneous genetic value adaptability and stability (HMRPGV), genotypic value capitalizing the adaptability (RPGV*OM) and genotypic value penalized by instability and capitalized by adaptability (HMRPGV*OM) of 20 semi-erect cowpea genotypes evaluated in 37 environments of Northeast region of Brazil, from 2013 to 2015
genotypes and there was an inversion of order among the coincident ones between HMGV and RPGV. According to Resende (2007a), the use of these attributes or selection criteria can provide further refinement in selection.
Similar results were obtained by Torres et al.
(2016), who evaluated the yield of 20 cowpea genotypes in the state of Mato Grosso do Sul, and also observed the same percentage of coincidence between the ordering provided by HMGV and RPGV.
The three best lines (G31 - MNC04-795F-153, G34 - MNC04-795F-159 and G26 - MNC04-769F-62) by the criterion HMRPGV*OM, had grain yield of
1,512 kg ha-1, 1,485 kg ha-1and 1,419 kg ha-1 (Table
6), i.e., an average superiority of 13%, 11%, and 10%, respectively, over the overall mean of the 37 environments. According to Resende (2007a), these values are obtained through a process that already penalizes the lines for the instability in the environments and capitalizes the capacity of response (adaptability) to
Order HMGV Order RPGV RPGV*OM Order HMRPGV HMRPGV*OM
G34 1,229 G31 1.1392 1,528 G31 1.1272 1,512
G31 1,229 G34 1.1196 1,502 G34 1.1074 1,485
G36 1,175 G26 1.0734 1,440 G26 1.0578 1,419
G26 1,129 G36 1.0489 1,407 G36 1.0367 1,391
G25 1,127 G28 1.0315 1,384 G28 1.0223 1,371
G28 1,117 G25 1.0304 1,382 G32 1.0181 1,366
G37 1,117 G33 1.0296 1,381 G33 1.0162 1,363
G32 1,106 G32 1.0291 1,380 G25 1.0111 1,356
G33 1,081 G37 1.0060 1,350 G37 0.9947 1,334
G40 1,078 G40 1.0050 1,348 G40 0.9933 1,332
G22 1,070 G29 0.9882 1,326 G30 0.9719 1,304
G30 1,068 G30 0.9848 1,321 G29 0.9707 1,302
G35 1,066 G35 0.9844 1,321 G24 0.9573 1,284
G29 1,044 G39 0.9828 1,319 G22 0.9516 1,276
G39 1,041 G24 0.9674 1,298 G35 0.9503 1,275
G24 1,014 G22 0.9648 1,294 G39 0.9463 1,269
G27 1,004 G27 0.9446 1,267 G27 0.9326 1,251
G38 992 G38 0.9359 1,256 G38 0.9042 1,213
G21 918 G21 0.8953 1,201 G21 0.8811 1,182
G23 818 G23 0.8390 1,126 G23 0.8086 1,085
the improvement of the environment. These properties are intrinsic to the HMRPGV method.
The values of RPGV and HMRPGV (Table 6) indicate the average superiority of the genotype in relation to the average of a given environment. Thus, the line MNC04-795F-153 (G31) responds on average 1.1272 times the mean of any environment in which it is grown.
The four best genotypes in genotypic value (Table 5) were also the best in HMRPGV. Similar results
were found by Torres et al. (2016), who evaluated the
yield adaptability and stability of 20 cowpea genotypes in several environments in the State of Mato Grosso do Sul. Based on these authors, this is an indication that the genotypes evaluated in the present work had high adaptive synergism in the 37 environments tested and good predictability, i.e., maintenance of yield in the environments.
In general, the lines MNC04-795F-159 (G31) and MNC04-795F-153 (G34) were superior for yield, adaptability, and stability, and can be recommended for the evaluated environments in the Northeast region of Brazil, with a lower risk of losses in grain yield due to unpredictable
environmental factors. According to Torres et al. (2016),
genotypes that simultaneously have these three attributes can be used as selection criteria in breeding programs.
The lines G31 and G34 are sisters, presenting the same genealogy, and belong to the same commercial subclass—mulatto (Table 1). Their grain yield is also similar (Table 6). Thus, regarding the releasing of cultivars, the line G31 should be chosen, since this line better combines the attributes of yield, adaptability, and stability.
CONCLUSIONS
1. The line MNC04-795F-159 presents greater predictability of grain yield in the environmental conditions evaluated in the Northeast region of Brazil;
2. The line MNC04-795F-153 combines high yield, adaptability and genotypic stability, and can be recommended and grown with greater probability of success in the edaphoclimatic conditions evaluated in the Northeast region of Brazil.
ACKNOWLEDGEMENTS
The authors thank the partners of the genetic breeding network for cowpea in the Northeast Region for the structural support and personnel in conducting
the tests; and Dr. Marcos Deon Vilela de Resende, for the assistance in the statistical analysis of adaptability and stability via REML/BLUP procedure.
REFERENCES
BARROS, M. A.et al. Adaptabilidade e estabilidade produtiva de feijão-caupi de porte semiprostrado.Pesquisa Agropecuária
Brasileira, v. 48, n. 4, p. 403-410, 2013.
BARROSO, L. M. A. et al. Bayesian approach increases accuracy when selecting cowpea genotypes with high adaptability and phenotypic stability. Genetics and
Molecular Research, v. 15, n. 1, p. 1-11, 2016.
BORGES, V. et al. Desempenho genotípico de linhagens de arroz de terras altas utilizando metodologia de modelos mistos.
Bragantia, v. 69, n. 4, p. 833-842, 2010.
CARIAS, C. M. O. M. et al. Produtividade de grãos de cafeeiro conilon de diferentes grupos de maturação pelo procedimento REML/BLUP.Semina: Ciências Agrárias, v. 35, n. 2, p. 707-718, 2014.
CARVALHO, L. C. B.et al. Evolution of methodology for the study of adaptability and stability in cultivated species.African
Journal of Agricultural Research, v. 11, n. 12, p. 990-1000, 2016.
CHIORATO, A. F. et al. Prediction of genotypic values and estimate of genetic parameters in common bean. Brazilian
Archives of Biology and Technology, v. 51, n. 3, p. 465-472, 2008.
COMPANHIA NACIONAL DE ABASTECIMENTO.
Acompanhamento da safra brasileira de grãos. v. 4, safra 2016/17, n. 10. Brasília: CONAB, 2017. p. 95. Disponível em: <http://www. conab.gov.br/OlalaCMS/uploads/arquivos/17_07_12_11_17_01_ boletim_graos_julho_2017.pdf >. 2017. Acesso em: 14 jul. 2017. DDAMULIRA, G. et al. Grain yield and protein content of Brazilian cowpea genotypes under diverse Ugandan environments. American Journal of Plant Science, v. 6, p. 2074-2084, 2015.
FREIRE FILHO, F. R. (Ed.).Feijão-caupi no Brasil: produção, melhoramento genético, avanços e desafios. Teresina: Embrapa Meio-Norte, 2011. 84 p.
OKORONKWO, C. M.; NWOFIA, G. E. Yield stability and inter relationships between seed yield and associated traits of 25 cowpea (Vigna unguiculata[L.] Walp.) genotypes.African
Journal of Agricultural Science and Technology, v. 4, n. 5, p. 728-734, 2016.
OLAYIWOLA, M. O.; SOREMI, P. A. S.; OKELEYE, K. A. Evaluation of some cowpea (Vigna unguiculata L. [Walp.]) genotypes for stability of performance over 4 years. Current
Research in Agricultural Sciences, v. 2, n. 1, p. 22- 30, 2015.
estabilidade produtiva no Estado do Amazonas. Revista de
Ciência Agrárias, v. 58, n. 3, p. 292-300, 2015.
PEREIRA, T. C. V. et al. Reflexos da interação genótipo x ambiente sobre o melhoramento genético de feijão. Ciência
Rural, v. 46, n. 3, p. 411-417, 2016.
RESENDE, M. D. V. Matemática e estatística na análise
de experimentos e no melhoramento genético. Colombo: Embrapa Florestas, 2007a. 362 p.
RESENDE, M. D. V.Métodos estatísticos ótimos na análise
de experimentos de campo. Colombo: Embrapa Florestas, 2004. 65 p. (Embrapa Florestas. Documentos, 100).
RESENDE, M. D. V.Selegen-Reml/Blup: sistema estatístico e seleção genética computadorizada via modelos lineares mistos. Colombo: Embrapa Florestas, 2007b. 359 p. ROCHA, M. M. et al. Adaptabilidade e estabilidade de genótipos de feijão-caupi quanto à produção de grãos frescos, em Teresina-PI.Revista Científica Rural, v. 14, n. 1, p. 40-55, 2012.
SANTOS, A. et al. Adaptabilidade e estabilidade de genótipos de feijão-caupi ereto via REML/BLUP e GGE Biplot.Bragantia, v. 75, n. 3, p. 55-62, 2016.
SANTOS, A. et al. Adaptability and stability of cowpea genotypes to Brazil Midwest.African Journal of Agricultural
Research, v. 10, n. 41, p. 3901-3908, 2015.
SAS INSTITUTE INC.SAS/STAT user’s guide. Version 8.1. Cary, 2002. v. 1, 890 p.
SILVA, R. R. et al. Adaptabilidade e estabilidade de cultivares de trigo em diferentes épocas de semeadura, no Paraná. Pesquisa Agropecuária Brasileira, v. 46, n. 11, p. 1439-1447, 2011.
TEODORO, P. E.et al. Perspectiva bayesiana na seleção de genótipos de feijão-caupi em ensaios de valor de cultivo e uso. Pesquisa
Agropecuária Brasileira, v. 50, n. 10, p. 878-885, 2015.
TESELLE, A. et al. Adaptability and stability of soybean cultivars under different times of sowing in Southern Brazil.
Journal of Plant Sciences, v. 4, n. 2, p. 17-22, 2016.
TORRES, F. E. et al. Interação genótipos x ambientes em genótipos de feijão-caupi semiprostrados via modelos mistos. Bragantia, v. 74, n. 3, p. 15-20, 2015.