Acta Scientiarum
http://periodicos.uem.br/ojs/acta ISSN on-line: 1807-8621
Doi: 10.4025/actasciagron.v40i1.35272 GENETICS AND PLANT BREEDING
Adaptability and stability assessment of bean cultivars of the
carioca commercial group by a Bayesian approach
Milena Pierotti Euzebio1, Inês Cristina de Batista Fonseca1, Nelson da Silva Fonseca Júnior2, Moysés Nascimento3, Willian Giordani1 and Leandro Simões Azeredo Gonçalves1*
1
Departmento deAgronomia, Universidade Estadual de Londrina, Rodovia Celso Garcia Cid, km 380, 86051-900, Londrina, Paraná, Brazil. 2
Instituto Agronômico do Paraná, Londrina, Paraná, Brazil. 3Departamento de Estatística, Universidade Federal de Viçosa, Viçosa, Minas Gerais, Brazil. *Author for correspondence. E-mail: [email protected]
ABSTRACT. To develop new bean commercial cultivars, a series of experiments called Value for
Cultivation and Use (VCU) assays are necessary. Bayesian analysis using information on prior VCU trials is an alternative to obtain greater precision during genotype selection. The objective of the present work was to select, under a Bayesian perspective, genotypes of the carioca bean from the state of Paraná that combine high adaptability and phenotypic stability, using information from previous VCU assays. This study used data from six experiments conducted in a randomized block design, in which the grain yield of 18 genotypes was assayed. To represent weakly informative prior distributions, the study used probability distributions with high variance; to represent informative prior distributions, it adopted the meta-analysis concept used in prior VCU assays (2007/2008, 2008/2009, 2009/2010, 2010/2011, 2011/2012, 2012/2013, and 2013/2014). Bayesian inference provided greater precision in selecting carioca bean genotypes with high adaptability and phenotypical stability through the Eberhart and Russell method. The Bayes factor indicated that the use of a priori information gives more accurate results for genotype selection. According to the study, most genotypes are widely adaptable based on informative priors, except for the Bola Cheia cultivar, which has specific adaptability to favorable environments.
Keywords:Phaseolus vulgaris L.; value for cultivation and use; Eberhart and Russell; Bayes factor; informative prior.
Abordagem Bayesiana para a avaliação da adaptabilidade e estabilidade de cultivares de
feijão do grupo comercial carioca
RESUMO. Para lançamento de novas cultivares comercias de feijão é necessário a realização de uma série
de experimentos denominados de ensaios de cultivo e uso (VCU). Sendo assim, a análise bayesiana utilizando informações a priori de ensaios de VCU anteriores pode ser considerada uma alternativa visando obtenção de uma maior acurácia na seleção de genótipos. Sendo assim, o presente trabalho teve como objetivos selecionar, sob perspectiva bayesiana, genótipos de feijão do tipo carioca que reúnam alta adaptabilidade e estabilidade fenotípicas, no Estado do Paraná, utilizando como informações a priori ensaios anteriores de VCU. Foram utilizados dados de seis experimentos, conduzidos em delineamento de blocos ao acaso, em que a produtividade de grãos de 18 genótipos foi avaliada. Para representar as distribuições a priori pouco informativas, utilizaram-se distribuições de probabilidade com grande variância, e para representar distribuições a priori informativas, adotou-se o conceito de meta-análises utilizando os ensaios de VCU anteriores (2007/2008, 2008/2009, 2009/2010, 2010/2011, 2011/2012, 2012/2013 e 2013/2014). A inferência bayesiana proporcionou maior acurácia na seleção dos genótipos de feijão carioca com alta adaptabilidade e estabilidade fenotípica por meio da metodologia de Eberhart e Russell. O fator Bayes indicou que o uso de informações a priori fornece resultados mais acurados na seleção dos genótipos. Com base nas prioris informativas, a maioria dos genótipos foi classificada de adaptabilidade ampla, exceto a cultivar Bola Cheia que foi classificada de adaptabilidade específica a ambientes favoráveis.
Palavras-chave:Phaseolus vulgaris L.; valor de cultivo e uso; Eberhart e Russell; fator de Bayes; priori informativa.
Introduction
The bean (Phaseolus vulgaris L.) is considered one of
the most important legumes in the world, being one of the main sources of nutrients in several countries in Latin America and Western Africa and representing 65% of all consumed protein, 32% of energy and one
National Company of Food and Supply (CONAB), Brazilian production in the 2015/2016 season was 3.33
million tons, with an average yield of 1,103 kg ha-1
(CONAB, 2016).
Grains of the carioca commercial type represent the largest consumer market share in Brazil (Barili et al., 2016). Developed in Brazil in the 70s, this bean originated from mutations and crosses of other varieties of brown beans such as jalo and mulatinho. As the carioca is the most preferred bean among Brazilians, several breeding programs (Instituto Agronômico de Campinas – IAC, Instituto Agronômico do Paraná – IAPAR, Empresa Brasileira de Pesquisa Agropecuária – Embrapa, and Universities, for instance) are being developed to release new and more productive, stable and adapted cultivars.
A series of experiments called Value for Cultivation and Use (VCU) assays are necessary before the release of new bean commercial cultivars. These experiments are performed in representative locations in a specific region and during periods that represent the region’s climate variation to which a cultivar will be exposed (Barili et al., 2015a). Quantification of the genotype x environment (GE) interaction and adaptability and stability analyses have become of great relevance for cultivar recommendation (Carbonell et al., 2004; Torga et al., 2013; Corrêa et al., 2015).
Several methods have been proposed for the analysis of adaptability and stability, being based on variance analysis, nonparametric, regression multivariate and mixed models. However, these methods do not make use of a priori information to estimate parameters (Nascimento et al., 2011). One alternative to include previous information in these studies is to use Bayesian inference. Such an approach is based on probability principles and prior information through specific probability distributions that show more or less information about the parameters. For instance, some adaptability and stability methods use this approach in factor analyses (Campos & Gianola,
2007), AMMI (additive main effects and multiplicative
interaction) (Crossa et al., 2011), Eberhart and Russell (1966) (Nascimento et al., 2011) and GGE Biplot (Oliveira, Silva, Nuvunga, Silva, & Balestre, 2016).
The analysis of Eberhart and Russell (1966), using the Bayesian approach, showed greater accuracy for genotype selection when compared to traditional methods such as those used for alfalfa (Nascimento et al., 2011), cowpea (Barroso et al., 2016; Teodoro et al., 2015), popcorn (Couto et al., 2015) and the common bean (Corrêa et al., 2015).
The objective of this study was to select, under a Bayesian perspective, genotypes of the carioca bean from the state of Paraná that bring together high
adaptability and phenotypic stability, using prior VCU assay information.
Material and methods
Six Value for Cultivation and Use (VCU) trials on 18 carioca bean genotypes in 2014 and 2015 in the counties of Guarapuava, Pato Branco, and Ponta Grossa in the state of Paraná, Brazil (Table 1), using a randomized block experimental design with four replications were used for this study. The plots included four 5.0 m lines with 0.5 m between lines and 0.20 m between plants. Grain yield was assessed in each plot from the two central lines, with grain
humidity corrected to 13% and estimated in kg ha-1.
The following 18 genotypes were assessed: ANFC-9, Bola Cheia, BRS Estilo, BRS Madrepérola, BRS Requinte, Capitão, Carioca, IAC Alvorada, IAPAR 81, IPR Campos Gerais, IPR Tangará, Polaco 28, Polaco 29, Polaco 30, Polaco 33, Pérola, SEL MD 1092/221, and SEL MD 1092/299.
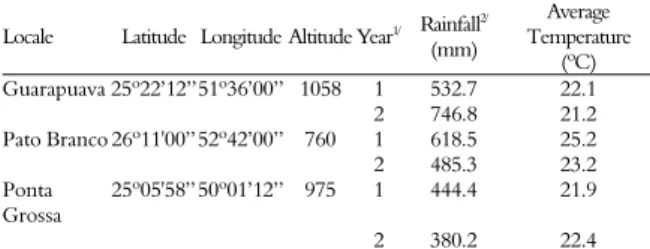
Table 1. Geographical coordinates, altitude, rainfall and air temperature at the three evaluated environments in Parana State, Brazil.
Locale Latitude Longitude Altitude Year1/ Rainfall2/
(mm)
Average Temperature
(ºC)
Guarapuava 25º22’12’’51º36’00’’ 1058 1 532.7 22.1
2 746.8 21.2
Pato Branco 26º11'00’’ 52º42’00’’ 760 1 618.5 25.2
2 485.3 23.2
Ponta Grossa
25º05'58’’ 50º01’12’’ 975 1 444.4 21.9
2 380.2 22.4
1/1: Agricultural year 2014 (rainy season) and 2: Agricultural year 2015 (drought season); 2/Accumulated rainfall during the experiment.
Data from each environment were analyzed by an analysis of variance, and the residual variance homogeneity was analyzed by the Hartley test. The statistical model adopted by the joint analysis was:
= + / ( )+ + + + ,
where: Yijk is the mean grain yield; is the general
constant; R/Ek(j)is the effect of the k1,2,3,4 replication on
the j=1,2,…,6 environment; Gi is the fixed effect of the
i=1,2,…,18 genotype; Ej is the effect of the j=1,2,…,6
environment distributed normally and independently
(NID); GEij is the effect of the i=1,2,…,18 genotype on the
j=1,2,…,6 environment; and εijk is the NID experimental
error (0, σ2). After employing the Bayesian approach,
data were submitted to adaptability and stability analyses using the Eberhart and Russell (1966) method.
The Eberhart and Russell (1966) linear regression model adopted was:
Adaptability and stability by Bayesian approach Page 3 of 8
where: Yij is the observed mean of genotype i in
environment j; β0i is the linear coefficient related to
the ith genotype; β
li is the regression coefficient of
genotype i; Ij is the environmental index j; and Ψij
represents the random errors that are compounded by the regression deviation of genotype i in environment j and by the mean error associated with the mean. The environmental index was estimated
according to the equation Ij = Ȳj - Ȳm, with ∑ =
0, where: Ȳm is the overall mean; Ȳj is the
environmental mean of j; and n is the number of environments.
According to Eberhart and Russell (1966), genotype adaptability is measured using the
parameter βli, while the stability of behavior is
evaluated using the variance of the regression
deviations (σ2di) and the determination coefficient
(R2). When σ2
di is significant (p < 0.05) and R2 is
higher than 80%, R2 indicates an acceptable
predictability. Using this frequentist approach, the
hypotheses of interest are: Ho: βli = 1versusH1: βli≠
1 and H0: σ2di = 0 versus H1: σ2di > 0, which are
assessed using t and F statistics, respectively.
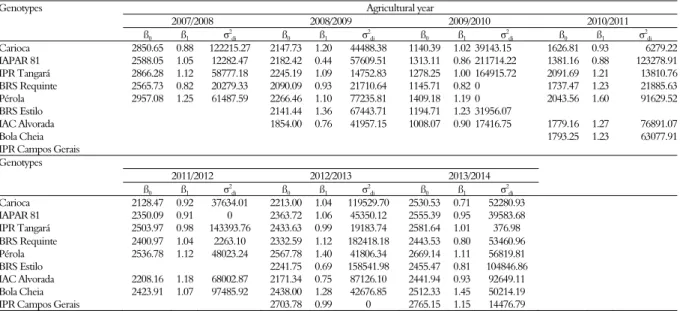
For the Bayesian analysis, only the genotypes assessed by at least one of the prior VCU assays were considered (2007/2008, 2008/2009, 2009/2010, 2010/2011, 2011/2012, 2012/2013, and 2013/2014) (Table 2).
With the Bayesian approach, we considered the following statistical model developed by
Nascimento et al. (2011): = + + Ψ and
by assuming that each observation has a
distribution ~ ( + ; ), the likelihood
function for each i genotype, according the Bayesian approach, is given by:
, , ; = 1
2
exp −21 − + =
( ) exp {− ∑ [ − + ]}, ∀ .
To estimate the adaptability and stability parameters, it is necessary to attribute a priori
distributions for the parameters. For β0i + βliand σ2di,
the following distributions were considered: β0i∼N(µ0i,
σ2
0i), βli∼N(µ0i, σ 2
li), and σ
2
di∼Gamalnv(α,βi); the latter being a reversed range with mean and variance
similar to and ( ) ( ), respectively.
By assuming independence of these distribution parameters, the joint a priori distribution for each genotype is given by:
( , , ) = 1
2
exp − 1
2 [( , ) ] ×
exp − , ×[ (
)]
exp − exp [− ( , ) ] ×
exp [− ( , ) ] × −
.
Table 2. Estimations of mean (ß0), adaptability (ß1) and stability (σ2di) obtained following the Eberhart and Russell (1966) method,
in the agricultural years 2007/2008, 2008/2009, 2009/2010, 2010/2011, 2011/2012, 2012/2013, and 2013/2014.
Genotypes Agricultural year
2007/2008 2008/2009 2009/2010 2010/2011
ß0 ß1 σ
2
di ß0 ß1 σ 2
di ß0 ß1 σ
2
di ß0 ß1 σ 2
di
Carioca 2850.65 0.88 122215.27 2147.73 1.20 44488.38 1140.39 1.02 39143.15 1626.81 0.93 6279.22
IAPAR 81 2588.05 1.05 12282.47 2182.42 0.44 57609.51 1313.11 0.86 211714.22 1381.16 0.88 123278.91
IPR Tangará 2866.28 1.12 58777.18 2245.19 1.09 14752.83 1278.25 1.00 164915.72 2091.69 1.21 13810.76
BRS Requinte 2565.73 0.82 20279.33 2090.09 0.93 21710.64 1145.71 0.82 0 1737.47 1.23 21885.63
Pérola 2957.08 1.25 61487.59 2266.46 1.10 77235.81 1409.18 1.19 0 2043.56 1.60 91629.52
BRS Estilo 2141.44 1.36 67443.71 1194.71 1.23 31956.07
IAC Alvorada 1854.00 0.76 41957.15 1008.07 0.90 17416.75 1779.16 1.27 76891.07
Bola Cheia 1793.25 1.23 63077.91
IPR Campos Gerais Genotypes
2011/2012 2012/2013 2013/2014
ß0 ß1 σ2di ß0 ß1 σ2di ß0 ß1 σ2di
Carioca 2128.47 0.92 37634.01 2213.00 1.04 119529.70 2530.53 0.71 52280.93
IAPAR 81 2350.09 0.91 0 2363.72 1.06 45350.12 2555.39 0.95 39583.68
IPR Tangará 2503.97 0.98 143393.76 2433.63 0.99 19183.74 2581.64 1.01 376.98
BRS Requinte 2400.97 1.04 2263.10 2332.59 1.12 182418.18 2443.53 0.80 53460.96
Pérola 2536.78 1.12 48023.24 2567.78 1.40 41806.34 2669.14 1.11 56819.81
BRS Estilo 2241.75 0.69 158541.98 2455.47 0.81 104846.86
IAC Alvorada 2208.16 1.18 68002.87 2171.34 0.75 87126.10 2441.94 0.93 92649.11
Bola Cheia 2423.91 1.07 97485.92 2438.00 1.28 42676.85 2512.33 1.45 50214.19
IPR Campos Gerais 2703.78 0.99 0 2765.15 1.15 14476.79
To make some inferences about the parameters of interest, it is necessary to obtain their a posteriori marginal distributions. Denoting the parameter vector
for each genotype i by θpi = (β1i , β2i , σ2i), in which p
= 1,2,3, the a posteriori marginal distribution for
parameter θpi was obtained by the following integral:
= , which is the integral
relative to all parameters in the vector except the pth
component.
In most cases, these integrals are complex and do not represent exact solutions. To work around this problem, another methodology is used. A sample of the conjoint posteriori distribution was obtained using Markov chains and the Monte Carlo method, which gave the marginal distributions moments of interest (Casella & George, 1992). In the present work, the methodology was implemented in the R program, and the conjoint distribution sample was obtained through the MCMC regress function of the MCMC pack. To evaluate the influence of a priori information in estimating the adaptability and stability parameters, two different models were used.
In the first model (M1), we considered informative prior distributions with information originating from the application of the meta-analysis technique, characterized by the utilization of prior VCU information. Thus, the Bayesian analysis considered all genotypes assessed by the experiments presented here (Table 2). Information was included in the analyses through values assumed for the parameters of the a priori distributions called hyper-parameters.
These values were given by the mean and sample variation composed of the parameter estimates from previous VCU assays, resulting in the following distributions:
~ = ̅ , = ̅
,
~ = ̅ , = ̅ ,
~ ( , ),
where: ̅ and ̅ , are the estimated means for β0i
and β1i, respectively; where ̅ and ̅
are the mean value variances for ̅ and ̅ ,
respectively; and where αi and βi are values for the
system resolution
=
( ) =( ) ( ), which was:
= 2 x ( )
= 2 x + 1
In the second model (M2), minimally informative a priori distributions were used instead, representing probability distributions with large variances. The following distributions were adopted:
~ ( = 0, = 1,000,000), ~ ( = 0,
= 1,000,000), and ~ ( =
0.0001; = 5,000).
A comparison between M1 and M2, i.e., between informative prior and uninformative distributions (weakly informative priors) was carried out by the Bayes factor (Kass & Raftery, 1995). The Bayes factor was calculated using the BayesFactor function of the MCMC pack. According to Jeffreys (1961), the Bayes factor can be interpreted as follows: FBij <
1 is evidence in favor of model j; 1 ≤ FBij < 3
indicates moderate evidence in favor of model i; 3 ≤
FBij < 10 is substantial evidence in favor of model i;
10 ≤ FBij < 30 is strong evidence in favor of model
i; 30 ≤ FBij < 100 is very strong evidence in favor of
model i; and FBij ≥ 100 is decisive evidence in favor
of model i.
Regarding the stability parameter σ2di, its
marginal distribution samples were obtained
indirectly, as this parameter is a function of σ2i. As
values for σ2i are indirectly obtained at each
interaction, the values for σ2di are given by the
following expression: = − ( ), in which
MSR is the mean square of the residual obtained in the variance analysis, and r is the number of repetitions in the experiment.
The hypotheses of interest were tested by construction credibility ranges for the parameters, and the intervals were obtained directly from the marginal a posteriori distribution of the parameters.
Thus, the credibility interval (CI) for θi with a
probability of covering δ, is given by:
(
∗ = ( : : )| ) =
and
(
∞
Adaptability and stability by Bayesian approach Page 5 of 8
where: θ* and θ
*
represent, respectively, the superior and inferior limits of the credibility interval. Since the Gibbs sampler is an iterative algorithm, it is necessary to check for convergence. In this study, convergence was assessed by applying the Heidelberger and Welch (1983), Geweke (1992), and Raftery and Lewis (1992) criteria, which were implemented in the Bayesian Output Analysis (BOA) package of the R program.
The Bayesian adaptability and stability analysis considered 110,000 iterations in the Gibbs sampler algorithm for each parameter of the adopted regression model, with a burn-in of 10.000 iterations. To obtain a non-correlated sample, the study considered the space between sampled points from two iterations (thinning), which resulted in a final sample size of 50,000. Samples represent each parameter’s a posteriori marginal distribution samples used to make an inference for each parameter.
Results and discussion
The pooled analysis of variance showed
significant differences (p ≤ 0.01) by the F test for
all sources of variation (genotypes - G, environment – E and interaction GE), indicating the existence of variability among the genotypes and among the analyzed environments, and different behavior of cultivars in variable environments (Table 3). The evaluation of this interaction in breeding is of great importance due to the possibility of one genotype being optimal for one environment and not for another, thus requiring an adaptability and stability analysis. The coefficient of variation (CV%) was 15.52, which is considered to be a good confidence level according to the criterion proposed by Oliveira, Muniz, Andrade, and Reis (2009).
Table 3. Main square, average and coefficient of variation of grain yield evaluated in six environments and 18 carioca bean genotypes in the agricultural year 2014/2015.
Source DF Main square
Blocks/environment 18 736631
Genotype (G) 17 3191782**
Environment (E) 5 14734236**
G x E 85 550287**
Residuals 306 186433
Average - 2782.14
CVe (%) - 15.52
MSr +
/MSr -
- 3.16
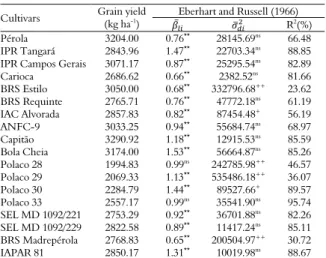
According to the traditional Eberhart and Russell (1966) analysis, the most stable genotypes were Pérola, IPR Tangará, IPR Campos Gerais,
Carioca, BRS Requinte, ANFC-9, Capitão, Bola Cheia, Polaco 33, SEL MD 1092/221, SEL MD 1092/229, and IAPAR 81 (Table 4). However, only the genotypes IPR Tangará, IPR Campos Gerais, Capitão, Bola Cheia, SEL MD 1092/229 and IAPAR 81 showed yields above the general
mean (2782.14 kg ha-1) with a determination
coefficient (R2) greater than 80%.
Genotypes IPR Tangará, Capitão, Bola Cheia, and IAPAR 81 showed significant deviations
( ≠ 1) higher than 1; therefore, these genotypes have specific adaptability to favorable environments, with an average yield of 2,843.96,
3,290.92, 3,174.00, and 2,850.17 kg ha-1,
respectively (Table 4). Genotypes IPR Campos Gerais and SEL MD 1092/229 also showed
significant deviations (β≠1); however, these were
lower than 1. The genotypes IPR Campos Gerais and SEL MD 1092/229 are adapted to unfavorable environments, showing an average yield of
3,071.17 and 2,822.58 kg ha-1, respectively.
Table 4. Adaptability and stability parameters estimated by the Eberhart and Russell (1966) method in the agricultural year 2014/2015.
Cultivars Grain yield
(kg ha-1)
Eberhart and Russell (1966)
̅ R2
(%)
Pérola 3204.00 0.76** 28145.69ns 66.48
IPR Tangará 2843.96 1.47** 22703.34ns 88.85
IPR Campos Gerais 3071.17 0.87**
25295.54ns
82.89
Carioca 2686.62 0.66** 2382.52ns 81.66
BRS Estilo 3050.00 0.68** 332796.68++ 23.62
BRS Requinte 2765.71 0.76**
47772.18ns
61.19
IAC Alvorada 2857.83 0.82** 87454.48+ 56.19
ANFC-9 3033.25 0.94**
55684.74ns
68.97
Capitão 3290.92 1.18** 12915.53ns 85.59
Bola Cheia 3174.00 1.53** 56664.87ns 85.26
Polaco 28 1994.83 0.99ns
242785.98++
46.57
Polaco 29 2069.33 1.13** 535486.18++ 36.07
Polaco 30 2284.79 1.44**
89527.66+
89.57
Polaco 33 2557.17 0.99ns 35541.90ns 95.74
SEL MD 1092/221 2753.29 0.92** 36701.88ns 82.26
SEL MD 1092/229 2822.58 0.89**
11417.24ns
85.11
BRS Madrepérola 2768.83 0.65** 200504.97++ 30.72
IAPAR 81 2850.17 1.31**
10019.98ns
88.67
*, ** Significant difference at 5% and 1% of probability, for the t test. +, ++ Significant
difference at 5% and 1% of probability, for the F test.
Cometa, and BRSMG Talismã were considered ideotypes for presenting higher means than the general mean, wide adaptation and high behavior predictability.
By the Bayesian analysis using the convergence among the simulated chains, the Raftery and Lewis (1992) dependence factor provided values below five, and the p value for the Geweke (1992) criterion was higher than the confidence level at 95%. Therefore, both criteria indicate the convergence of the chains generated by the Gibbs sampler algorithms, confirmed by the Heidelberger and Welch (1983) criterion, which verifies whether the chain values originated from a stationary distribution.
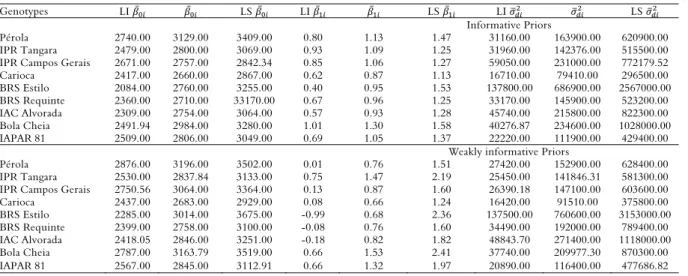
A posteriori mean calculations, together with their respective confidence intervals (CI), provided estimates for the adaptability and stability parameters (Table 5). In the M1 model (informative priors), out of the nine cultivars assessed by the Bayesian approach, only the Bola Cheia cultivar was classified as having specific
adaptability to favorable environments ( ̅ > 1),
while the other cultivars were classified as having general adaptability and stability, with adaptability parameters within the 95% confidence level range. This result contrasts with the findings from an Eberhart and Russell (1966) traditional analysis for the 2014/15 crop, except for the Bola Cheia cultivar, which was classified as having specific adaptability to favorable environments.
Cultivar analyses through M2 (weakly informative priors) showed that all cultivars presented wide adaptability, which was consistent
with the findings of Nascimento et al. (2011), Corrêa et al. (2015), Couto et al. (2015), and Teodoro et al. (2015). Corrêa et al. (2015) assessed the adaptability and stability of 13 carioca bean genotypes through the Bayesian approach in the analysis of Eberhart and Russell (1966), and found that when using weakly informative priors, genotypes became adaptable to favorable, unfavorable and wide environments. However, when assessed by weakly informative priors, all genotypes showed wide adaptability, indicating that not using prior information may attribute adaptability and stability to genotypes in several environments. Data from this work show that there was only one alteration in the classification of the Bola Cheia cultivar when compared to the M1 and M2 analyses.
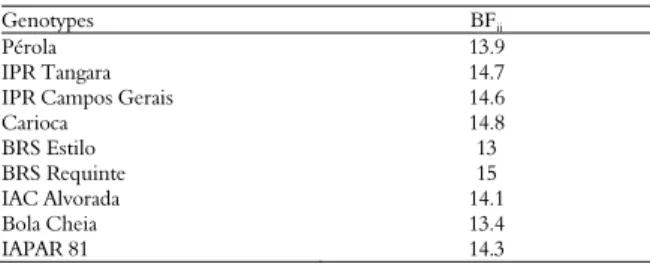
All genotypes showed values higher than 10 according to the Bayes factor (BF) analysis, indicating that the use of informative priors provides more accurate results (Table 6). These findings are also in agreement with those found by Nascimento et al. (2011), Corrêa et al. (2015), Couto et al. (2015), and Teodoro et al. (2015). However, the prior use of seven VCU analyses (Table 2) did not increase the precision of the analysis. Côrrea et al. (2015), using only one previous study as an informative prior, found values of 41.10 to 63.10, indicating strong evidence of the model’s efficacy. Thus, new studies with other types of informative prior approaches are necessary to check the model’s quality adjustments.
Table 5. A posteriori estimations of mean ( ̅ ) and credible intervals (95%) of the adaptability ( ̅ ) and stability ( ) parameters, considering informative and weakly informative priors for the carioca bean genotypes.
Genotypes LI ̅ ̅ LS ̅ LI ̅ ̅ LS ̅ LI LS
Informative Priors
Pérola 2740.00 3129.00 3409.00 0.80 1.13 1.47 31160.00 163900.00 620900.00
IPR Tangara 2479.00 2800.00 3069.00 0.93 1.09 1.25 31960.00 142376.00 515500.00
IPR Campos Gerais 2671.00 2757.00 2842.34 0.85 1.06 1.27 59050.00 231000.00 772179.52
Carioca 2417.00 2660.00 2867.00 0.62 0.87 1.13 16710.00 79410.00 296500.00
BRS Estilo 2084.00 2760.00 3255.00 0.40 0.95 1.53 137800.00 686900.00 2567000.00
BRS Requinte 2360.00 2710.00 33170.00 0.67 0.96 1.25 33170.00 145900.00 523200.00
IAC Alvorada 2309.00 2754.00 3064.00 0.57 0.93 1.28 45740.00 215800.00 822300.00
Bola Cheia 2491.94 2984.00 3280.00 1.01 1.30 1.58 40276.87 234600.00 1028000.00
IAPAR 81 2509.00 2806.00 3049.00 0.69 1.05 1.37 22220.00 111900.00 429400.00
Weakly informative Priors
Pérola 2876.00 3196.00 3502.00 0.01 0.76 1.51 27420.00 152900.00 628400.00
IPR Tangara 2530.00 2837.84 3133.00 0.75 1.47 2.19 25450.00 141846.31 581300.00
IPR Campos Gerais 2750.56 3064.00 3364.00 0.13 0.87 1.60 26390.18 147100.00 603600.00
Carioca 2437.00 2683.00 2929.00 0.08 0.66 1.24 16420.00 91510.00 375800.00
BRS Estilo 2285.00 3014.00 3675.00 -0.99 0.68 2.36 137500.00 760600.00 3153000.00
BRS Requinte 2399.00 2758.00 3100.00 -0.08 0.76 1.60 34490.00 192000.00 789400.00
IAC Alvorada 2418.05 2846.00 3251.00 -0.18 0.82 1.82 48843.70 271400.00 1118000.00
Bola Cheia 2787.00 3163.79 3519.00 0.66 1.53 2.41 37740.00 209977.30 870300.00
Adaptability and stability by Bayesian approach Page 7 of 8
Table 6. Bayes factors obtained by comparing the models with informative and weakly informative priors for the carioca bean genotypes.
Genotypes BFij
Pérola 13.9
IPR Tangara 14.7
IPR Campos Gerais 14.6
Carioca 14.8
BRS Estilo 13
BRS Requinte 15
IAC Alvorada 14.1
Bola Cheia 13.4
IAPAR 81 14.3
Conclusion
The Bayesian approach together with the method of Eberhart and Russell (1966) offers higher precision than the classic approach in selecting carioca bean genotypes with high adaptability and phenotypic stability. Based on weakly informative priors, most cultivars were classified as having wide adaptability, except for Bola Cheia, which was classified as having specific adaptability to favorable environments.
References
Barili, L. D., Vale, N. M., Amaral, R. C., Carneiro, J. E. S., Silva, F. F., & Carneiro, P. C. S. (2015a). Adaptabilidade e estabilidade e a produtividade de grãos em cultivares de feijão preto recomendadas no Brasil nas últimas cinco décadas. Ciência Rural, 45(11), 1980-1986. doi: 10.1590/0103-8478cr20141383
Barili, L. D., Vale, N. M., Prado, A. L., Carneiro, J. E. S., Silva, F. F., & Nascimento, M. (2015b). Genotype-environment interaction in common bean cultivars with carioca grain cultivated in Brazil in the last 40 years. Crop Breeding and Applied Biotechnology, 15(4), 244-250. doi: a10.1590/1984-70332015v15n4a41
Barili, L. D., Vale, N. M., Moura, L. M., Paula, R. G., Silva, F. F., & Carneiro, J. E. S. (2016). Genetic progress resulting from forty-three years of breeding of the carioca common bean in Brazil. Genetics and Molecular Research,
15(3), 1-11. Doi: 10.4238/gmr.15038523
Barroso, L. M. A., Teodoro, P. E., Nascimento, M., Torres, F. E., Santos, A., Corrêa, A. M., Sagrilo, E., Corrêa, C. C. G., Silva, F. A., & Ceccon, G. (2016). Bayesian approach increases accuracy when selecting cowpea genotypes with high adaptability and phenotypic stability. Genetics and Molecular Research, 15(1), 1-11. doi: 10.4238/gmr.15017625 Campos, G., & Gianola, D. (2007). Factor analysis models for structuring covariance matrices of additive genetic effects: a Bayesian implementation. Genetics Selection Evolution,
39(5), 481-494. doi: 10.1186/1297-9686-39-5-481 Carbonell, S. A. M., Azevedo Filho, J. A., Dias, L. A. S.,
Garcia, A. A. F., & Morais, L. K. (2004). Common bean cultivars and lines interactions with environments.
Scientia Agricola, 61(2), 169-177. doi: 10.1590/S0103-90162004000200008
Casella, G., & George, E. I. (1992). Explaining the Gibbs sampler. The American Statistician, 46(3), 167-174. doi: 10.1080/00031305.1992.10475878
Companhia Nacional de Abastecimento [CONAB]. (2016). Acompanhamento de safra brasileira: grãos, quarto levantamento, janeiro 2016. Brasília, DF: Conab.
Corrêa, A. M., Teodoro, P. E., Gonçalves, M. C., Barroso, L. M. A., Nascimento, M., Santos, A., & Torres, F. E. (2015). Adaptability and phenotypic stability of common bean genotypes through Bayesian inference. Genetics and Molecular Research, 15(2), p. 1-11. doi: 10.4238/gmr.15028260
Couto, M. F., Nascimento, M., Amaral Júnior, A. T., Silva, F. F., Viana, A. P., & Vivas, M. (2015). Eberhart and Russel’s bayesian method in the selection of popcorn cultivars. Crop Science, 55(2), 571-577. doi: 10.2135/cropsci2014.07.0498
Crossa, J., Perez-Elizalde, S., Jarquin, D., Cotes, J. M., Viele, K., Liu, G., & Cornelius, P. L. (2011). Bayesian estimation of the additive main effects and multiplicative interaction model. Crop Science, 51(4), 1458-1469. doi: 10.2135/cropsci2010.06.0343
Eberhart, S. A., & Russell, W. A. (1966). Stability parameters for comparing varieties. Crop Science, 6(1), 36-40 doi: 10.2135/cropsci1966.0011183X000600010011x
Fernandes, R. C., Guerra, J. G. M., & Araújo, A. P. (2015). Desempenho de cultivares de feijoeiro-comum em sistema orgânico de produção. Pesquisa Agropecuária Brasileira, 50(9), 797-806. doi: 10.1590/S0100-204X2015000900008
Geweke, J. (1992). Evaluating the accuracy of sampling-based approaches to the calculation of posterior moments. In: J. M. Bernardo, J. O. Berger, A. P. David, & A. F. M. Smith (Ed.). Bayesian statistics (p. 625-631). New York, US: Oxford University.
Heidelberger, P., & Welch, P. D. (1983). Simulation run length control in the presence of an initial transient. Operations Research, 31(6), 1109-1144. doi: 10.1287/opre.31.6.1109 Jeffreys, H. (1961). Theory of probability. Oxford, UK:
Claredon. doi: 10.1086/286635
Kass, R. E., & Raftery, A. E. (1995). Bayes factors. Journal of the American Statistical Association, 90(430), 773-795. doi: 10.1080/01621459.1995.10476572
Nascimento, M., Silva, F. F., Sáfadi, T., Nascimento, A. C. C., Ferreira, R. P., & Cruz, C. D. (2011). Abordagem bayesiana para avaliação da adaptabilidade e estabilidade de genótipos de alfafa. Pesquisa Agropecuária Brasileira,
46(1), 26-32. doi: 10.1590/S0100-204X2011000100004 Oliveira, R. L., Muniz, J. A., Andrade, M. J. B., & Reis, R. L.
(2009). Precisão experimental em ensaios com a cultura do feijão. Ciência e Agrotecnologia, 33(1), 113-119. doi: 10.1590/S1413-70542009000100016
Oliveira, L. A., Silva, C. P., Nuvunga, J. J., Silva, A. Q., & Balestre M. (2016). Bayesian GGE biplot models applied to maize multi-environments trials. Genetics and Molecular Research, 15(2), 1-21. doi: 10.4238/gmr.15028612. Petry, N., Boy, E., Wirth, J. P., & Hurrell, R. F. (2015). The
vehicle for iron biofortification. Nutrients, 7(2), 1144-1173. doi: 10.3390/nu7021144
Raftery, A. E., & Lewis, S. W. (1992). Comment: one long run with diagnostics: implementation strategies for Markov chain Monte Carlo. Statistical Science, 7(4), 493-497. doi: 10.1214/ss/1177011143
Teodoro, P. E., Nascimento, M., Torres, F. E., Barroso, L. M. A., & Sagrilo, E. (2015). Perspectiva bayesiana na seleção de genótipos de feijão-caupi em ensaios de valor de cultivo e uso. Pesquisa Agropecuária Brasileira, 50(10), 878-885. doi: 10.1590/S0100-204X2015001000003
Torga, P. P., Melo, P. G. S., Pereira, H. S., Faria, L. C., Del Peloso, M. J., & Melo, L. C. (2013). Interactions of common beans cultivars of the black group with years, locations and sowing seasons. Euphytica, 189(2), 239-248. doi: 10.1007/s10681-012-0793-y
Received on February 7, 2017. Accepted on July 24, 2017.