Information, overconfidence and trading: Do the sources
of information matter?
Margarida Abreu
a,b,⇑, Victor Mendes
c,daISEG – Technical University of Lisbon, Rua Miguel Lupi 20, 1249-078 Lisboa, Portugal
bUECE – Research Unit on Complexity and Economics, Rua Miguel Lupi 20, 1249-078 Lisboa, Portugal cCMVM – Portuguese Securities Commission, Avenida da Liberdade 252, 1056-801 Lisboa, Portugal dCEFAGE-UE, Universidade de Évora, 7000-803 Évora, Portugal
a r t i c l e
i n f o
Article history:
Received 19 August 2011
Received in revised form 3 April 2012 Accepted 6 April 2012
Available online 18 April 2012
JEL classification:
G11 G14 D83
PsycINFO classification:
3040 3920
Keywords:
Information Overconfidence Investor behavior Trading
Sources of information
a b s t r a c t
We investigate how the strength of the positive association between frequency of trading and information acquisition is dependent on the sources of information used by investors and on investors’ overconfidence. We add to the existing literature by investigating if the positive relationship between investment in information and intensity of trading in finan-cial assets is sensitive to the sources of information used by investors, and if this influence is different for overconfident and non-overconfident investors.
Our results confirm the classical statement that the more frequently individual investors invest in information, the more they trade in financial products. They also confirm behav-ioral finance findings that overconfident investors, who show a better than average bias, trade more frequently. Our findings are novel showing that the more overconfident and non-overconfident investors invest in information the more they trade, but the trading behavior is sensitive to the sources of information used. Overconfident investors trade less frequently when they collect information via friends and family, and non-overconfident investors trade more frequently when they use specialized sources of information.
Ó2012 Elsevier B.V. All rights reserved.
1. Introduction
In rational models of the determinants of investment in financial information, the more often individual investors invest in information, the more they trade in securities. This strong and positive association between the frequency of individual investors trading and the financial information they collect has been documented in the literature (cf.Barlevy & Veronesi, 1999; Grossman & Stiglitz, 1980; Holtausen & Verrecchia, 1990; Karpoff, 1986). The rationale behind this general conclusion is that investors choose to become informed through information acquisition and the cost of acquiring information is com-pensated by taking positions in risky assets and expecting positive abnormal returns. Investors who choose to become in-formed through information acquisition (or invest more time searching for information) either receive more signals or increase the precision of the signals received and can therefore be expected to trade more frequently (Peress, 2004).
0167-4870/$ - see front matterÓ2012 Elsevier B.V. All rights reserved.
http://dx.doi.org/10.1016/j.joep.2012.04.003
⇑ Corresponding author at: ISEG – Technical University of Lisbon, Rua Miguel Lupi 20, 1249-078 Lisboa, Portugal. Tel.: +351 213925912; fax: +351 213971196.
E-mail addresses:[email protected](M. Abreu),[email protected](V. Mendes).
Contents lists available atSciVerse ScienceDirect
Journal of Economic Psychology
It has also been suggested that the quality of the information signals has an influence on investor trading behavior. News from a trustworthy source should lead to more trades (portfolio rebalancing) than news from a less reliable one (Epstein &
Schneider, 2008).Fischer and Gerhardt (2007)argue that financial advice from professionals should lead to a better
self-evaluation by investors of their own skills and, therefore, to more rational investment decisions, with a clear positive impact on trading. On the other hand,Ivkovic and Weisbenner (2007)claim that the word-of-mouth effect is a ‘‘broad phenomenon that affects financial decisions made by. . .individual investors’’ for they ‘‘may seek to reduce search costs and circumvent their lack of expertise by relying on word-of-mouth communication with those around them’’. However, those predictions have never been tested and, as far as we know, there is no direct evidence of the impact of the sources of information as the foundation of investors’ financial choices on the frequency of trading.
Two further strands of the literature enable us to relate trading activity and information. The differences of opinion lit-erature followsMiller’s (1977)argument that investors may very probably diverge in their financial forecasts. Because fore-casts are very difficult to make it is implausible to assume that all investors have identical estimates of the expected return and probability distribution of return for all securities. According to Miller, there is a high volume effect associated with investors’ divergence of opinion, especially for small-size stocks. Anything that increases investor awareness of a security will cause higher trading volume. More recently,Harris and Raviv (1993)andKandel and Pearson (1995)argue that this dis-agreement among traders (traders’ differences of opinion) is positively correlated with high levels of trading. Such disagree-ments may arise because traders have different private information or simply interpret commonly known data differently, rather than trader irrationality. Models based on differences of opinion assume rational agents with different probability functions to interpret information (Kandel & Pearson, 1995). These agents ‘‘agree to disagree’’ on the fundamental processes in the economy and update their beliefs differently even though they observe the same data. But, those models rarely help us understand the reasons why people agree to disagree.
In the behavioral finance literature researchers argue that overconfidence may also lead to higher trading volume. For
De Bondt and Thaler (1995)overconfidence is the key behavioral factor needed to understand the trading puzzle.Odean
(1998) argues that the high level of trading volume is the most important effect of overconfidence.Statman, Thorley,
and Vorkink (2006)present empirical evidence for the US market and argue that trading volume is higher after high
re-turns, as investment success increases the degree of overconfidence.Barber and Odean (2001), who claim that gender is a good proxy for overconfidence (overconfidence among men is higher than among women), find that men trade more than women.
These theoretical models predict that overconfident investors, because either they overestimate the precision of the infor-mation they have, or because they think they have above average investment skills, trade more than rational investors. The intuition behind this argument is that the accumulation of successful market investments makes investors increasingly over-confident and consequently makes them trade more. Two different facets of overconfidence may have this impact on the trade behavior of individual investors. Investors may be overconfident in the sense that they underestimate the volatility of stock returns and as a consequence trade more. This dimension of overconfidence incorporates findings of psychological studies referred to as the calibration literature (seeLichtenstein, Fischhoff, & Phillips, 1982). This idea is presented inDaniel,
Hirshleifer, and Subrahmanyam (1998)who models overconfidence as the degree of underestimation of the variance of
information signals.
Investors may also be overconfident regarding their investment skills. Due to a self-attribution bias, investors think they are above average regarding their investment skills.Taylor and Brown (1988)argue that people have unrealistically positive views of the self. This finding is consistent with the hypothesis that a higher degree of overconfidence leads to higher trading volume if we accept that high past returns are positively correlated with overconfidence. This better than average trading effect has been documented empirically byGlaser and Weber (2007)who provide evidence of a higher trading propensity by overconfident investors when they identify overconfident investors as those who think they are above average in terms of investment skills or past performance. This finding is consistent with other recent studies (seeDeaves, Lüders, & Luo, 2009
andGraham, Harvey, & Huang, 2009).
Overconfidence may also affect the impact of information on individuals’ trading behavior. In fact,Forbes and Kara (2010)
argue that individual investors’ self-confidence mediates how investment financial knowledge influences investors’ trading efficacy. On the other hand,Kirchler’s (2010)experimental results show that the persistent underperformance of weak in-formed investors is not due to overconfidence.
While models based on difference of opinion and overconfidence may seem to have distinct theoretical foundations, pre-dictions are congruous when we recognize the psychological motivations (Glaser & Weber, 2007, 2009). If investors are over-confident about their own choices and forecasts of securities valuation, this leads to a wider range of opinions. In this line of reasoning,Hales (2009)argues that people agree to disagree because they are naturally inclined to think egocentrically. This explanation stems from evidence in psychology that people naturally anchor on their own perspective and insufficiently ad-just for the perspective of others (Epley, Keysar, Van Bovenand, & Gilovich, 2004; Moore & Kim, 2003), which may leave them insensitive to adverse selection in financial transactions and to trade more aggressively (Hales, 2009). Each trader empha-sizes his private information and his estimation of future security values and de-emphaempha-sizes the information revealed in other traders’ actions. This approach has already been adopted byHong and Stein (2003)who model the differences of opin-ion as a form of overconfidence, whereby each investor (incorrectly) thinks his own private signal is more precise than the other’s. In addition,Harris and Raviv (1993)assume that each investor considers his or her model as the correct model and, consequently, other investors’ models are incorrect (or irrational).
We add to this literature by investigating how the strength of the positive association between information acquisition and frequency of trading is dependent on the level of investors’ overconfidence, measuring overconfidence as the degree to which each investor overestimates his or her investment skills. In other words, we investigate whether this better than aver-age effect drives investor behavior, and whether this behavior depends on the sources of information used by investors. We expect less overconfident investors (more rational ones) to adjust trading to all the different sources of information used. However, insofar as the quality of the information signals may have an impact on rational investor’s behavior, we expect trading to be more sensitive to the use of specialized sources of information. In contrast, we expect overconfident investors to trade more intensely than rational investors when they collect information (i.e., the impact of the information collected is stronger), but to be less sensitive to friends since they insufficiently adjust to others’ perspectives.
We start by documenting how individual investor’s frequency of investment in information is positively related with the frequency with which they trade, controlling for a set of investor characteristics and profiles. In fact, there is evidence that investors’ behavior with regard to information depends on socio-economic and psychological characteristics. Investor behav-ior may vary according to age (DaSilva & Giannikos, 2004), occupation (Christiansen, Joensenand, & Rangvid,, 2008) or the environment in which they live (Goetzmann & Kumar, 2008).Peress (2004)shows that wealthier investors value information more and poor investors trade little even with very precise information.Graham et al. (2009)found that investors who feel competent trade more often.Calvet, Campbell, and Sodini (2009)provide evidence that active rebalancing is more pro-nounced for sophisticated households. Seemingly irrational behavior diminishes substantially with investor wealth or with investor sophistication. In short, investor’s characteristics may have an impact on trading and on the acquisition of informa-tion.Verrecchia (1982)shows that risk-averse investors acquire less information. Irrational behavior diminishes substan-tially with investor trading experience (Nicolosi, Peng, & Zhu, 2004). Peress (2004) shows very risk-averse investors benefit little from information because they would invest little in stocks even if they had very precise information.
We then investigate whether the sources of information used by investors as the basis for their financial choices, com-bined with the level of overconfidence exhibited by investors, have an impact on trading behavior. In the second part of our paper we confirm our key findings with a set of robustness tests. There we test whether portfolio size and risk, the way investors transmit their orders and financial knowledge, among other characteristics, influence our estimates.
Our results confirm that the sources of information are relevant to explain trading activity, and indeed influence the rela-tionship between frequency of trading and frequency of information. The more frequently individual investors invest in information, the more they trade in financial products. Our results also confirm previous findings that overconfident inves-tors, who show a better than average bias, trade more frequently. Our finding that the strong and positive relationship be-tween investment in information and intensity of trading in financial assets is sensitive to the sources of information used by investors, and that this influence is different for overconfident and non-overconfident investors, is novel. Overconfident investors trade less frequently when they collect information via friends and family and non-overconfident investors trade more frequently when they use specialized sources of information.
The remainder of the paper is organized as follows: Section2presents data sources and characterizes the sample. Section
3presents results on the importance of the investment in financial information on the trading behavior of individual inves-tors. This section also presents the results of tests we have undertaken to compare the behavior of overconfident and non-overconfident investors, and to investigate whether the sources of information used by investors as the basis for their finan-cial choices, combined with the frequency of information, have a different impact on their trading behavior. Section4 pre-sents the results of the robustness tests. Section5concludes.
2. Data source and sample characterization
Our main data source is a survey conducted by the Portuguese Securities Market Commission (CMVM) to identify the characteristics of individual Portuguese investors.1The most recent survey was conducted in 2000, and was publicly released in May 2005 on the CMVM website.
More than fifteen thousand individuals who were responsible or co-responsible for family investment decisions were contacted between 2 October and 22 December 2000 using the direct interview technique. 1559 investors in securities were identified. All of these investors were interviewed using a structured questionnaire.2Each questionnaire included socioeco-nomic questions, questions related to the nature and type of the assets held3and investor experience, as well as questions re-lated to trading behavior (frequency of transactions, acquisition of information, etc.) and to investors’ information about markets and their agents, and sources of information used.
1 The survey identifies an investor in securities as one holding one or more of the following assets: stocks, bonds, mutual funds, participation certificates and
derivatives. Surveys nicely complement trading data and experimental data. Surveys are useful in describing the characteristics of a large population and because many questions can be asked about a given topic it is possible to dig deeper into individual motivations. However, we have to be aware that the quality of the data collected depends on subjects’ motivation, honesty, memory, and ability to respond. Investors may not be motivated to give accurate or honest answers. Also, people who choose not to participate on the survey may be different from those who respond, thus biasing the data collected.
2 However, non-investors in securities were not all interviewed: a different questionnaire was used with 1200 non-investors only. 3 Unfortunately, there are no questions related to the size of the portfolio, nor the amounts invested in each type of asset.
Our database has information for 1559 investors in securities. However, some of them did not answer all the survey ques-tions. The trading question, for example, was answered by 1150 investors. The vast majority of the respondents (85.1%) trade occasionally. Of the rest, 8.9% trade once a month, 4.8% buy or sell financial assets once a week, and 1.2% trade two or three times a week.
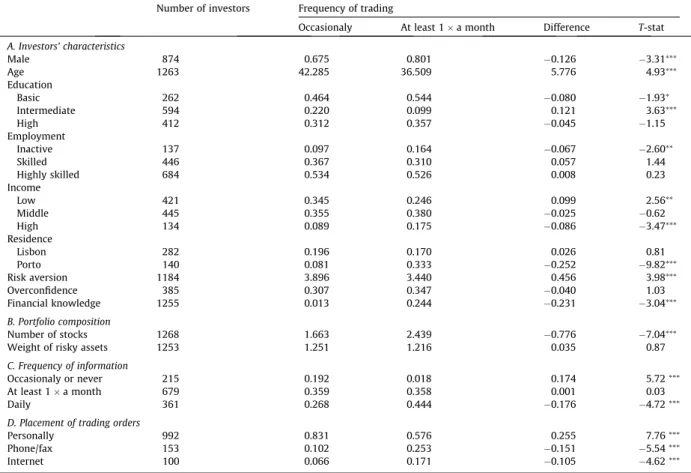
Table 1compares our sample of investors who trade occasionally with investors who buy or sell securities at least once a month. There we can see that investors who are informed on a daily basis are more likely to trade more often and that inves-tors who are occasionally or never informed are more likely to buy or sell securities infrequently (Panel C).Table 1also shows that investors who diversify more (i.e. with a higher number of different stocks in their portfolio) also trade more often (Panel B), and that investors who convey their orders by fax, telephone or the internet trade more often (Panel D). The top panel ofTable 1shows that investors who buy or sell securities more frequently are male, young, have higher in-come, live in the Porto metropolitan area4 and are investors with more financial knowledge.5 Finally, that investors who are more prone to take on risks and overconfident investors trade more frequently (although the difference is not statistically significant for the overconfident investors).6
Table 1
Sample characterization: who trades?
Number of investors Frequency of trading
Occasionaly At least 1a month Difference T-stat
A. Investors’ characteristics
Male 874 0.675 0.801 0.126 3.31⁄⁄⁄
Age 1263 42.285 36.509 5.776 4.93⁄⁄⁄
Education
Basic 262 0.464 0.544 0.080 1.93⁄
Intermediate 594 0.220 0.099 0.121 3.63⁄⁄⁄
High 412 0.312 0.357 0.045 1.15
Employment
Inactive 137 0.097 0.164 0.067 2.60⁄⁄
Skilled 446 0.367 0.310 0.057 1.44
Highly skilled 684 0.534 0.526 0.008 0.23
Income
Low 421 0.345 0.246 0.099 2.56⁄⁄
Middle 445 0.355 0.380 0.025 0.62
High 134 0.089 0.175 0.086 3.47⁄⁄⁄
Residence
Lisbon 282 0.196 0.170 0.026 0.81
Porto 140 0.081 0.333 0.252 9.82⁄⁄⁄
Risk aversion 1184 3.896 3.440 0.456 3.98⁄⁄⁄
Overconfidence 385 0.307 0.347 0.040 1.03
Financial knowledge 1255 0.013 0.244 0.231 3.04⁄⁄⁄
B. Portfolio composition
Number of stocks 1268 1.663 2.439 0.776 7.04⁄⁄⁄
Weight of risky assets 1253 1.251 1.216 0.035 0.87
C. Frequency of information
Occasionaly or never 215 0.192 0.018 0.174 5.72⁄⁄⁄
At least 1a month 679 0.359 0.358 0.001 0.03
Daily 361 0.268 0.444 0.176 4.72⁄⁄⁄
D. Placement of trading orders
Personally 992 0.831 0.576 0.255 7.76⁄⁄⁄
Phone/fax 153 0.102 0.253 0.151 5.54⁄⁄⁄
Internet 100 0.066 0.171 0.105 4.62⁄⁄⁄
Basic: indicates the investor has only up to 8 years of education. Intermediate: indicates the investor has up to 12 years of education. High: indicates the investor has a higher degree. Inactive: includes students and unemployed. Skilled: includes liberal professionals, independent workers and office clerks. Highly skilled: includes business owners, senior and middle managers and technical, scientific and artistic professions. Low income: includes investors with net annual income below€14,964. Middle income: includes investors with net annual income between€14,964 and€37,410. High income: includes investors with net annual income higher than€37,410. Other variables: see Appendix.
4Lisbon and Porto are the two largest cities in Portugal and, as noted previously, research indicates that investor characteristics, including their environment,
impact trading and information acquisition.
5Financial knowledge is the ability to make informed judgements and decisions, and is proxied by the level of information revealed by investors regarding
financial markets.
6See the Appendix for a description of the variables used in the paper. The highest correlation between each pair of variables is well below 0.5 and is noticed
among some socioeconomic characterization variables. Among the more relevant variables (experience, overconfidence, financial knowledge, information, etc.) the highest correlation is 0.37 (investment style – long and experience – more than 5 years).
3. Information acquisition and trading behavior
In this section we present the initial results on the influence of investment in financial information on the trading behav-ior of individual investors. The dependent variable in our model is the number of transactions per year, which only assumes non-negative integer values. This means that count data models are appropriate for estimation purposes. The dependent var-iable is over dispersed: the variance (242.70) exceeds the mean (5.67). Thus, we use negative binomial regressions in all our estimations.7
A quick look at the first four rows ofTable 2shows that in the two models there is a positive correlation between the investment in information and the frequency of trading. This means that the more individual investors invest in information, the more they trade in financial products. Model 1 shows that this positive correlation holds when we control for investors’ socio-economic characteristics, including gender, age, family size, marital status, place of residence, social status,8income, occupation and education. Using the results of this model, we conclude that younger investors trade more. These results are consistent with the literature, which finds that younger investors are more prone to take on risk and trade more (Barber & Odean, 2001; Dorn & Huberman, 2005). We include residence in Porto and Lisbon in the regression because these two cities are the largest in Portugal by a significant margin. Investors in Porto trade more which can be partially explained by the fact that wealthier investors tend to live in the largest cities.9We also speculate that investors located in big cities have access to more and better quality information, and as such they trade more. However, this explanation is not satisfactory because the Lisbon coefficient is not significant. The non-relevance of the gender variable is consistent with other studies (Glaser & Weber, 2007; Grinblatt & Keloharju, 2001).
In the Model [2] ofTable 2we control for otherfactors that are likely to influence investors’ trading behavior, including the trading experience and investment style (i.e. whether assets are held for shorter/longer periods of time) of the investor. In fact, one could argue that the more experienced investors are more sophisticated and thus churn their portfolios less (Dorn &
Huberman, 2005), and those investors that hold their assets for shorter periods of time are expected to trade more. We also
control for self-reported risk aversion. Risk-loving investors are more prone to take on risk and expected to trade more (Dorn
& Huberman, 2005). We conclude that experience does not have an impact on trading, but investors who hold assets for
longer periods of time trade less. Finally, risk-loving investors trade more.
The results we present thus far suggest that individual investors who invest more in information trade more often.10This finding is robust to a large set of investor characteristics, such as socio-economic variables, experience, investment style and self-reported risk aversion.
3.1. Trading, sources of information and overconfidence
Table 3presents the results of tests undertaken to investigate whether the sources of information used by investors as the basis for their financial choices, combined with the frequency of information, have an impact on trading behavior. Moreover, we investigate whether overconfidence has any impact on the trading behavior of individual investors.
It has been argued that overconfidence is a major driver of trading (Glaser & Weber, 2007; Guiso & Jappelli, 2006; Odean, 1999). Thus, it is important to test if overconfidence is driving our results on the impact of information on trading. We define overconfident investors as those who are better than average, that is, those who believe that they know more than they actu-ally do, this being measured by the difference, if positive, between self-reported and actual financial knowledge.11
All of the models are estimated using the controls in Model [2] of the previousTable 2. However, in the interest of space we omit these controls. We report only the results on our key variables (frequency of information and sources of informa-tion), and split the sample by overconfident investors. Models [3] to [10] (Table 3) report the results obtained with this methodology.
The results of Model [3] confirm that the sources of information used by investors to gather information related to the stock market have a significant impact on trading frequency. Everything else constant, financial advice from the bank and the use of specialized sources of information (the base category) are equivalent in terms of the impact on the frequency of trading because the coefficient of the ‘bank’ variable is not significant. This result suggests that, compared with the
7 In both the rational and the behavioral models more information leads to more trading (see, for example,Peress, 2004;Guiso & Jappelli, 2006). InPeress
(2004)model, the portfolio is chosen after information is collected. In the behavioral model, investors are overconfident about the quality of the information collected and trade more in response to it (i.e., ‘information acquisition triggers more trading’ –Guiso & Jappelli, 2006). However, from an empirical standpoint, the direction of causality may not be obvious. If information is acquired before the trading decision, some agents who do not trade may have invested in information but have chosen to not trade on the basis of that information. But agents may choose to get informed after they trade only to follow the performance of their investments, or to justify trade. We do not have information to empirically disentangle between these possibilities, and thus select the independent information acquisition (and sources) variables on theoretical, rather than empirical, grounds.
8 This is a close proxy for wealth. The social status variable is based on the education and occupation variables. For example, independent workers, business
owners, senior and middle managers with an intermediate or university degree are included in the highest status; unskilled workers with less than 4 years of schooling are included in the lowest status.
9 The average income in Lisbon is higher than in Porto, and these are both higher than the average for Portugal.
10Argentesi, Lutkepohl, and Motta (2006)have a slightly different perspective: ‘‘The fact that more information is collected by investors does not necessarily
imply that more trade will follow (for instance, because information may just suggest that it is optimal not to trade)’’ – p. 3.
11 For the exact quantitative definition of the variable see Appendix.
Table 2
Determinants of the trading behavior of individual investors.
[1] [2]
Frequency of information
Monthly/weekly 1.070*** 0.836***
5.03 3.81
Daily 1.215*** 0.979***
4.81 4.09
Male 0.045 0.022
0.24 0.12
Age 0.017*** 0.013**
2.66 2.05
Household size 0.187** 0.231***
2.36 2.86
Married 0.132 0.224
0.65 1.12
Lisbon 0.294 0.289
1.41 1.37
Porto 0.994*** 1.001***
4.94 4.41
Social status
Intermediate 0.219 0.204
1.16 1.09
High 0.152 0.261
0.55 1.02
Income
Middle 0.291 0.235
1.55 1.27
High 0.279 0.313
1.12 1.05
Employment
Highly skilled 0.005 0.219
0.02 0.81
Skilled 0.063 0.199
0.21 0.75
Education
High 0.211 0.431
0.71 1.57
Intermediate 0.011 0.152
0.04 0.58
Years of experience
Between 2 and 5 0.273
1.47
5 or more 0.005
0.02 Investment style
Short 0.018
0.05
Medium 0.026
0.07
Long 0.671*
1.65
Risk aversion 0.116*
1.88
N 1129 1041
LR stat. 454.6 513.6
Prob. 0.000 0.000
The dependent variable is the number of trades per year. The frequency of information/social status/income/ employment/education/experience/investment style dummy variable left out is never or occasionally/low/ low/inactive/basic/low/very short term, which includes investors that do not invest in information or get informed occasionally/with the lowest status/with net annual income below€14,964/that are students or unemployed/with up to 8 years of education/that have been investing in the securities market for less than 2 years/that hold assets for a maximum period of 1 month. See the Appendix for a complete description of the variables. Results computed using a negative binomial regression. The model includes a constant as well. Robustt-values are initalics.
*Denote significance at 10%.
**Denote significance at 5%.
***Denote significance at 1%.
word-of-mouth communication and the non-specialized media, the advice individual investors get from professionals leads them to trade more often and that the credibility of the information collected via specialized sources of information and their more in-depth analysis of the stock market may justify the more frequent trading by individual investors.
The results of Model [3] also confirm the hypothesis that investors spread information about the stock market directly to one another through social interaction (word-of-mouth communication).Hong, Kubik, and Stein (2004)posit that social interaction by individual investors may partly induce stock market participation.Hong, Kubik, and Stein (2005)find that mu-tual fund managers are more likely to trade a particular stock if other fund managers trade that same stock.Brown, Ivkovic,
Smith, and Weisbenner (2008)report evidence of causal community effects in the context of stock market participation.
Ivkovic and Weisbenner (2007)find a positive relation between a household’s stock purchases and those made by neighbors,
and these results could be attributed to word-of-mouth effects, similarities in preferences, or common reactions to news.
Feng and Seasholes (2004)do not find evidence of word-of-mouth effects among Chinese investors.Kaustia and Knupfer
(2009)find that the neighborhood return effect on individual investor’s stock market participation decision is asymmetric,
and only positive returns increase the participation in the stock market. However, no direct evidence of the word-of-mouth impact on trading by individual investors is presented in this literature. Our results provide such evidence, which can be interpreted as a sign that individuals interact in order to decrease search costs and circumvent their lack of expertise in trad-ing financial instruments. Compared with the use of specialized sources of information and with the professional advice investors get from the bank/account manager, the word-of-mouth communication leads to less trades. This result, though, does not necessarily imply that social interaction decreases trading. Our claim is that the word-of-mouth communication does have an impact on the trading frequency of individual investors. One may suspect that, insofar as the survey was con-ducted more than 6 months after the dotcom bubble burst, the advice that friends and family would provide would lead to less trades.
Model [5] (and Model [6]) is equivalent to Model [3] (and Model [4]), but without the frequency of information dummy variables, and confirms the relevance and impact of the sources of information on trading frequency. We also conclude that overconfidence has a significant impact on trading frequency. In Model [4] we see that overconfident investors trade more. The effect of the investment in information remains robust, which means that investors who invest more in information trade more often.
Guiso and Jappelli (2006)claim that ‘‘overconfident investors are less willing to rely on information provided by financial advisors, banks or brokers and [are] more likely to collect information directly.’’ (p. 19). Thus, they may collect information on the stock market directly from specialized sources. Furthermore, it could also be argued that if investors get financial ad-vice from professionals then this would lead to a better self-evaluation of their own skills and more rational investment deci-sions (Fischer et al., 2007). We use the above-mentioned source of information variable (bank) as a proxy for advice.12To test Table 3
Trading, Overconfidence and Sources of Information.
[3] [4] [5] [6] [7] [8] [9] [10]
Non-overconfident investors Overconfident investors
Frequency of information
Monthly/weekly 0.890*** 0.842*** 0.495** 1.451***
4.44 4.19 2.48 5.68
Daily 1.052*** 1.003*** 0.866*** 1.461***
4.68 4.32 3.50 5.59
Sources of information
Bank 0.084 0.118 0.086 0.126 0.332* 0.362** 0.301 0.342
0.56 0.77 0.56 0.81 1.84 1.99 1.41 1.58
Friends 0.618*** 0.627*** 0.638*** 0.651*** 0.566*** 0.656*** 0.504** 0.480*
3.49 3.60 3.48 3.62 3.15 3.45 2.08 1.91
Press 0.386** 0.396** 0.304* 0.318* 0.308* 0.236 0.306 0.240
2.39 2.43 1.84 1.91 1.71 1.29 1.49 1.14
Overconfidence 0.267* 0.345**
1.86 2.36
N 1041 1038 1046 1043 714 719 324 324
LR stat. 570.9 571.0 508.6 523.3 367.2 341.7 331.2 308.2
Prob. 0.000 0.000 0.000 0.000 0.000 0.000 0.000 0.000
The dependent variable is the number of trades per year. Results computed using a negative binomial regression. The model includes a constant and the controls in Model [2]. The frequency of information/sources of information dummy variable left out is never or occasionally/specialized sources. Robust
t-values are initalics.
*Denote significance at 10%.
**Denote significance at 5%.
***Denote significance at 1%.
12 One must notice, however, that although being a professional, a bank/account manager may have conflicts of interest. If his/her recommendation is not to
the possibility of different impacts for overconfident and non-overconfident investors by information source we split the sample into overconfident (Models [9] and [10]) and non-overconfident investors (Models [7] and [8]). We find that the two types of investors do not rely on the same sources of information, and that the impact of the investment in information is not similar as well. In fact, the positive impact of the frequency of the information variable for non-overconfident investors is stronger when they collect information on a daily basis, but overconfident investors trade more intensely when they collect information, regardless of the frequency of information acquisition. Moreover, the influence of the investment in information on the fre-quency of trading is more relevant for overconfident investors (the estimated coefficients are larger) than for non-overconfident investors.
As for the sources of information, comparing the word-of-mouth communication and the collection of information di-rectly using specialized sources (base category), the word-of-mouth communication leads overconfident investors to trade less frequently than when they use specialized sources. On the other hand, one must notice that specialized sources of infor-mation, financial advice from the bank and non-specialized sources of information have a similar impact for overconfident investors (the coefficients of ‘bank’ and ‘press’ are not significant). Non-overconfident investors also trade more when they collect information from specialized sources. However, compared with the use of specialized sources, the advice of family and friends leads to lower trading frequency, and the use of professional advice from the bank/account manager or the col-lection of information via non-specialized media leads non-overconfident investors to trade less frequently.
One may wonder why overconfident investors have different reactions to information collected from friends and from other sources. Our interpretation is the following. It was previously mentioned that the survey we use was undertaken more than 6 months into the dotcom financial crisis. After the burst of the bubble, market returns were strongly negative. Negative returns that are associated with differences of opinion lead to lower trading activity (vis-à-vis positive returns in connection with differences of opinion) because they are associated with paper losses and investors are reluctant to realize those losses (Glaser & Weber, 2009). When interacting with friends, overconfident investors learn that they are not the only ones to suffer losses, but that their pears also suffered losses. Thus, their lack of success is more general than just bad luck, and learning from others’ unsuccessful stories not only decreases overconfidence but also leads overconfident investors to trade relatively less intensely because they think that in bear markets the signals received from others have information content.
4. Robustness issues
This section presents the results of tests we have undertaken to investigate the robustness of our key findings.
4.1. Trading, portfolio size and the weight of risky assets in the portfolio
One could argue that investor trading behavior is driven by the size and riskiness of the portfolio. In fact, the value of information increases with the amount invested and the risk of the portfolio; investors acquire more information, increasing the precision of their signal and inducing more informed individuals to hold more stocks (Peress, 2004).Glaser (2003)reports a positive correlation between portfolio size and trading by online investors.
We now test these predictions. Models [11] to [14] contain the results of these tests (Table 4). Once again, these models are estimated using the controls in Model [2] ofTable 2but we omit these controls and report only the results on our key variables (frequency and sources of information) and the new controls we consider in each model. In Models [11] and [13] we control for the number of different stocks in the portfolio (as a proxy for portfolio size) and find that trading increases with portfolio size. In Models [12] and [14] we control for the relevance of risky assets13in investors’ portfolios, and find that this variable is significant for overconfident investors: they trade more when the share of risky assets in the portfolio is more relevant. Nevertheless, our main result of the positive correlation between investment in information and trading holds, and that the relevance of the information sources for overconfident and non-overconfident investors still holds true.
4.2. Trading, the ‘platform’ of trading and financial knowledge
The internet may influence investor behavior.Glaser (2003), for instance, finds that online investors trade frequently.
Bar-ber and Odean (2002)report that trading volume increases after investors go online.Choi, Laibson, and Metrick (2002)find
that trading frequency increases after the introduction of an internet-based trading channel in two corporate 401(k) retire-ment savings plans.
InTable 5we present the results of our controls. In Models [15] and [17] we control for the way investors transmit the
respective orders to the broker. The three possibilities are the internet, the telephone or fax, and going to the bank (the base category). We conclude that trading by non-overconfident investors increases when they use the internet, but overconfident investors who use the fax/telephone to give their orders trade more often. For non-overconfident investors, the positive asso-ciation between the use of internet and trading is consistent withBarber and Odean (2002). However, the result for over-confident investors is not.Gervais and Odean (2001)show that the degree of overconfidence dynamically changes over
13 Higher weight of risky assets means that these assets are more relevant in the investor’s portfolio. Securities are considered to be risky assets (vis-a-vis real
estate, bank deposits and other assets).
time, and predict that overconfidence is lower after market losses. One must remember that CMVM’s survey was imple-mented in year 2000, after the burst of the dotcom bubble. The high market losses that occurred in the last three quarters of the year may have decreased investors’ illusion of knowledge and lead them to trade less at the click of a mouse. Table 4
Trading, portfolio size and the weight of risky assets in the portfolio.
Non-overconfident investors Overconfident investors
[11] [12] [13] [14]
Frequency of information
Monthly/weekly 0.450*** 0.488** 1.211*** 0.924**
2.60 2.55 4.84 3.98
Daily 0.713*** 0.717*** 1.281*** 1.051***
3.01 3.03 4.82 4.20
Sources of information
Bank 0.318 0.306* 0.311 0.262
1.81 1.73 1.52 1.34
Friends 0.652*** 0.647*** 0.541** 0.554**
3.53 3.48 2.31 2.42
Press 0.397** 0.369** 0.391** 0.331*
2.23 2.13 1.99 1.76
Number of stocks 0.219*** 0.214*** 0.241*** 0.251***
3.60 3.54 3.74 3.98
Weight of risky assets 0.060 0.525***
0.37 3.19
N 714 708 324 319
LR stat. 398.2 395.4 353.6 353.4
Prob. 0.000 0.000 0.000 0.000
The dependent variable is the number of trades per year. Results computed using a negative binomial regression. The model includes a constant and the controls in Model [2]. The frequency of information/sources of information dummy variable left out is never or occasionally/specialized sources. Robustt -values are initalics.
*Denote significance at 10%.
**Denote significance at 5%.
***Denote significance at 1%.
Table 5
Trading, the platform of trading, and financial knowledge.
Non-overconfident Investors Overconfident investors
[15] [16] [17] [18]
Frequency of information
Monthly/weekly 0.491** 0.399** 1.302*** 1.451***
2.40 2.06 5.08 5.67
Daily 0.827*** 0.638*** 1.334*** 1.458***
3.48 2.79 5.15 5.54
Sources of information
Bank 0.313* 0.364** 0.325 0.300
1.68 2.12 1.52 2.40
Friends 0.557** 0.722*** 0.411* 0.504**
3.07 4.15 1.73 2.08
Press 0.300 0.511*** 0.010 0.309
1.66 2.97 0.05 2.49
Placement of orders
Phone/fax 0.180 1.110**
0.64 3.28
Internet 0.487* 0.589
1.79 1.46
Financial Knowledge 0.351*** 0.007
4.22 0.06
N 708 714 318 324
LR stat. 371.3 422.7 350.0 331.2
Prob. 0.000 0.000 0.000 0.000
The dependent variable is the number of trades per year. Results computed using a negative binomial regression. The model includes a constant and the controls in Model [2]. The frequency of information/sources of information/placement of orders dummy variable left out is never or occasionally, specialized sources/going to the bank. Robustt-values are initalics.
*Denote significance at 10%.
**Denote significance at 5%. ***Denote significance at 1%.
Another robustness test is performed on the level of financial knowledge exhibited by investors. Here, we test whether more financially knowledgeable investors trade differently than less knowledgeable ones. If trading is due to behavioral er-rors arising from inadequate knowledge, one would expect trading to be negatively related with financial knowledge, par-ticularly for overconfident investors. We use investor’s answers to questions related to financial markets to build up a proxy for financial knowledge. The arithmetic average of the answers to these questions is used, higher values meaning a better understanding of financial markets. We find a positive correlation between non-overconfident investors’ trading and finan-cial knowledge (Table 5– Model [16]), which confirms the positive correlation between actual knowledge and portfolio turn-over reported byDorn and Huberman (2005). Nevertheless, we conclude that the investment in information still has a strong positive effect on trading. As to the sources of information, our previous results are robust to these new controls.
4.3. Other robustness issues
Dorn and Sengmueller (2009)find that investors who enjoy gambling turn over their portfolio more rapidly than their
peers, even after controlling for overconfidence, andGrinblatt and Keloharju (2009)find that investors who are more prone to sensation seeking trade more frequently (‘‘the mere act of trading and the monitoring of a constant flow of ‘fresh stocks’ in one’s portfolio may create a more varied and novel experience than a buy and hold strategy’’ – p. 556). Thus it would be rel-evant to control for this psychological trait.
Two possibilities arise here. One may consider the fact that some investors trade but do not use any source of information (i.e., they are not informed about the stock market), and assume that those investors who trade without information do so for entertainment. As an alternative, one may consider the fact that some investors claim that the reason behind a concrete investment in a particular stock is because they love risk. Using these proxies we find (results not shown) that sensation seeking investors appear to trade more often because the coefficient of the variable, although positive in all cases, is signif-icant in some regressions. The positive correlation between information and trading, and the differences between overcon-fident and non-overconovercon-fident investors, still hold.
Three other robustness tests were performed. In the first case, and given the characteristics of the dependent variable, we estimate an orderedprobit. In the second case, we correct for selectivity. We’ve also estimated a Tobit model because the depen-dent variable is left-truncated. In all cases we estimate the base Model [2]. The results (not shown) do not significantly change.
5. Conclusion
Our results show that the more frequently individual investors invest in information, the more they trade in financial products. This finding is robust to a large set of investor characteristics, such as socioeconomic variables, experience, invest-ment style and self-reported risk aversion. This work confirms previous findings of a positive relation linking those two vari-ables. We also confirm previous findings from behavioral finance arguing that overconfident investors, who show a better than average bias, trade more frequently.
Our findings that this strong and positive relationship between investment in information and intensity of trading in financial assets is sensitive to the sources of information used by investors is novel. Moreover we show that overconfident and non-overconfident investors do not rely on the same sources of information. Overconfident investors trade less fre-quently when they rely on the advice of family and friends. Non-overconfident investors also trade less when they use the advice of family and friends. However, unlike overconfident investors, the frequency of trading also changes when non-overconfident traders get advice from the bank or account manager, or the non-specialized media.
Our analysis controls for the portfolio size and risk, the platform of trading, investor’s level of financial literacy, and other psychological traits. Despite the fact that some of these variables matter for the transaction-information relationship and change the intensity of the positive association between the frequency of information acquisition and trading, the conclu-sions put forth in the previous paragraph still hold.
Acknowledgements
The authors gratefully acknowledge the insightful comments and useful suggestions of Lucy Ackert and an anonymous ref-eree. The authors gratefully acknowledge partial financial support from UECE and CEFAGE-UE. UECE (Research Unit on Com-plexity and Economics) and CEFAGE-UE are financially supported from national funds by FCT (Fundaçãopara a Ciência e a Tecnologia), Portugal. This article is part of the Strategic Project (PEst-OE/EGE/UI0436/2011) and program FEDER/POCI2010.
Appendix A. Definition of variables constructed from survey responses
A.1. Trading
Based on the question: ‘‘How often do you buy or sell financial assets?’’ Answers were transformed into the variable ‘‘number of trades per year’’. They were alternatively coded ‘‘occasionally’’, ‘‘once a month’’, ‘‘once a week’’ and ‘‘2 or 3 times a week’’.
A.2. Frequency of information
Based on the question: ‘‘How often do you get information regarding the evolution of stock indexes and prices?’’ Answers coded as ‘‘do not get information or get information only occasionally’’ (the base category), ‘‘get informed at least once a month’’ (Monthly/weekly), or ‘‘on a daily basis’’ (Daily).Table A1reports the sample distribution of the answers.
A.3. Sources of information
Based on the question: ‘‘List the sources of information you usually resort to when you want to get information regarding the stock market’’. The following information sources were mentioned by investors: bank/account manager (Bank); friends/ family (Friends); specialized press and the stock exchange bulletin of quotations (Specialized); other written press, television and radio (Other press); none.Table A2reports the sample distribution of the answers.
A.4. Placement of orders
Based on the question: ‘‘How do you give your buy/sell orders?’’. Answers coded as ‘‘using the telephone or the fax’’ (Phone/fax), ‘‘going personally to my bank’’ (Personally) and ‘‘using the internet’’ (Internet).Table A3reports the sample dis-tribution of the answers.
A.5. Financial knowledge
We use the survey questions number 7, 11A and 13 to build up a proxy for investor’s level of financial knowledge. Ques-tion 7: ‘‘name companies (up to a maximum of 5) with shares or bonds listed’’. Responses are marked from 0 to 5 (0 means that investors fail to mention the name of any company, and 5 means that they refer to the name of five companies). Ques-tion 11: ‘‘Do you know any of the following entities: BVLP, Interbolsa, CMVM, Credit InstituQues-tions, Dealers’’. Answers are marked from 0 to 5 (0 means that investors do not know any of these entities, 5 means that they know them all). Question 13: ‘‘If you wish to file a complaint about a financial intermediary, an issuer or any other entity related with the securities markets, to whom would you address it?’’ Answers are marked with 5, if CMVM is mentioned and with 0 if any other entity (or no entity at all) is mentioned. The arithmetical average of the answers obtained to these questions is used as a proxy for
Table A1
Frequency of information acquisition.
Frequency of information No time/occasionally Monthly/weekly Daily
% of investors 17.10 53.10 28.20
% with stocks 12.80 31.81 27.00
Frequency of trading 1.06 5.46 9.24
Notes: No time/occasionally: means that investors do not get any information or get information only occasionally; Monthly/weekly: means that investors get informed at least once a month; Daily: means that investors get informed on a daily basis.
Table A2
Sources of information.
Sources of information None Bank Friends Specialized Other press
% of investors 10.0 53.0 14.9 33.2 51.7
% with stocks 7.8 47.2 13.5 30.4 46.5
% mainly with stocks in the portfolio 8.5 42.1 11.3 25.1 38.5
Notes: None: means that investors do not use any source of information; Bank: means that investors use the bank/account manager as a source of information; Friends: means that investors use friends or family as a source of information; Specialized: means that investors use specialized press and the stock exchange bulletin of quotations as a source of information; Other press: means that investors use other written press, television and radio as a source of information.
Table A3
Placement of orders.
Placement of orders Phone/fax Personally Internet
% of investors 12.30 79.70 8.00
Frequency of trading 1.02 0.39 0.97
Notes: Phone/fax: means that investors use the telephone or the fax to give the buy/sell orders; Personally: means that investors go personally to the bank to give the buy/sell orders; Internet: means that investors use the internet to give the buy/sell orders.
the investor’s financial literacy (financial knowledge), higher values meaning a better knowledge of financial markets. How-ever, given the degree of collinearity between this variable and the socio-economic variables, we orthogonalize the financial knowledge variable vis-à-vis the socio-economic ones.
A.6. Number of stocks (in the portfolio)
Based on the question: ‘‘Identify the names of the issuers of the stocks included in your portfolio’’. Number of stocks ranges from 0 to 8, meaning that the most diversified portfolio has eight different stocks. On average, each portfolio has 1.72 different stocks, but a significant number of investors (42.51%) hold only one stock.
A.7. Weight of risky assets (in the portfolio)
Based on the question: ‘‘Classify, by decreasing order of relevance in your wealth, the value invested in each type of investment – real estate, bank deposits, securities (treasury bonds, stocks, bonds, mutual funds, participation certificates and derivatives) and other assets’’. Answers were coded in the scale 4 (most important) to 1 (least important).
A.8. Investor’s experience
Based on the question: ‘‘How long have you been investing in the securities market?’’ Answers were coded: (i) less than 2 years, (ii) between 2 and 5 years; and (iii) 5 years or more.
A.9. Investment style
Investors were classified as very short-term (if they hold assets for a maximum period of 1 month), short-term (assets held from 1 month to 1 year), medium-term (assets held from 1 to 3 years) and long-term (assets held for more than 3 years). The variables VERY SHORT, SHORT, MEDIUM and LONG are binary variables, taking the value of 1 for very-short term, short-term, medium-term or long-term investors, respectively.
A.10. Overconfidence
Based on the question: ‘‘How do you rate, on a 1 (very low) to 7 (very high) scale, your own knowledge of financial assets and markets?’’ (Self-evaluation). Answers to this question were compared with the financial knowledge variable measured in the 1–7 scale as well. If the difference between self-reported and actual knowledge is positive and greater than 0.9 then overconfidence = 1.14
A.11. Risk aversion
Based on the question: ‘‘How do you consider yourself, in the 1–7 scale, regarding the investment in the stock market: very risk adverse (7), risk lover (1)’’.
A.12. Invest because love risk
Based on the question: ‘‘What are the reasons behind a concrete investment in a particular stock?’’ Equal to 1 if the an-swer is ‘‘because I love risk’’.
The socio-economic variables are the following: 1. Male (1 if male).
2. Age (investor’s age, in years, at the time of the survey). 3. Married (1 if married).
4. Household size: number of persons in the household.
5. Education. This variable is considered under three categories: High = 1, if the maximum educational level is an interme-diate or university degree. Intermeinterme-diate = 1, if the maximum educational level is the 9th or 12th grade and Basic = 1, if the maximum educational level is below the 9th grade.
6. Net annual household income. Three categories are considered: Low = 1, if net annual household income is below €14,964; Middle = 1, if equal to or above€14,964, but below€37,410; and High = 1, if net annual household income is
above€37,410.
7. Investor’s area of residence. Three geographical locations are considered: PORTO = 1, if living in the Porto metropolitan area; LISBON = 1, if living in the Lisbon metropolitan area; Other = 1, if living elsewhere.
14 The results are robust to different definitions of overconfidence including for example the difference between self-reported and actual knowledge positive
and greater than 0.4.
8. Investor’s employment. Three categories are considered: Highly Skilled = 1, if the investor is the owner/boss, a senior or middle manager, or if the investor’s profession is a technical, scientific or artistic one; Skilled = 1, if the investor is a liberal professional, an independent worker or an office clerk; and Inactive = 1, if the investor is inactive (student or unemployed).
9. Investor’s social status. We consider three categories: High = 1, if the investor has a type A status (the highest); Interme-diate = 1, if the investor has a types B or C status (that is, an intermeInterme-diate social status); Low = 1, if the investor has a type D or E status (E is the lowest).15
References
Argentesi, E., Lutkepohl, H., & Motta, M. (2006).Acquisition of information and share prices: An empirical investigation of cognitive dissonance. European University Institute Working paper no. 2006/32.
Barber, B. M., & Odean, T. (2001). Boys will be boys: Gender, overconfidence, and common stock investment.Quarterly Journal of Economics, 116(1), 261–292. Barber, B. M., & Odean, T. (2002). Online investors: Do the slow die first?Review of Financial Studies, 15, 455–487.
Barlevy, G., & Veronesi, P. (1999). Information acquisition in financial markets.Review of Economic Studies, 67, 79–90.
Brown, J. R., Ivkovic, Z., Smith, P. A., & Weisbenner, S. (2008). Neighbors matter: Causal community effects and stock market participation.Journal of Finance, 63(3), 1509–1531.
Calvet, L. E., Campbell, J., & Sodini, P. (2009). Fight or flight? Portfolio rebalancing by individual investor’’.The Quarterly Journal of Economics, 124(1), 301–348.
Choi, J. J., Laibson, D., & Metrick, A. (2002). How does the internet affect trading? Evidence from investor behavior in 401(k) plans.Journal of Financial Economics, 64, 397–421.
Christiansen, C., Joensenand, J. S., & Rangvid, J. (2008). Are economists more likely to hold stocks?Review of Finance, 12(3), 465–496.
Daniel, K., Hirshleifer, D., & Subrahmanyam, A. (1998). Investor psychology and security market under- and overreactions.Journal of Finance, 53(6), 1839–1885.
DaSilva, A., Giannikos, C. (2004). Higher risk aversion in older agents: Its asset pricing implications.Paper presented at the financial management association 2005 conference, Chicago. <http://ssrn.com/abstract=955958>.
De Bondt, W. F. M., & Thaler, R. H. (1995). Financial decision-making in markets and firms a behavioral perspective. In R. A. Jarrow, V. Maksimovic, & W. T. Ziemba (Eds.),Handbooks in operations research and management science: Finance(pp. 85–410). Amsterdam: Elsevier.
Deaves, R., Lüders, E., & Luo, G. (2009). An experimental test of the impact of overconfidence and gender on trading activity.Review of Finance, 13(3), 555–575.
Dorn, D., & Huberman, G. (2005). Talk and action: What individual investors say and what they do.Review of Finance, 9(4), 437–482. Dorn, D., & Sengmueller, P. (2009). Trading as entertainment?Management Science, 55(4), 591–603.
Epley, N., Keysar, B., Van Bovenand, L., & Gilovich, T. (2004). Perspective taking as egocentric anchoring and adjustment.Journal of Personality and Social Psychology, 87(3), 327–339.
Epstein, R., & Schneider, M. (2008). Ambiguity, information quality, and asset pricing.Journal of Finance, 63(1), 197–228. Feng, F., & Seasholes, M. (2004). Correlated trading and location.Journal of Finance, 59(5), 2117–2144.
Fischer, R., Gerhardt, R. (2007).The missing link between investors and portfolios: Introducing financial advice. <http://ssrn.com/abstract=967374>. Forbes, J., & Kara, M. (2010). Confidence mediates how investment knowledge influences investing self-efficacy.Journal of Economic Psychology, 31, 435–443. Gervais, S., & Odean, T. (2001). Learning to be overconfident.Review of Financial Studies, 14(1), 1–27.
Glaser, M. (2003). Online broker investors: Demographic information, investment strategy, portfolio positions, and trading activity. <http://ssrn.com/ abstract=975985>.
Glaser, M., & Weber, M. (2007). Overconfidence and trading volume.Geneva Risk Insurance Review, 32, 1–36. Glaser, M., & Weber, M. (2009). Which past returns affect trading volume?Journal of Financial Markets, 12, 1–31. Goetzmann, W. N., & Kumar, A. (2008). Equity portfolio diversification.Review of Finance, 12(3), 433–463.
Graham, J., Harvey, C., & Huang, H. (2009). Investor competence, trading frequency, and home bias.Management Science, 55(7), 1094–1106. Grinblatt, M., & Keloharju, M. (2001). What makes investors trade?Journal of Finance, 56(2), 589–616.
Grinblatt, M., & Keloharju, M. (2009). Sensation seeking, overconfidence, and trading activity.Journal of Finance, 64(2), 549–578. Grossman, S., & Stiglitz, J. (1980). On the impossibility of informationally efficient markets.American Economic Review, 70, 393–408.
Guiso, L., & Jappelli, T. (2006).Information acquisition and portfolio performance. Centre for Studies in Economics and Finance Working paper no. 167. Hales, J. (2009). Are investors really willing to agree to disagree? An experimental investigation of how disagreement and attention to disagreement affect
trading behavior.Organizational Behavior and Human Decision Processes, 108, 230–241.
Harris, M., & Raviv, A. (1993). Differences of opinion make a horse race.Review of Financial Studies, 6(3), 473–506.
Holtausen, R., & Verrecchia, R. (1990). The effect of informedness and consensus on price and volume behavior.Accounting Review, 65, 191–208. Hong, H., Kubik, J. D., & Stein, J. C. (2004). Social interaction and stock-market participation.Journal of Finance, 59(1), 137–163.
Hong, H., Kubik, J. D., & Stein, J. C. (2005). Thy neighbor’s portfolio: Word-of-mouth effects in the holdings and trades of money managers.Journal of Finance, 60(6), 2801–2824.
Hong, H., & Stein, J. C. (2003). Differences of opinion, short-sales constraints and market crashes.Review of Financial Studies, 16, 487–525.
Ivkovic, Z., & Weisbenner, S. (2007). Information diffusion effects in individual investors’ common stock purchases: Covet thy neighbors’ investment choices.Review of Financial Studies, 20(4), 1327–1357.
Kandel, E., & Pearson, N. D. (1995). Differential interpretation of public signals and trade in speculative markets.Journal of Political Economy, 103(4), 831–872.
Karpoff, J. (1986). A theory of trading volume.Journal of Finance, 41, 1069–1087.
Kaustia, M., & Knupfer, S. (2009).Learning from the outcomes of others: Stock market experiences of local peers and new investors’ market entry. <http:// ssrn.com/abstract=1343759>.
Kirchler, M. (2010). Partial knowledge is a dangerous thing – On the value of asymmetric fundamental information in asset markets.Journal of Economic Psychology, 31, 643–658.
Lichtenstein, S., Fischhoff, B., & Phillips, L. D. (1982). Calibration of probabilities: The state of the art to 1980. In D. Kahneman, P. Slovic, & & A. Tversky (Eds.),
Judgment under uncertainty: Heuristics and biases(pp. 306–334). Cambridge: Cambridge University Press. Miller, E. M. (1977). Risk, uncertainty, and divergence of opinion.Journal of Finance, 32, 1151–1168.
Moore, D. A., & Kim, T. G. (2003). Myopic social prediction and the solo comparison effect.Journal of Personality and Social Psychology, 85(6), 1121–1135.
15 The social status variable is based on the education and employment variables. For example, owners, senior and middle managers, independent workers,
with an intermediate or university degree are included in the highest status. Less skilled workers with less than 4 years of schooling are included in the lowest status. Therefore, status could be related to wealth but is not a perfect proxy for wealth.
Nicolosi, G., Peng, L., Zhu, N. (2004).Do individual investors learn from their trading experience?. Yale ICF Working Paper no. 03–32. Odean, T. (1998). Volume, volatility, price, and profit when all traders are above average.Journal of Finance, 53(6), 1887–1934. Odean, T. (1999). Do investors trade too much?American Economic Review, 89, 1279–1298.
Peress, J. (2004). Wealth, information acquisition, and portfolio choices.Review of Financial Studies, 17(3), 879–914.
Statman, M., Thorley, S., & Vorkink, K. (2006). Investor overconfidence and trading volume.Review of Financial Studies, 19, 1531–1565. Taylor, S., & Brown, J. (1988). Illusion and well being: A social psychology perspective on mental health.Psychological Bulletin, 103, 193–210. Verrecchia, R. (1982). Information acquisition in a noisy rational expectations economy.Econometrica, 50, 1415–1430.