Tourism and Regional Growth: A Panel Data Approach
MARGARIDA VAZ * [ [email protected] ]
JOSÉ MANSO ** [ [email protected] ]
JORGE SILVA *** [ [email protected] ]
EMÍLIA BALTAZAR **** [ [email protected] ]
TIAGO REIS ***** [ [email protected] ]
Abstract | Given the relevance of tourism to the Portuguese regional economies, the main aim of this paper is to study whether the investments made in related-tourism facilities contributed to the regional growth of all the Portuguese re-gions included in the NUTS II Norte and Alentejo, with special emphasis on the NUTS III Alto-Trás-os-Montes and Alentejo Central. These two regions have different usage patterns of the infrastructure and different levels of tourism development. A panel data approach was used to assess the contribution of several related tourism variables to the growth of GDP per capita of those regions.
Keywords | Tourism, Regional growth, Inner regions, Tourism-related facilities.
Resumo | Dada a relevância do turismo para a economia das várias regiões de Portugal, o objetivo principal deste trabalho é analisar se o turismo tem contribuído para o crescimento económico das regiões portuguesas incluídas nas NUTS II Norte e Alentejo, com especial ênfase na NUTS III Alto-Trás-os-Montes e Alentejo Central. Estas duas regiões têm diferentes padrões de uso de infraestruturas e equipamentos turísticos e diferentes níveis de desenvolvimento do turismo. Para avaliar a contribuição das diversas variáveis relacionadas com o turismo para o crescimento do PIB per-capita das regiões, recorreu-se a um modelo de dados em painel. Palavras-chave | Turismo, Crescimento regional, Regiões do interior, Infraestruturas e equipamentos turísticos. * PhD in Economics, Assistant Professor, Researcher at NECE – Research Unit in Business Sciences, Management and Economics Department, Faculty of Social Sciences and Humanities, University of Beira Interior, Covilhã, Portugal. ** PhD in Economics, Full Professor, Researcher at NECE – Research Unit in Business Sciences, Management and Economics Department, Faculty of Social Sciences and Humanities, University of Beira Interior, Covilhã, Portugal. *** PhD in Transportation, Assistant Professor. Researcher at AeroG - Aeronautics and Astronautics Research Center (MECH-Centro-Covilhã-4034), Aerospace Sciences Department, Faculty of Engineering, University of Beira Interior, Covilhã, Portugal. **** PhD Student in Aeronautical Engineering, Researcher at AeroG – Aeronautics and Astronautics Research Center (MECH-Centro-Covilhã-4034), Aero-space Sciences Department, Faculty of Engineering, University of Beira Interior, Covilhã, Portugal. ***** Master Student in Entrepreneurship, Management and Economics Department, Faculty of Social Sciences and Humanities, University of Beira Interior, Covilhã, Portugal.
1. Introduction Tourism is crucial to the vitality of Portugal’s econ-omy and one of the most important economic activities in terms of income and employment. The added value created by tourism (TGVA) represents 4.8% of the GVA of the Portuguese economy. With an overall share of 14.6% of the Total Exports of Goods and Services tour-ism is a major exporter. Its share in GDP is 10.4% and represents 7.9% of employment (tourism characteristic activities) (Turismo de Portugal, n/d).
Throughout the country Portugal offers natural, cultural and environmental odd conditions for tourist attraction. Nevertheless the Portuguese coast1 remains
the most preferred destination for domestic and inbound tourists, registering the highest values for all indicators either on the supply or on the demand side (Vaz and Dinis, 2007). This unbalanced tourist distribution is similar to the global patterns. As referred by Markovic et al. (2009) 12 of the 15 world’s top destinations in 2000 were countries with coastlines, reflecting the tourist preferences: 63% of European holidaymakers prefer the coast as compared to 25% favouring mountains, 25% preferring cities and 23% the countryside (Markovic et al., 2009). In recent years, reflecting changes and tendencies in worldwide terms, there has been an effort to reverse the situation, not only on account of the saturation and environmental damage of many demanded places associated with the sun and sea, but also because of changes in the motivations and preferences of tourists, with a growing environmental awareness. There is evidence of change on the Portuguese tourism dynamics (Vaz and Dinis, 2007), with the coastal tourism growing at a slower pace (3.6%) than the inland areas (4.3%). This may be due either to saturation of some traditional destinations or to changes in tourist motivations, considering that the natural and cultural aspects of these inland regions form the basis of their tourism product. These inland regions are mostly demanded by the Portuguese tourists, while the littoral areas are the main destination of inbound tourists. However, the
average length of stay is rather low, which shows a type of tourism best suited for short stays or associated with the concept of touring.
The growing demand of the hinterland, an increasingly qualified offer of tourism products and facilities and a greater promotional investment, give these regions a greater growth potential. Aware of the tourism potential (but not always considering its negative impacts), also the local and regional authorities have been electing tourism as a development strategy, investing their scarce resources on infrastructure, equipment and other amenities capable of attracting tourists and investors.
This is the case of two Portuguese regions, Norte and Alentejo (NUTS II), which include, respectively, the NUTS III Alto-Trás-os-Montes and Alentejo Central that we present in this study. These regions are being subject of analysis under the AIRDEV project, since they are both equipped with airport infrastructure (aerodromes) and several facilities, have different usage patterns of the infrastructure and different levels of tourism development.
The main aim of this paper is to study whether the investments made in related-tourism facilities contributed to the economic growth of all2 the NUTS
III included in the North and Alentejo regions, with particular emphasis on Alto-Trás-os-Montes and Alentejo Central. A panel data approach is used to assess the contribution of several related tourism variables to the GDP of those regions.
2. Tourism and Regional Economic Growth. The relevance of the subject
Professor Michael Hall (Hall, n/d) titles as “place wars” the following citation of Kotler et al. (1993: 346): 1 Mainly Algarve, Lisbon coastal region, North Littoral and Madeira Island. 2 Excluding “Lezíria do Tejo” for reasons of conflict of data, given the change in composition of NUTS made in 2002 by the National Institute of Statistics.
In a borderless economy, [places] will emerge as the new actors on the world scene… All places are in trouble now, or will be in the near future. The globalization of the world’s economy and the accelerating pace of technological changes are two forces that require all places to learn how to compete. Places must learn how to think more like businesses, developing products, markets, and customers. Within our globalised world, this “war of places”, fighting for capital, firms, people and opportunities, involves a central paradox (Harvey, 1989, quoted by Ashworth and Dietvorst, 1995: 3): the less important the spatial barriers are, the greater the sensitivity of capital to places variations, and the greater the incentive for places to differentiate themselves in order to attract capital.
But as referred by Hall (n/d) unless places are accessible to the mobilities they are trying to attract they cannot compete. Over time all places have competed to be accessible by communications technology. If in the 19th century places competed for the railroad and/or the steamship to stop and in the 20th century competed for cars to stop, in the 21st century places compete for planes to stop. It is argued (Dinis and Vaz, 2010) that the new rules of ‘game’ offer a new economic opportunity for rural and remote regions and for their firms to reach a better position on the ‘board’ of the world economy. But rural and remote areas have weaknesses facing threats from their own characteristics and status of the periphery. And it is known that peripheral economies tend to be dependent on few industries which are of-ten resource-based (such as mining, power generation, forestry, fishing or extensive grazing) and highly subject to economic change and restructuring. However, the re-valorisation of an increasing number of elements in the rural world are transforming them into valuable economic assets, which is turning tourism as a mean of diversification and a response to restructuring. Tourism is integral to issues of place competition and has become a key sector in the world economy. Currently, the industry generates more than a third of world exports of services and more than 70% of exports in the poorest countries and is an important engine to stimulate growth and prosperity. In addition to income and employment, tourism has contributed to the development of most European regions. Infrastructure built for the sake of tourism contribute to local development and jobs are created or preserved, even in areas suffering industrial decline or rural or urban regeneration experience (Ramos and Jiménez, 2008).
As an engine for economic growth (Franco and Estevão, 2010), the national appeal of tourism is significant. But at regional and local levels this sector has been presented by policymakers as an essential tool for regional development, capable of preventing desertification and regional stagnation, stimulating the potential of underdeveloped regions. In fact, the worldwide dynamic of tourism and its growth has attracted the attention of a large number of regional and local authorities and even greater interest of the regions with low population growth, declining employment levels, and images as declining areas (Rosentraub and Joo, 2009). Trying to capture for their communities a greater share of tourism businesses, those authorities have invested the scarce resources in tourism, sports and entertainment and other tourism facilities. Also tourism often induces local entrepreneurs to provide new facilities and infrastructures which will eventually serve tourists and residents (Briassoulis, 2002).
From the theoretical point of view the positive contribution of tourism expansion to economic growth has been advocated by several authors (e.g. Balaguer and Cantavella-Jordà, 2002; Dritsakis, 2004), but only recently (Seetanah, 2011) this issue has attracted great interest from the point of view of empirical analysis, with a number of empirical papers confirming the tourism industry’s contribution to a country’s economic growth (e.g. Balaguer and Cantavella-Jordà, 2002;
Kim et al., 2006; Noriko and Mototsugu, 2007; Po and Huang, 2008). Similarly, Proença and Soukiazis (2005) and Rosentraub and Joo (2009) examined the impact of tourism at the regional level.
To the best of our knowledge, there are not many studies that gave empirical contribution of tourism-related facilities to the economic growth of small regions. The empirical study of Rosentraub and Joo (2009) while addressing a similar subject is more comprehensive both in terms of territory (American metropolitan areas) and in terms of selected variables.
3. Tourism-related facilities
Tourist research has attracted considerable attention by the scientific and professional community in recent years (Botti et al., 2008).
For Rosentraub and Joo (2009) the challenge for the successful development of tourism lies in selecting an appropriate set of amenities that can attract the i) local residents whose political support is needed for approval of public sector investment, ii) new residents (highly talented and productive human capital), and iii) visitors capable of generating a vibrant tourist economy.
The selection of the appropriate mix of amenities is a fundamental issue to economic development as it allows assessing the relationship between investments in tourism and entertainment amenities and the improvement of a region’s economy.
Facing the importance of investing in infrastructure in order to expand the tourism activities, there are many different views on how this can be best accomplished. Establish the role of the interests of public and private sectors may be the key to understand how infrastructure can be implemented to ensure sustainable tourism development at all levels of society (UNESCAP, 2001). The ultimate goal is to identify which investments (if any) in the built environment can increase the level of available amenities in order to create jobs and produce positive economic returns.
Pearce (1981, quoted by Rosentraub and Joo, 2009: 763) identified five elements as fundamental to understanding the range of tourist activities and levels of tourism: attractions, transport options, accommodation, facilities and support activities, and other types of infrastructure that can improve the experience of a tourist. Further he divided attractions
in (1) natural resources, (2) built environment (objects), and (3) cultural elements (music, folklore, cuisine).
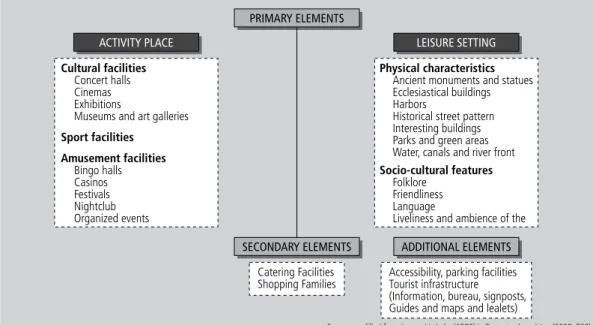
Another typology is that of Jansen-Verbeke (1986). She considers primary elements the specific facilities where tourism occurs. These places are composed of activities related with cultural, sports, or entertainment facilities. Secondary and additional components are related to business and amenities (see Figure 1).
These examples of classification of tourist attractions are supply-oriented. In our empirical study we are using a supply and a demand oriented variables, as it will be explained. As stated by Gunn (1994, quoted by Rosentraub and Joo, 2009: 763) people travel to, or participate in leisure activities, because they are “pushed” or “pulled” by different motivations and amenities available and their attributes. If the market offers the “push”, the main attractions provide the “pull”.
4. Empirical study 4.1. Goal and Methodology
The goal of our empirical study is to assess the contribution of tourism-related infrastructures/ amenities to the economic growth of the Portuguese
regions Trás-os-Montes and Alentejo Central,
given the growing commitment of the regions in investment in tourism as a development strategy. For that we selected the Panel Data Analyses to explain the contribution of several tourism related variables to the economic growth of the regions. A panel data is a group of sectional units (N) that are observed in time. In our study the units are N = 12 Nuts III and referred to the period from 2000 to 2010 (T = 55).
The use of panel data allows taking into account differences between regions, i.e. it enables us to appreciate the heterogeneity of the group
NUTS III. On the other hand, these panel data are increasingly allowing extensive dynamic factors that are considered important in the tourism market.
Another topic of interest related to the panel data relates to the estimation of econometric models that describe the behaviour of individuals over time. In fact this data type allows you to control or take due account of the differences between countries, to study the dynamics of adjustment, and also the measurement of other effects such as technological change.
For each type of data should take into account not only the assumptions that affect the random errors of the model, as well as assumptions about whether, how and when to change the parameters between individuals and between different periods (Hill et al., 2011).
According to Hsiao (2003) and Klevmarken (1989) the “panel data” (i) allow to control the diversity and the differences between countries, (ii) processing of much information, more variability, less multicollinearity between variables explanatory, more degrees of freedom and greater efficiency, (iii) allow to study the dynamic adjustment in time, (iv) have a greater capacity to identify and measure the effects of purely sectional or purely chronological undetected, (v) allow to build models of behaviour and prove more complicated than the cross-section or pure time series and (vii) reduce or eliminate risk or bias that results from the aggregation of data. According to these authors, the limitations and disadvantages of “panel data” have to do with: (i) the limits resulting from design and data collection, (ii) the bias of measurement error, (iii) the problems of selectivity, (iv) the temporal dimensions often very short and (v) the dependence of the section.
The fixed effects model is intended to control the effect of omitted variables that vary between individuals or countries / regions, and remain constant over time. It is assumed that the intersections vary from country to country / region to region, but are constant in time. To eliminate multicollinearity between countries, Stock and Watson (2004)
suggest estimating the following model: yit = αi + b1x1it + b2x2it +…+ bkxkit + uit
(i= 1,2,...,6 and t= 1960,...,2009 in his application). This can also be our model where yi (dependent variable) is the GDP per capita from 12 different regions or NUTS III, the Xjit is the different factors that explain the growth of tourist demand – already mentioned – and αi are the intersections. The uit are
the random errors of the model that are subject to the following assumptions/hypotheses: (i) Null mean value, E(uit)=0; (ii) constancy of the differences, or homoscedasticity, ; and (iii) no correlation errors in time E(uitujt+s) = 0 (t, s= 1,2,…). The fixed effects of this model are measured by a coefficient for each region that gives us the deviation of each country or region in relation to the common intersection c. It can be proved the hypothesis that the values of the fixed effects do not vary from one region to another (constant effect) through the Chow test.
4.2. Selection of the Variables
The difficulty in obtaining disaggregated data determined the selection of the variables. To the selection of the supply oriented variables we follow
closely wherever possible the aforementioned
typology of Jansen-Verbeke adding however another that we consider other available and relevant (such as crime rate).
About the demand variables is important to explain that some amenities may be used by residents and/or visitants, which means that both may be included in the number of users of that facilities. We must have in mind that if the quality of the amenity and the mix of services and activities are critical to the success of tourism they also may be critical to the welfare of the residents.
The variables are the following: number of beds; net occupancy rate of bed; purchasing power index; effective rate of population growth;
crime rate; number of visitors to museums, zoos, botanical gardens and aquariums; number of visits to art galleries; length of stay; sport and culture expenditures and GDP per capita of the NUTS III.
4.3. Data, Results and Interpretations
The explained variable is the per capita GDP and the explicative variables are technical progress (measured by a proxy associated to time, the year), the average stay, the expenses on sport and culture, the PPI – Purchase Power Index, the number of beds, the number of guests, the number of visitants to museums, the rate of occupation by bed, the growth rate, and the crime rate (and C (X=1)). All the data used is collected from the national statistic institute (INE) 3.
To study the effect of tourist factors on the economical growth of the regions (NUTS III) we use three models: a pooled regression model (model I), a panel data fixed effects model (model II) and a panel data random effects model (model III). The results of the three models can be seen in Table 1. The methods used are the panel least squares for the pooled and the fixed effects models and the EGLS – Estimated General Least Squares for the random effects model.
Explicative factors or variables of economic growth of the regions:
– Pooled regression model and panel data fixed effects model: 3 factors are significant in the two models: the expenses on sport and culture, the PPI – Purchase Power Index, the number of visitants to museums).
– Panel random effects model: 8 factors and the intercept are significant in statistical terms: tech-nical progress, the average stay, the expenses in sport and culture, the PPI – Purchase Power Index, the number of guests, the number of visitants to museums, the growth rate and the crime rate. 3 www.ine.pt.
Global statistical significance of the three models: all the three models are highly significant in statistical terms at the 1% level of significance. Redundant fixed effect test – panel data fixed effects: the results of this test permits us to reject the null that the fixed effects are redundant. This means that there are differences in statistical terms among the different regions. Hausman correlated random effects test – panel data random effects test: the results reject the null that the random effects are correlated with the explicative variables (Greene, 1997). The rejection of the null of this test means that the random effects model is preferred to the one with fixed effects.
The variables that affect positively the economic growth of the regions (measured by per capita GDP) are the average stay, the PPI – Purchase Power Index, the number of visits to museums, the crime rate and intercept (5 plus C but the rate of occupation by bed is not significant in statistical terms (using the random effects panel data model or model III). Nevertheless, all the models considered in the analysis have the same positive signs.
The variables that affect negatively the economic growth of the regions (measured by per capita GDP) are the technical progress (using the time (year) as proxy), the expenses on sport and culture, the number of beds, the number of guests and
population growth rate, 5 variables, but the number of beds is not significant in statistical terms.
Rationality of the results: the factors that affect positively economic growth of the regions are logic; the most curious is that crime rate is positively correlated with growth; of course this does not mean that crime rate pushed growth but it can be that growth carries crime rate increase. In the case of factors that affect negatively economical growth all the cases are surprising, so they are not rational in economic terms: that is the case of technical progress that decreases economical growth (may be because it decreases the number of employees in the regions or increase the unemployment rate). For the others (expenses on sport and culture, number of beds, number of guests and growth rate) we don’t find any rational explanation, unless the possibility of multicollinearity among some variables or factors.
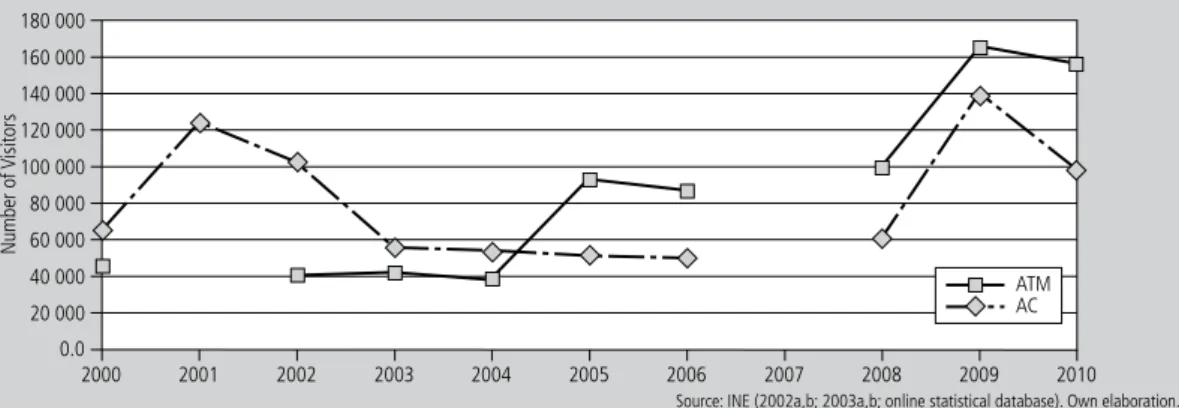
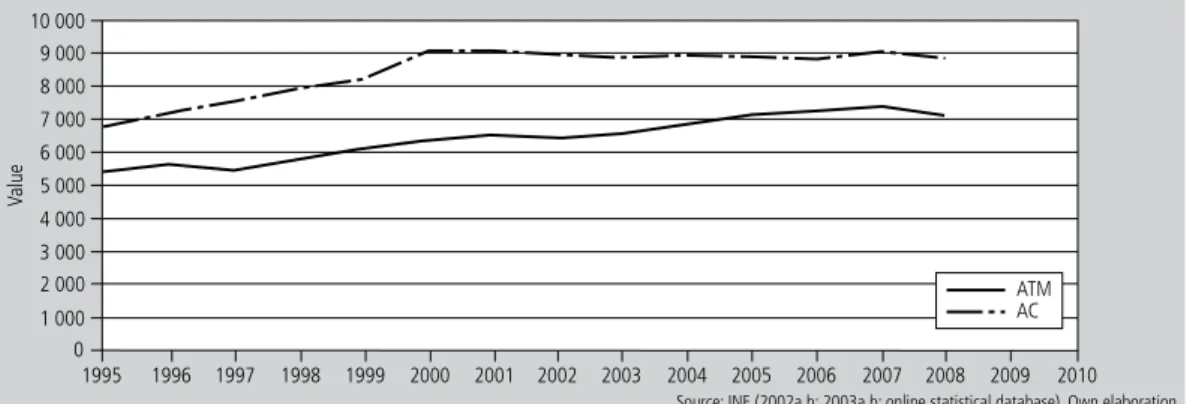
5. The case of Alto Trás-os-Montes and Alentejo Central: does the model corroborate local tourism realities? Both bordering Spain, the Alto Trás-os-Montes region is located in the northern part of Portugal, while the Alentejo Central is located further in the south. The investment effort made in the last decade by both regions to increase its accommodation capacity is reflected in the following figure (Figure 2). Although the Alentejo Central (AC) presents an accommodation capacity lower than that of Alto Trás-os-Montes (ATM), its continued growth is translated by an average annual rate of 3%, against 1% of Alto Trás-os-Montes. Since 2006 this last region shows a breakdown in its accommodation capacity, probably due to an over sizing supply, as between 2005 and 2006 significantly increased the number of beds. The Net Rate of Bed Occupancy represents the number of beds sold relative to total number of beds available. We can observe (see Figure 3) that despite having a supply of beds above the AC and although the number of beds in ATM is decreasing, the net rate of bed occupancy is much higher in AC than in ATM, which strengthens the hypothesis that the supply of accommodation in ATM is over sized. However, the values of this indicator have fluctuated more in AC than in ATM during the analyzed period. Reinforcing the previous analysis we can observe (see Figure 4) that the AC region has managed to attract a higher number of tourists (measured by the number of guests in hotel establishments) then the ATM region. Despite some fluctuations, more pronounced in AC than in ATM, both regions have seen increasing tourist demand, albeit at different speeds: faster in AC (2% on average per year) than in ATM (1%).
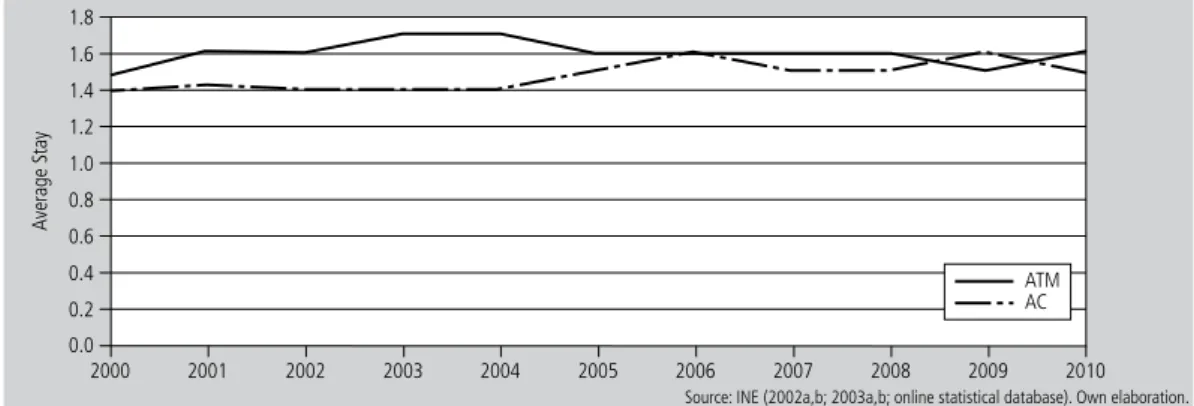
The length of stay refers to the average number of nights a guest stays in an establishment. The low average stay revealed in the following figure (Figure 5) shows that both regions are demanded for short-breaks. Figure 6 depicts the number of Museum visitors in Alto Trás-os-Montes (ATM) and Alentejo Central (AC). There were no data values available for the year 2007 for AC and there were no values for the years of 2001 and 2007 for ATM. Figure 5 | Length of Stay. Figure 4 | Number of Guests. Figure 3 | Net Rate of Bed Occupancy.
It is interesting to see that, until, 2006, the two regions vary relatively independently one from the other, making difficult any conclusion from that analysis. From 2008 to 2009, there is a strong thrust in both regions, followed by a decrease in the follow-ing year. The number of visitants increased 66.33% in ATM and 135.11% in AC.
It is very curious that, in the year of 2009, a year of particular decrease in Portugal’s national GDP growth rate (-3%), the number of visitants in museums dramatically increased in both regions. This can be explained by the political measures taken by the government, allowing free entries during Sunday and holiday mornings, and the increment of the proportion of national tourists in the total number of entries.
The number of galleries’ visitors in Alentejo
Central (AC) and Alto Trás-os-Montes (ATM) during the 2000-2010 period, can be seen on the next figure (Figure 7). Related with AC, there are no data available for the year of 2007, and no data values for ATM during the years of 2001 and 2007. It is also interesting to see that, during the ten year period, both regions vary similarly exclusive the year of 2009 to 2010 where the ATM increases their galleries visitors, but not on the AC region. Globally, there was a regular increasing of galleries visitors in the ATM region, and a high volatility in AC region. A parallelism can be made between museums and galleries visitors, with a higher volatility for AC and a better long-run growth for ATM.
Interestingly enough, the regional GDP per capita has evolved poorly in the past 10 years in AC, whereas the regional GDP per capita has
Figure 6 | Number of Visitors of Museums.
grown at better rates in ATM, showing that there are convergence between the two regions (Figure 8). Still, the GDP per capita of AC is clearly above ATM, showing a greater economic performance, thus having a clear influence on the capacity of sustaining higher growth rates. Seasonality is a great problem inherent to tour-ism economics. This is particularly visible in Portugal, since coastal areas are greatly demanded in the summer. Despite this, the inexistence of relevant monthly data at the municipal level has proven to be a problem to seize the seasonality of regional tourism in Portugal (Vaz and Dinis, 2007).
6. Conclusions
Some surprising results can be explained by the choice of the variables and or some missing values of the chosen variables. Nevertheless a careful analysis of the graphics suggests that these results can be rejected for Alentejo Central and Alto Trás-os-Montes.
For example, the analysis of the number of visitors in museums and art galleries show a surprising upheaval in 2009, a year characterized by a strong recession in terms of GDP, which suggest that periods of poor economic performance in Portugal may increase the domestic tourism.
The model suggests that an increase in the number of beds act negatively to the GDP per capita, and that there is a negative correlation between the number of guests and GDP per capita. Related to ATM’s number of beds, the supply is clearly above the demand, and needs to be adequate to increase the efficiency. The net bed occupancy rate corroborates this theory. But it is difficult to understand how guests can reduce the GDP per capita of those regions, and the graphics do not seem to confirm, nor decline these results. We only can affirm that there is a trend of growth for tourism demand in both regions, while GDP per capita has stagnated in the last 10 years in AC.
Further research is needed to explore other variables related with tourism, as well as a greater length of time, extended to all the NUTS III regions in Portugal. Bibliography Ashworth, G., and Dietvorst, A., 1995, Tourism Transformations: an Introduction, in Ashworth, G., and Dietvorst, A. (eds.), Tourism and Spatial Transformations. Implications for Policy and Planning, Cab International, United Kingdom, pp. 1-13.
Balaguer, J., and Cantavella-Jordà, M., 2002, Tourism as a long-run economic growth factor: The Spanish case, Applied Economics, Vol. 34, pp. 877-884.
Botti, L., Peypoch, N., and Solonandrasana, B., 2008, Time and tour-ism attraction, Tourism Management, Vol. 29, pp. 594-596. Briassoulis, H., 2002, Sustainable tourism and the question
of the commons, Annals of Tourism Research, Vol. 29(4), pp. 1065-1085.
Dinis, A., and Vaz, M., 2010, Proceedings of 33rd Annual Institute for Small Business & Entrepreneurship (ISBE) Conference: Looking to the Future: Economic and Social Regeneration through Entrepreneurial Activity, Sustainable Tourism in Rural Areas: a model to measure the value of networks, November 3-4, London.
Dritsakis, N., 2004, Tourism as a long-run economic growth factor: an empirical investigation for Greece using causality analysis, Tourism Economics, Vol. 10(3), pp. 305-311.
Franco, M., and Estevão, C., 2010, The role of tourism public-private partnerships in regional development: a conceptual model proposal, Cadernos EBAPE.BR, Vol. 8, pp. 600-612. Greene, W., 1997, Econometric Analysis, 3 ed., Prentice-Hall,
London.
Hall, M., n/d, Tourism in peripheral areas: place competition, accessibility and development, [http://canterbury-nz.academia. edu/CMichaelHall/Talks/10762/Tourism_in_Peripheral_ Areas_Place_Competition_Accessibility_and_Development], (Site accessed 03 January 2012).
Hill, R., Griffiths, W., and Lim, G., 2011, Principles of Econometrics, 4 ed., Wiley.
Hsiao, C., 2003, Analysis of Panel Data, 2 ed., University Press, Cambridge.
INE, 2002a, Anuário Estatístico da Região Alentejo, Instituto Nacional de Estatística, Lisboa, [http://www.ine.pt], (Site accessed 16 January 2012).
INE, 2002b, Anuário Estatístico da Região Norte, Instituto Nacional de Estatística, Direcção Regional do Norte, Porto, [http:// www.ine.pt], (Site accessed 16 January 2012).
INE, 2003a, Anuário Estatístico da Região Norte, Instituto Nacional de Estatística, Direcção Regional do Norte, Porto, [http:// www.ine.pt], (Site accessed 16 January 2012).
INE, 2003b, Anuário Estatístico da Região Alentejo, Instituto Nacional de Estatística, Lisboa, [http://www.ine.pt], (Site accessed 16 January 2012).
Jansen-Verbeke, M., 1986, Inner city tourism: resources, tourists, promotors, Annals of Tourism Research, Vol. 13(1), pp. 79-100 Kim, H., Chen, M., and Jan, S., 2006, Tourism expansion and
economic development: The case of Taiwan, Tourism Manage-ment, Vol. 27, pp. 925-933.
Klevmarken, N., 1989, Introduction: Panel Studies: What Can We Learn from Them?, European Economic Review, Vol. 33(2-3), pp. 523-529.
Kotler, P., Haider, D. H., Rein, I., 1993, Marketing places: attracting investment, industry, and tourism to cities, and nations, The Free Press, New York (USA).
Markovic, M., Satta, A., Skaricic, Z., and Trumbic, I., 2009, Sustainable Coastal Tourism: An integrated planning and management approach, “Practical Manuals on Sustainable Tourism”, United Nations Environment Programme, Croatia.
Martins, C., 2010, Turismo em zonas rurais: oportunidades para a região de Trás-os-Montes e Alto Douro, [http:// bibliotecadigital.ipb.pt/handle/10198/2238], (Site accessed 03 January 2012).
Noriko, I., and Mototsugu, F., 2007, Impacts of tourism and fiscal expenditure to remote islands: The case of the Amami islands in Japan, Applied Economics Letter, Vol. 14, pp. 661-666. Po, W., and Huang, B., 2008, Tourism development and economic
growth: A nonlinear approach, Physical A: Statistical Mechanics and its Applications, Vol. 387, pp. 5535-5542. Proença, S., and Soukiazis, E., 2005, Tourism as an alternative
source of regional growth in Portugal: A panel data analysis at NUTS II and III levels, Portuguese Economic Journal, Vol. 6(2), pp. 56-64.
Ramos, A., and Jiménez, P. (ed.), 2008, Tourism development: Economics, Management & strategy, Nova Science Publisher Inc., New York.
Rosentraub, M., and Joo, M., 2009, Tourism and economic development: Which investments produce gains for regions?, Tourism Management, Vol. 30, pp. 759-770.
Seetanah, B., 2011, Assessing the dynamic economic impact of tourism for island economies, Annals of Tourism Research, Vol. 38, pp. 291-308.
Stock, Mark and Watson, James, 2004, Combination forecasts of output growth in a seven-country data set, Journal of Forecasting, Vol. 23, pp. 405-430
Turismo de Portugal, n/d, O Turismo na Economia, [http://www. turismodeportugal.pt/Portugu%C3%AAs/ProTurismo/ estat%C3%ADsticas/an%C3%A1lisesestat%C3%ADsticas/ contasat%C3%A9litedoturismo/Anexos/CST%20turismo% 20na%20economia%20Out2010.pdf], (Site accessed 27 December 2011).
UNESCAP, 2001, Promotion of Investment in Tourism Infrastructure Economic and Social, Commission for Asia and the Pacific, [http://www.unescap.org/ttdw/Publications/TPTS_pubs/pub_ 2133_tor.pdf], (Site accessed 29 December 2011). Vaz, M., and Dinis, A., 2007, Turismo no Litoral Versus Turismo
no Interior Português. O destino turístico Serra da Estrela, in Estudos regionais – Revista Portuguesa de Estudos Regionais, N.º 14, 1º quadrimestre, APDR-INE, Coimbra, pp. 71-98.