RESILIENCE OF WATER SUPPLY SYSTEMS – CASE STUDY OF
QUINTA DO LAGO
João Caetano1*, Miguel Oliveira2, Elisa Silva2, Helena Fernandez2 and Rui Lança2
1: Student of Civil Engineering (2nd cycle), Infraquinta, E.M. Avenida da Gondra
Quinta do Lago 8135-024 Almancil, Portugal
e-mail: joao.caetano@infraquinta.pt, web: http://www.infraquinta.pt 2: Civil Engineering Department
Instituto Superior de Engenharia Universidade do Algarve
8005-139 Faro, Portugal
e-mail: {mjolivei, esilva, hfernand, rlanca}@ualg.pt, web: http://ise.ualg.pt
Keywords: Water Supply, Hydraulic modelling, Network resilience
Abstract On the South of Portugal, namely in Quinta do Lago – Algarve the water
consumption pattern changes from winter to summer, mainly due to the seasonality of touristic occupation and irrigation of green areas.
In Quinta do Lago many plots have boreholes to extract groundwater for irrigation, however in summer, when the irrigation demand has its peak, the groundwater table lowers and it is observed saline intrusion into the aquifer. The increased concentration of salts in groundwater also increases the water demand for irrigation as the soil lixiviation must be attended. This phenomenon forces the owners to irrigate the private green areas with fresh water from the water supply system. In the last years, the number of plots irrigated with fresh water has increased and the current trend may cause the failure of the water supply system.
In the present study the hydraulic and operational performance of the water supply system of Quinta do Lago is assessed, considering the increase on water demand for the irrigation of the private green areas.
The used methodology is based on the hydraulic modelling of the water supply system and evaluation of performance indicators using penalty functions.
From the analysis it is pointed out that undertaking appropriate oper ational modes, the water supply system may be resilient to the increase in water demand and investment in new infrastructure to attend this phenomenon may not be required.
1. INTRODUCTION
Quinta do Lago is located in Algarve, South of Portugal, and it is a touristic resort with infrastructures and services proper to this activity, managed by Infraquinta. The touristic seasonality in Quinta do Lago is characterized by instability in occupation rates, with high asymmetry between summer and winter. In summer, the occupation rate reaches its peak, while in winter it is considerably lower.
The water supply system has to respond to Infraquinta customers with high quality level, considering the occupation seasonality and also the water demands for irrigation.
According to Agência Portuguesa do Ambiente (APA), all the aquifer in the area of Infraquinta has risk of saline intrusion, which may lead to the overload of the water supply infrastructures in a near future, due to the irrigation of the private green areas with fresh water from the water supply network.
This phenomenon has high impact on the fresh water consumption, which may lead to the necessity of investment in the increment of the hydraulic capacity of the existing infrastructure.
This study shows that by changing the operational mode of the water supply network it is possible to increase the resilience of the system in a scenario where the fresh water demand increases.
2. WATER SUPPLY SYSTEM
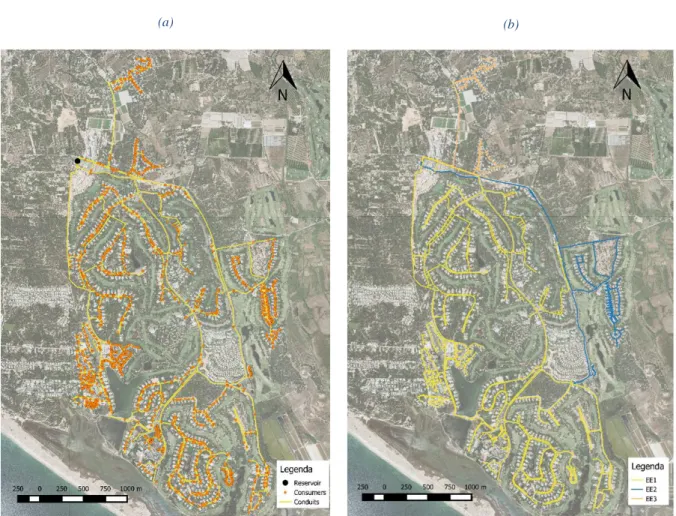
The water supply system from Infraquinta has a distribution network with approximately 72.8km in pipe length, a reservoir with two cells and a total capacity of 5630m3 and three pump stations with electronic frequency control, which allows to maintain the head, H, constant even with the flowrate, Q, variation. The application of this technology saves energy by decreasing the required power, Pe. On Table 1 it is indicated the flowrate, head
and power of the three pump stations, EE1, EE2 and EE3.
Table 1 – Properties of the existing pump stations
ID Nº of pumps Q (l/s) H (m) Pe (kW) EE1 (2+1)+(3+1) 100.00 37.60 36.90 EE2 3+1 37.50 38.70 14.24 EE3 2+1 18.33 54.95 9.88
The representation of the physical components of the water supply system and consumers is shown in Figure 1a, and the areas of influence of the three existing pump stations may be
(a) (b)
Figure 1- Representation of the water supply system: (a) physical components and consumers; (b) areas of influence of the three pump stations
3. CONSUMPTIONS
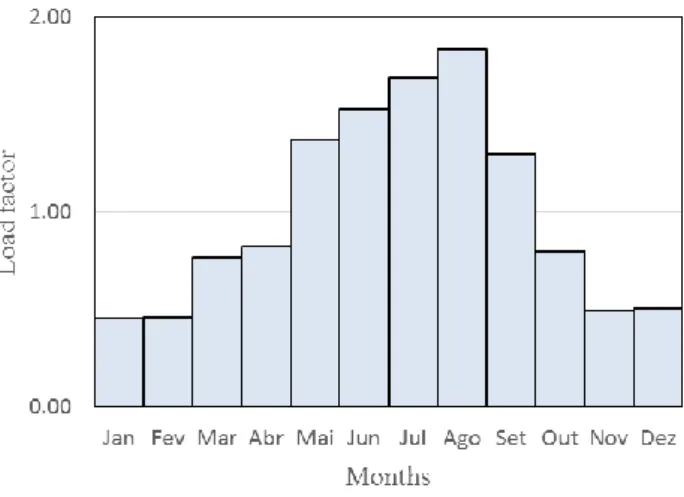
To understand the effect of the touristic seasonality on the water consumption and the irrigation requirements over the year, it was used as reference the monthly water invoiced during 2014. The monthly load factor presented in Figure 2 was obtained normalizing the monthly water consumption by the average monthly water consumption.
Figure 2 – Monthly load factor
From Figure 2 it is observed that there are two seasons per year with very homogeneous monthly load factors, namely, a high season, between June and August, with monthly load factors of about 1.8, and a low season between November and February, with monthly load factors of 0.4. The tourist seasonality and the changes in the irrigation needs throughout the year are reflected on these consumptions.
Infraquinta has telemetry technology installed on all consumers which allows to get data with hourly frequency and obtain the pattern of daily consumption during the high season. As identified in Figure 3, the standard daily consumption pattern reveals a typical behavior which clearly varies in a situation where the customer has a borehole for irrigation or not.
(a) (b)
Time (day-h:min) Time (day-h:min)
Co n su m p ti o n (m 3) Co n su m p ti o n (m 3)
consumption occurs in two periods of the day, namely from 02h00 to 04h00 and from 19:00 to 21:00. The irrigation component has high values comparing with the domestic consumption, concluding that the water used for irrigation is approximately 50 times higher than the water used for domestic proposes. This consumption pattern occurs because most plots have a large percentage of area occupied by gardens.
When the concentration of salts in the groundwater extracted from the boreholes increases due to saline intrusion into the aquifer, the customers, as it appears, chooses to use fresh water from the supply system of Infraquinta and consequently the fresh water consumption tends to increases in response to the irrigation needs.
4. HYDRAULIC MODELLING
Facing the future scenario where it is expected an increment of water consumption, Infraquinta, is concerned about the hydraulic capacity and resilience of the existing infrastructure. Even with constant observations of flowrate, head and chlorine concentration in several locations, the hydraulic behaviour of the water supply system is not very well understood. In order to assess the effect of the increase of water demand on the water supply system, a hydraulic model based on Epanet 2.0 linked with QGIS was applied. This tool predicts the hydraulic response of the water supply system from the properties of its components, allowing the choice of the optimal operational mode [3].
The hydraulic model of the water supply system was applied for the high season and the alternative operational mode was adjusted to minimise head losses and increase the network resilience to the future water demand [1].
From the analysis of the results obtained by the hydraulic model mentioned above, it was observed high head losses in certain conduits for the current operational mode. Reducing those head losses it is possible to reduce the number of pump stations and increase the head on the remaining network. So, in order to find out which would be the alternative operational, several simulation tests were conducted, and at the end it was selected an alternative operational mode that minimises the head losses with the minimum number of physical changes in the system.
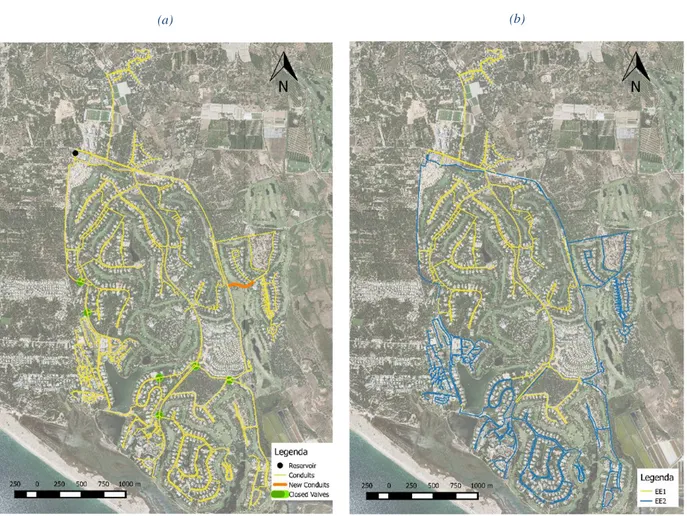
To implement the alternative operational mode it is necessary to construct a new conduit with a nominal diameter (DN) of 250mm and 300m long, and also change the state of some existing valves in order to redirect the network flow. In Figure 4a may be observed the new conduit and also the location of those valves.
The achieved reduction in head losses maximises the total head across the pipe network and also allows smaller heads on the pump stations. During the simulations were tested several heads on the pump stations and by turning off EE3 and keeping EE1 and EE2, with heads of 22m and 15m respectively, the head on the consumers improves significantly. The areas of influence of pump stations EE1 and EE2 are represented in Figure 4b.
(a) (b)
Figure 4 – Water supply system: (a) pipe network with the physical modifications required for the alternative operational mode; (b) areas of influence for the pump stations EE1 and EE2 on the alternative operational mode 4.1. Evaluation criteria
The obtained results from the model are expressed as hydraulic variables (flowrate, flow velocity, head) [3], which make difficult the direct comparison between the actual operational mode and the alternative operational mode.
The comparison is possible through the assessment of the objectives using penalty functions (Figure 5) [2] [5]. This methodology allows the conversion of hydraulic variables in performance indicators. The alternative operational mode is selected according to Tactic Plan of Infraquinta [5] and it is related with the head delivered to the consumers.
The maximum head performance indicator may be related with leaks and water losses across the pipe network [1]. The minimum head performance indicator is used to assure that across
(a) (b)
(c)
Figure 5- Penalty functions: (a) minimum head; (b) maximum head; (c) head range
Thereafter the performance indicators on each node are weighed by the water consumption on the respective node, Equation 1, and the element level calculation is extended across the water supply network to obtain the global performance indicator, Equation 2 [1].
𝜔𝑝𝑖 = 𝑄𝑖 ∑𝑁 𝑄𝑖 𝑖=1 (1) 𝑃𝑝 = ∑(𝜔𝑝𝑖× 𝑝𝑚𝑝𝑖) 𝑁 𝑖=1 (2)
5. RESULT ANALYSIS
Since the methodology adopted generates a huge volume of results, it was decided to present them in a graphical mode, in order to make it easier to analyse.
The Figures 6, 7 and 8 represents several different water demands imposed to the system. Each one of those water demands corresponds to a static simulation, in which the nodal consumption is affected by load factors ranging from 1.0 to 2.0 [1]. This last one tries to take into account the increment of the population due to tourism and also the effect of the saline intrusion. With these graphical representations of the results the same become non-dimensional, being non-dependent of the network size and type.
In order to characterize the performance of the water network system presented in Figure 6, there were used curves representing the percentage of the water supply network pipe lengths with performances lower than the percentile curve [4], for a specific load factor. Figure 7 represents the maximum heads performance indicators and Figure 8 shows the head range performance indicators.
(a) (b)
Figure 6- System diagram for the minimum head: (a) actual operational mode; (b) alternative operational mode From Figure 6 it is remarked that the alternative operational mode significant improves the minimum heads performance indicators. It also shows that it is possible to increase 20% the water consumption and maintaining the head above the minimum limits on the consumption points.
(a) (b)
Figure 7- System diagram for maximum head: (a) actual operational mode; (b) alternative operational mode In Figure 7, the diagram associated to the maximum heads presents an increment of the performance indicators with the load factor, in both conditions, which means that when the consumption increases, the head decrease due to the head losses in the conduits and become close to the ideal service head (performance equal to 100%).
Although of the smooth slope of the performance curve in both situations, the actual operational system of the water network presents a higher sensibility in face of the demand variation.
indicating an increment of the head range on the network. Another significant deduction can be taken from the head fluctuations on the system diagram regarding the alternative operational system; in this case the head stability is much higher, since the variation is inferior to the values registered in the actual operational mode.
6. CONCLUSIONS
This study enhances that before investing in a new potable water supply infrastructure for Quinta do Lago, it is necessary to assess, in detail, the actual operational mode of the system and determine their weakness and fragile points. By doing so, it is possible to study several alternative operational modes, in order to minimize the head losses in the conduits and, consequently, the problems may be solved quicker and without affecting the population as well as the services and other infrastructures in the area.
In the present study, the considered alternative operational mode for the water supply infrastructure, show a significant improvement on the network performance indicators, even when considering the water consumption increment for this area in the future years. Another important aspect observed is the decrease of the total head in the water supply pump stations, resulting on the decrease on energy consumption for their operation as well as the reduction of water losses on the pipe network.
REFERENCES
[1] Alegre, H., Coelho, S.T., Covas, D.I.C., Almeida, M. do C., Cardoso, A., 2013. A utility-tailored methodology for integrated asset management of urban water infrastructure. Water Science and Technology: Water Supply 13, 1444–1451. doi:10.2166/ws.2013.108
[2] Leitão, J.P., Coelho, S.T., Alegre, H., Cardoso, M.A., Silva, M.S., Ramalho, P., Ribeiro, R., Covas, D., Poças, A., Vitorino, D., Almeida, M.C., Carriço, N., 2016. Moving urban water infrastructure asset management from science into practice. Urban Water Journal 13, 133–141. doi:10.1080/1573062X.2014.939092
[3] Rossman, LA., 2000. EPANET 2 Users Manual. U. S. Envirironmental Protection Agency, Cincinnati, USA.
[4] Jacob, A., 2006. Avaliação de Perdas em Sistemas de Distribuição de água: o caso de estudo da ZMC 320 da Epal. Dissertação para a obtenção do Grau de Mestre em Hidráulica e Recursos Hídricos, Instituto Superior Técnico, Universidade Técnica de Lisboa.


