Contents lists available atScienceDirect
Mitochondrion
journal homepage:www.elsevier.com/locate/mito
Original Research Article
In silico simulation of reversible and irreversible swelling of mitochondria:
The role of membrane rigidity
Vladimir I. Makarov
a, Igor Khmelinskii
b, Zaza Khuchua
c,d, Sabzali Javadov
e,⁎ aDepartment of Physics, University of Puerto Rico Rio Piedras Campus, San Juan, USAbFaculty of Science and Technology, Department of Chemistry and Pharmacy, and Center of Electronics, Optoelectronics and Telecommunications, University of Algarve,
Portugal
cThe Heart Institute, Cincinnati Children’s Hospital Medical Center, Cincinnati, OH, USA dDepartment of Biochemistry, Sechenov Moscow State Medical University, Moscow, Russia
eDepartment of Physiology and Biophysics, University of Puerto Rico Medical Sciences Campus, San Juan, PR, USA
A R T I C L E I N F O Keywords: Modeling analysis Mitochondrial swelling Ion transport Membrane rigidity Calcium
Permeability transition pore
A B S T R A C T
Mitochondria have been widely accepted as the main source of ATP in the cell. The inner mitochondrial membrane (IMM) is important for the maintenance of ATP production and other functions of mitochondria. The electron transport chain (ETC) generates an electrochemical gradient of protons known as the proton-motive force across the IMM and thus produces the mitochondrial membrane potential that is critical to ATP synthesis. One of the main factors regulating the structural and functional integrity of the IMM is the changes in the matrix volume. Mild (reversible) swelling regulates mitochondrial metabolism and function; however, excessive (ir-reversible) swelling causes mitochondrial dysfunction and cell death. The central mechanism of mitochondrial swelling includes the opening of non-selective channels known as permeability transition pores (PTPs) in the IMM by high mitochondrial Ca2+and reactive oxygen species (ROS). The mechanisms of reversible and
irre-versible mitochondrial swelling and transition between these two states are still unknown. The present study elucidates an upgraded biophysical model of reversible and irreversible mitochondrial swelling dynamics. The model provides a description of the PTP regulation dynamics using an additional differential equation. The rigidity tensor was used in numerical simulations of the mitochondrial parameter dynamics with different initial conditions defined by Ca2+concentration in the sarco/endoplasmic reticulum. We were able to estimate the
values of the IMM rigidity tensor components byfitting the model to the previously reported experimental data. Overall, the model provides a better description of the reversible and irreversible mitochondrial swelling dy-namics.
1. Introduction
Mitochondria are double-membrane organelles, consisting of func-tionally and structurally distinct outer mitochondrial membrane (OMM) and inner mitochondrial membrane (IMM). Mitochondria con-tain two compartments: a small intermembrane space (IMS) between the two membranes, and the interior site (matrix) of the organelle en-closed by the IMM. The mitochondrial matrix is responsible for the mitochondrial metabolic pathways including, among others, tri-carboxylic acid cycle, heme synthesis, urea cycle, and fatty acid oxi-dation. Changes in the matrix volume of mitochondria play a crucial role in mitochondrial life and death (Beavis et al., 1985; Bernardi,
1999; Halestrap et al., 1986; Lehninger, 1959). Mild mitochondrial swelling (MS) under physiologic conditions regulates metabolism and function of mitochondria, whereas excessive swelling causes mi-tochondrial dysfunction. Swelling of mitochondria is induced by ex-ternal (cytoplasmic) and inex-ternal (matrix) factors that affect ion gra-dients across the IMM and increase osmosis in the matrix (Bernardi, 1999; Szabo and Zoratti, 2014). Among ions, Ca2+ plays the central
role in the swelling of mitochondria where strong Ca2+ exchange
system across the IMM maintains Ca2+homeostasis in the matrix under physiological conditions. Ca2+ions enter the matrix through several
IMM channels including the mitochondrial calcium uniporter (MCU), rapid mode channel (RaM), and mitochondrial ryanodine receptor 1
https://doi.org/10.1016/j.mito.2019.09.006
Received 25 February 2019; Received in revised form 7 August 2019; Accepted 23 September 2019
Abbreviations: ETC, electron transport chain; IMM, inner mitochondrial membrane; IMS, intermembrane space; MS, mitochondrial swelling;ΔΨm, mitochondrial
membrane potential; OMM, outer mitochondrial membrane; PTP, permeability transition pore; ROS, reactive oxygen species
⁎Corresponding author at: Department of Physiology, University of Puerto Rico School of Medicine, San Juan, PR 00936-5067, USA.
E-mail address:[email protected](S. Javadov).
Available online 25 October 2019
1567-7249/ © 2019 Elsevier B.V. and Mitochondria Research Society. All rights reserved.
(mRyR) (Giorgi et al., 2018; O'Rourke, 2007). The MCU is a highly selective channel that mediates Ca2+ influx in a ΔΨm-dependent
manner (Kirichok et al., 2004). The main mechanisms responsible for Ca2+release (efflux) are the mitochondrial Na+/Ca2+exchanger, the
Ca2+/H+ exchanger, and the permeability transition pore (PTP) (Griffiths, 2009; Hoppe, 2010; Szabo and Zoratti, 2014). Also, Ca2+
levels in the mitochondrial matrix may be regulated by physical and functional interactions between mitochondria and sarco/endoplasmic reticulum, a large reservoir of Ca2+(Lopez-Crisosto et al., 2017).
Increased Ca2+in the matrix accompanied by ATP depletion, high
phosphate ions (Pi) and accumulation of ROS causes an abrupt increase
in the permeability of the IMM to solutes and ions through the non-selective channels, namely PTPs. The PTP-induced swelling of mi-tochondria is driven by the colloid-osmotic pressure, which increases in the presence of non-diffusible matrix proteins and a high osmotic gra-dient across the IMM. In addition to Ca2+, the PTP opening depends on
pH, IMM potential (ΔΨm), and the redox state of the cell; low pH
in-hibits whereas low ΔΨm and high ROS stimulate the PTP opening
(Bernardi and Di Lisa, 2015; Halestrap et al., 1998; Javadov et al., 2009). Ca2+competes with a variety of negative modulators such as
ADP, cyclosporin A (cyclophilin D inhibitor), divalent cations (e.g., Mg2+), and protons (Bernardi et al., 1992; Javadov et al., 2017).
Mi-tochondrial PTP opening can occur in low-conductance (physiologic) and high-conductance (pathologic) modes [Reviewed in (Brenner and Moulin, 2012; Kwong and Molkentin, 2015)]. The PTPflickering in the low-conductance mode increases permeability to solutes ≤300 Da, mostly ions, and induces negligible matrix swelling (Ichas and Mazat, 1998). The volume-induced increases in the IMM permeability over the physiological range stimulate ETC activity, ATP production, fatty acid oxidation, and other metabolic processes (Halestrap, 1994; Scalettar et al., 1991). Also, low-conductance PTPs initiate mitochondrial depo-larization spikes and generate Ca2+waves from one mitochondrion to
another caused by Ca2+-induced Ca2+release (Ichas et al., 1997). In
contrast, high-conductance PTPs allow unrestricted bi-directional movements of water and solutes ≤1500 Da across the IMM accom-panied by increased ROS production, ΔΨmloss, uncoupled oxidative
phosphorylation, and ATP hydrolysis (Bernardi and Di Lisa, 2015; Halestrap et al., 1998; Javadov et al., 2009). Excessive matrix swelling causes rupture of the OMM and release of pro-apoptotic proteins (e.g., cytochrome c) into the cytoplasm (Petronilli et al., 2001), although the relative contribution of apoptosis and necrosis to cellular death depends on the ATP level in the cell.
Despite many studies, the mechanisms underlying the MS dynamics remain poorly known. One of the main challenges in understanding the mechanisms of MS is the lack of knowledge of the molecular identity of the PTP complex. Although voltage-dependent anion channel (porin), adenine nucleotide translocase, and phosphate carrier were initially proposed as the PTP core components, subsequent genetic studies de-monstrated that pore opening still occurs in the absence of these pro-teins, suggesting that they are not involved in the PTP structure (re-viewed in (Bernardi and Di Lisa, 2015; Halestrap and Richardson, 2015; Javadov et al., 2009)). Recent studies implicate F0F1-ATP synthase as a
structural component of the PTP (Carraro et al., 2019), although other studies challenge this conclusion (Carroll et al., 2019). Cyclophilin D has been shown as a major regulator of PTP and pharmacological in-hibition of cyclophilin D reduces pore opening and MS (Halestrap and Richardson, 2015; Javadov et al., 2017). Lack of knowledge on the molecular structure of the PTP complicates elucidation of the me-chanisms of PTP-induced MS in vitro and in vivo.
Simulations of MS coupled with the bioenergetic status of mi-tochondria by different modeling approaches can provide a powerful alternative to exhaustive experiments (Javadov et al., 2018). These models are particularly important for understanding the mechanisms of the transition of MS from a reversible to an irreversible state. Several in silico approaches have been used to develop biophysical and kinetic models for the MS dynamic analysis (Baranov et al., 2008; Bazil et al.,
2010b; Massari, 1996; Pokhilko et al., 2006; Selivanov et al., 1998). However, most of these models describe MS as a linear process, which is unable to reproduce irreversible MS or the transition from reversible to irreversible MS. Notably, there are fundamental differences between biophysical and kinetic models: biophysical models describe continuous mitochondrial dynamics depending on the initial conditions, whereas kinetic models describe the transition dynamics between well-defined discrete mitochondrial states. Therefore, additional modeling tools are required for joining these two theoretical approaches together.
In the present study, we attempted to upgrade and further develop our recent biophysical model for the description of the MS dynamics (Chapa-Dubocq et al., 2018; Makarov et al., 2018). The dynamics of the PTP opening probability in the current study is described by a first-order differential equation. This equation describes how the dynamics of the PTP opening probability depends on the matrix concentrations of Ca2+and H+. It illustrates the time evolution of the PTP opening status
and thus provides a more correct approach in comparison with the earlier discussed modeling approaches. One of the main factors reg-ulating the MS is the IMM rigidity, which may be described by the ri-gidity tensor. The IMM strain by osmotic pressure creates IMM me-chanical stress, which compensates the osmotic pressure in equilibrium conditions. The values of the rigidity tensor components were obtained fitting the upgraded model to the earlier reported experimental data. Using new values of the tensor components, we recalculated the time dependences of different system parameters, comparing the results to those reported earlier. The tensor components obtained in the present study significantly differ from our earlier estimates. The currently de-veloped and verified tools may be further applied to the analysis of the irreversible MS dynamics described by more complex biophysical models.
2. Model description
We have recently developed a biophysical model that describes MS based on i)ΔΨmdynamics, ii) ion transport through the PTP, iii)
dy-namics of the PTP opening probability and iv) nonlinear dydy-namics of MS (Makarov et al., 2018). The model took into consideration a limited number of ionic species (H+, K+, and Ca2+) as well as ion transport
mechanisms in the IMM including the PTP opening, among others. To further improve the previous model, presently we included afirst-order differential equation describing the dynamics of the PTP opening probability as a function of the Ca2+and H+ concentrations in the matrix. We shallfirst briefly clarify the differences between our current model, and previous models.
2.1. Ion transport across the IMM by ion exchangers and PTP
The ion transport through IMM is described by the Goldman equa-tion: = − = − − − − J J J p T C e C e ΔΨ 1 i iout iin i m iin iout zi e m kBT zi e m kBT | | ΔΨ | | ΔΨ (1) where piis the permeability coefficient for the i-th ionic species, which
includes the |e|/kB factor (Makarov et al., 2018), T is the absolute
temperature, kBis the Boltzmann constant, |e| is the absolute value of
the electron charge, Ciin/outis the i-th ionic species concentration inside
and outside of the matrix, respectively, and ziis the relative charge of
the i-th ionic species. Considering that PTP opening dynamics is de-scribed by the opening probability Top, Eq.(1)for ion transport through
PTP is modified as follows: = − = − − − − J J J T p T C e C e ΔΨ 1 iPTP iout iin op i m i in iout zi e m kBT zi e m kBT | | ΔΨ | | ΔΨ (2) Both Eqs.(1) and (2)were used for the description of ion transport
in our present model. Thus, the dynamic equation for the i-th ionic species transport may be represented as follows:
= + dC dt S t V t J J ( ) ( )( ) iin i iPTP (3) where S(t) is the time-dependent mitochondrial surface area and V(t) is its time-dependent volume. Note that the permeability coefficient pi
included in Eqs. (1)–(3)was calculated as pi= p’i/S(0), where the p’i
was the initial integral permeability coefficient of the IMM published earlier (Makarov et al., 2018). This representation of the permeability coefficients allowed describing the ion transport rates in the function of the IMM surface area, which was changed by swelling. Regarding the description for CH+inin our present model, Eq.(3)was complemented
with the Wresterm, describing H+generation due to respiration, and
took the form:
= + + + dC dt S t V t J J W ( ) ( )( ) H in i iPTP res (4) where respiration is described by the transformation of the re-spiration activator A. Rere-spiration also creates a weak acid, which dis-sociates and alters pH. The respiration activator dynamics is described by: = − dC dt W W Ain ox rem (5)
where CAinis the respiration activator concentration, Woxand Wremare
activator generation rate and its transformation rate into the weak acid AH, respectively. The dissociation of AH is given by AH↔ A−+ H+.
SinceΔΨmis directly coupled with the respiration dynamics, our
pre-sent model described the Woxgeneration rate as
⎜ ⎟ = ⎛ ⎝ − ⎞ ⎠ − Wox k CA Sin,0 1 e δ ΔΨ (ΔΨ ) m m (6) where kAis a phenomenological rate constant, CS,0inis the initial
sub-strate concentration and δ(ΔΨm) = 43.42 mV is the characteristic
parameter (Makarov et al., 2018).
2.2. ΔΨmdynamics
In the simplest case of modeling analysis, when the surface area of the ion exchanger channels and PTP were not included, and only average values of permeability coefficients were considered, the dy-namic equation forΔΨmmay be represented as follows:
∑
∑
= ⎡ ⎣ ⎢ + ⎤ ⎦ ⎥ d dt e S t C z J z J (ΔΨ ) | | ( ) m m i i i i i iPTP (7) where |e| is the absolute electron charge, ziis the relative charge of i-thionic species and Cmis theΔΨm.
2.3. Dynamics of PTP opening probability
We used the following equation to describe the PTP opening prob-ability: = − + + + + + dT dt k p T Ca k T H H k (ΔΨ )(1 )[ ] [ ] [ ] op op m op in cl op in in mPTP 2 (8) where p(ΔΨm) was given by:
=⎧ ⎨ ⎩ ≥ < − − p e e (ΔΨ) ; ΔΨ Ψ ; ΔΨ Ψ m m 2 2 m Ψ0 ΔΨ Ψ1 Ψ0 Ψ2 Ψ1 (9) where kPTP m = 3.2 × 10⁻⁵ mM, Ψ0= 110 mV, Ψ1= 20 mV,
Ψ2= 70 mV, kop= 2 min−1, and kcl= 100 min−1. The upgraded model
was analyzed numerically, and the results of the analysis are discussed
inSection 3.
2.4. Nonlinear mitochondrion dynamics
Our previous model of MS used a nonlinear description of swelling based on the osmotic pressure created by ionic disbalance between the matrix and cytosol (Makarov et al., 2018). The osmotic pressure was represented by the following equation:
∑
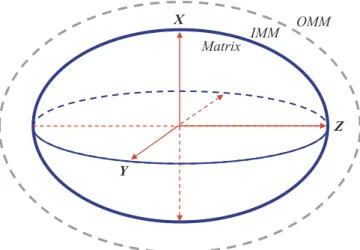
= − P k TN C C Δos B ( ) i iin outin (10) where N is the Avogadro number. The osmotic pressure inside the matrix induces MS, while the IMM strain compensates for the osmotic pressure in equilibrium conditions up to a certain limit, maintaining equilibrium: = P P Δoseq Δ IMM eq (11) whereΔPIMMis created by the IMM strain, which was described by therigidity tensor g. For mitochondria approximated by an ellipsoid of revolution (Fig. 1), the pressure created by the IMM strain was de-scribed as follows: = + P g r t g z t S t Δ 2 Δ ( ) Δ ( ) ( ) IMM zz m 0 (12) where the rigidity tensor components were defined as follows:
= − = = − + +
(
)
(
)
g g r x y g g 1 , 1 β r β r zz zz β z β z 0 00 Δ 1 Δ ,0 Δ 1 n n z n z n 0 1 0 1 1 1 (13) where Δr(t) = r(t) − a and Δz(t) = z(t) − c. The parameters g00,gzz,0,β0,βz, and n1describe the IMM rigidity and the surface area:
= + + = − + < + + + + +
(
)
(
)
S t π a r t f t f t a r t c z t ( ) 2 ( Δ ( )) 1 arcsin( ( )) ( ) 1 ; Δ ( ) Δ ( ) m ac r t fz t a r t c z t 2 Δ ( ) ( Δ ( )) Δ ( ) Δ ( ) 2 (14) and the volume of the IMM:= + +
V ( )t 4π a r t c z t
3 ( Δ ( )) ( Δ ( ))
m 2
(15) Irreversible MS would occur at large IMM strains when the regidity tensor components vanish. The equation for the MS dynamics should include waterfluxes into and out from the matrix. The water flux into the matrix is proportional to the osmotic pressure, while theflux out
Y
X
Z
OMM
IMM
Matrix
Fig. 1. Schematic representation of a mitochondrion approximated by an el-lipsoid for the model analysis of mitochondrial swelling.
from the matrix (IMS) is proportional to the pressure created by the IMM mechanical stress. The permeability constant pwfor water
trans-port is the same in both directions. Thus, the equation for the mi-tochondrion volume depending on the transported water volume may be represented as follows:
= −
dV
dt S t p( ) w(ΔPos ΔPIMM) (16)
Eq.(15)produces two coupled differential equations describing the dynamics of Δr and Δz. The equation for Δr may be rewritten in a spherically symmetric system as follows:
∑
⎜ ⎟ ′ = + ′ ⎡ ⎣ ⎢ − − ′ ′ + ′ ⎛ ⎝ − ′ ′ + ′ ′ ⎞ ⎠ ⎤ ⎦ ⎥ d r dt S t p π r r t k TN C t C t g r t π r r t β r t β r t (Δ ) ( ) 4 ( Δ ( )) ( ( ) ( )) 3 Δ ( ) 4 ( Δ ( )) 1 Δ ( ) 1 Δ ( ) w B i iin outin n n 0 2 00 0 2 0 0 1 1 (17) where r0 is the initial radius, Δr′ is the time-dependent IMM radialstrain, g′00is the rigidity constant of the spherical mitochondrion,β′0
and n1 are the parameters describing the IMM strain nonlinearity.
Numerical simulations were carried out for both ellipsoidal and sphe-rical mitochondria.
3. Results
Here we simulated the experimental data reported earlier and car-ried out detailed numeric simulations of the system parameter dy-namics at different initial conditions, comparing these results with the earlier reported numerical simulations (Makarov et al., 2018).
3.1. Experimental data simulation
To obtain the IMM rigidity tensor components, wefitted the ex-perimental data reported earlier by another group (Holmuhamedov et al., 1999) with the results of the present study (Fig. 2). Note that the biophysical model used forfitting is very limited as regards the number of variables. As thefitting procedure was applied simultaneously to two conjugated parameters (Ca2+ concentrations in the sarcoplasmic/en-doplasmic reticulum and in the matrix volume), and conscious of the model limitations, we optimized thefitting as much as possible. How-ever, thefitted curve inFig. 2b still deviates quite strongly from the experimental data. We expect that thefitting will produce better results with a more comprehensive model that would follow a larger number of ionic species. However, the presently used simple model estimated several of the essential parameters with an acceptable accuracy; these results were used in further numerical experiments.
Thefitting procedure produced the following values of the rigidity tensor components: g00= 0.008 ± 0.001 dyn/nm,
gzz,0= 0.0101 ± 0.0011 dyn/nm, β0= (1.6 ± 0.2) × 104 μm−n1,
βz= (1.8 ± 0.2) × 105 μm−n1 with n1= 4 for an ellipsoidal
mi-tochondrion, and g00= 0.0091 ± 0.0011 dyn/nm,
β0= (7.9 ± 0.7) × 104 μm−n1 and n1= 4 for a spherical
mitochon-drion. These values are significantly different from those estimated with our previous model (Makarov et al., 2018) and will be used in further analysis of the system dynamics. The estimated value of the water permeability pw was (3.1 ± 0.7) × 102 μl⋅min−1Pa−1μm−2, quite
close to the value estimated earlier. Next, we present the results of numerical simulations of different system parameters based on the es-timated values of the tensor components.
In our simple modeling approach mitochondria were approximated by a sphere or an axi-symmetric ellipsoid. However, the real mi-tochondrial structure is much more complex, and the size and shape of mitochondria change dynamically in vivo. It should be noted that
modeling analysis of any real biological systems requires certain ap-proximations that do not take into consideration all of the available factors and parameters. As a result, a theoretical model only partially reflects the real biological system (event), in particular, our model does not take into account the dynamics of a real mitochondrial structure. Therefore, it is very important to enhance the accuracy level of the used approximations. We carried outfitting of the experimental data using axi-symmetric ellipsoidal and spherically symmetric systems, and our parameter values describing mechanical IMM properties do not dra-matically differ from the real parameters. Consequently, we may expect that in conditions, when MS is developed, the used approximation re-mains acceptable for the analysis of reversible and irreversible MS, and can predict mitochondrial behavior in different conditions with a cer-tain degree of accuracy. It should be noted that significant progress in adjusting the modeling analysis to reality may be obtained by the model upgrade that would take into account an extended set of factors af-fecting the system dynamics. Further studies should be extended to more complete biophysical models, where a mitochondrion is re-presented by a non-axi-symmetric ellipsoid, and an extended set of ions and processes is included. This would permit a better description of the real mitochondrion geometry. Thus, our current work is thefirst step to developing more realistic modeling tools.
3.2. Numerical analysis of mitochondrial dynamics
Thus, in the present model, we used the new values of the rigidity Fig. 2. (a) Mitochondrial uptake dynamics of [Ca2+]. (b) Fitting of the
mi-tochondrial swelling data. The initial cytosol [Ca2+] = 300 µM. See the text for
tensor components and provided a better description of the PTP opening dynamics, as given by Eq.(8). We modeled the dynamics of the most important system parameters, including ΔΨm, pH, ζ = Vm(t)/
Vm,0− 1 and Top, with the following initial conditions:
ΔΨm0= 200 mV, [K+]ext0= 0.1μM, [K+]in0= 0μM, [Ca2+]ext0= 1.0
and 500μM, [Ca2+]in
0= 0.5μM, pHext0= 7.0 and pHin0= 6.0. Here,
Vm,0and Vm(t) are the initial and current values of the mitochondrial
volume, respectively. Our main objective is to improve our modeling tools; therefore, we analyzed the MS dynamics only for the initial conditions listed above. The currently reported modeling tools may be used in conjunction with more comprehensive biophysical models that would include transport of a larger set of ionic and neutral species across the IMM. On the other hand, we were testing the results of the current model against those of our previous developments, to evaluate the currently achieved improvements. Such an analysis provided in-dications for future improvements of the tools describing the nonlinear MS dynamics.
Since the mitochondrial dimensions vary significantly between biological species and cell types, our model analysis specifically targets mitochondria of the adult rat cardiomyocytes. We implemented the numerical model in a homemade FORTRAN code, with the input parameter values listed in Table 1. The numerical calculations were performed for [Ca2+] = 1.0 and 500μM in the sarco/endoplasmic
re-ticulum, using the same initial concentrations of all of the other species. In the next section, we present the results of the numeric simulations.
It should be noted that we did not analyze the model of MS for different mitochondrial subpopulations in the current study. Note that there are three spatially distinct mitochondrial subpopulations in cells: subsarcolemmal, intermyofibrillar, and perinuclear mitochondria. Subsarcolemmal and intermyofibrillar mitochondria are mostly dis-cussed in cardiac and skeletal muscle cells. These subpopulations de-monstrate distinct functional and structural characteristics (Hollander et al., 2014; Kuznetsov and Margreiter, 2009) including different sen-sitivities to Ca2+(Palmer et al., 1986), among others. In addition, sex and age differences in the sensitivity to Ca2+were observed in cardiac
mitochondria (Arieli et al., 2004). More detailed and complex models for different mitochondrial subpopulations depending on sex and age could be developed by upgrading the current simple model that would precisely predict MS dynamics of mitochondria in spatially distinct subcellular compartments in male and female mitochondria at a given point of the lifespan.
4. Numerical analysis
4.1. Dynamics of MS
We simulated the dynamics ofΔΨm, pH,ζ and Topfor an ellipsoidal
mitochondrion using the same initial geometrical parameter values, where a = 0.5μm, c = 1 μm (see Eqs.(13)) and the effective ratio of the cell volume to the mitochondrion volume is 2.86 (Song et al., 2013). We compared these results with the previously reported data, which led us to the following conclusions (Fig. 3): i) the pH dynamics has not changed significantly; ii) the dynamics of the PTP opening probability has changed weakly for [Ca2+]ext
0= 500μM, disappearing at longer
times; iii) theΔΨmdynamics has changed weakly; the difference
ob-served between the two calculations for [Ca2+]ext0= 500μM
appar-ently originates in theΔΨm– dependent parameter, p(ΔΨm), and iv) the
matrix volume dynamics for low [Ca2+] has changed significantly, with
the difference once more attributable to the p(ΔΨm), whereas no
significant changes in the matrix volume dynamics were apparent at higher [Ca2+]. We, therefore, conclude that the upgraded model de-scribes the matrix swelling better than the earlier reported model (Makarov et al., 2018), as it provides a more precise description of the rigidity tensor component values and the PTP opening probability dy-namics.
To better understand the results obtained using the upgraded model, we represented the differences between the current and our earlier reported data (Makarov et al., 2018) inFig. 4.Fig. 4a demonstrates such difference for the matrix pH at [Ca2+]ext
0of 1.0 and 500μM. For
both Ca2+concentrations, the difference has a long period of oscilla-tions (~500 s), which may be assigned to a better description of the mitochondrion state dynamics using Eq.(8). Notably, the amplitude of the difference in both cases is around 0.6, which is sufficient to affect the PTP opening dynamics. The difference in the PTP opening prob-ability shown inFig. 4b demonstrates decaying oscillations. Interesting effects can be seen in the differences for ΔΨm(Fig. 4c), where stable
oscillations with the oscillation period of about 64 s are observed for [Ca2+] = 1μM. This value is practically the same as observed for the
PTP opening dynamics. In this case, we can suggest that in both cases the observed effects may be apparently assigned to the same reasons for low Ca2+ (ΔΨ
m) and high Ca2+ (PTP opening). However, at
[Ca2+] = 500μM, ΔΨ
mdifference shows low-frequency decaying
os-cillations with an oscillation period of about 170 s. The volume dy-namics differences show stable oscillations with the oscillation period of about 110 s at low Ca2+(Fig. 4d), while at high Ca2+, the difference
demonstrates a peak with the maximum at around 277 s and the width of about 210 s. All of the observed effects in the parameter difference dynamics result from the better description of the PTP opening prob-ability. Note that these effects are even observable at low Ca2+.
The differences between the current and the previous data on the PTP opening probability dynamics are shown in Fig. 3b. A detailed representation of the PTP opening probability dynamics shown in this figure for [Ca2+
]0out= 500μl is given inFig. 5. Note the regular
os-cillations with the period of ca. 37.9 s, which were quite unexpected in conditions leading to irreversible MS. The initial oscillation amplitude is about 0.031, and it decays with time, with the time constant of the exponential decay function of ca. 287 s. This effect should be caused by Ca2+ uptake by the mitochondria, which occurred with a similar
characteristic time, i.e. while the matrix Ca2+was below the critical level, the system was still controlling the PTP opening dynamics. However, the respective oscillation amplitude was only 3%, and di ffi-cult to detect experimentally. Therefore, the existence of such oscilla-tions could be tested in numerical experiments, using comprehensive biophysical models with nonlinear MS description. Provided these models were able to reproduce such oscillations, we would gain a better understanding of the role of different interactions, leading to better modeling of the mitochondrial dynamics in different conditions. 4.2. The [Ca2+]
0outdependences of theΔΨm, pH,ζ and Topparameter
values at t→ ∞
In practical terms, we found that at t > 5750 s the parameter va-lues were not changing anymore, equivalent to t→ ∞ for the simula-tion with [Ca2+]
0out= 20μM performed over a long-time interval. The
same happens at shorter times for higher [Ca2+]0out,values. Thus, we
conclude that for [Ca2+]
0out≥ 20 μM, the parameter values become
quasi-stationary at t = 6000 s. Therefore, all of the model results pre-sented in this section refer to t = 6000 s. In this set of numerical
Table 1
Parameter values used in the current numerical analysis.
CK+,0outμM pHout pHin CAH,0outμM δ(Δψm) mV CA,0inμM kAmin−1 kA,H+min−1
experiments, [Ca2+]0outwas varied in the [20,500]μM interval with
the step of 20μM (Fig. 6).
As shown inFig. 6a, the matrix pH increases with the increase of [Ca2+]
0out, passing through the maximum value of about 7.43 located
at intermediate [Ca2+]0outvalues, and achieves the steady-state value
of about 7.17 in the irreversible swelling range. The pH maximum, located at [Ca2+]
0outvalues, corresponds to the conditions when the
mitochondrial dynamics is strongly dependent on the PTP regulation,
with reversible PTP opening dynamics.Fig. 6b and 6c show the de-pendence of ΔΨm, and PTP opening probability on [Ca2+]0out. Both
curves are smooth and have three distinct ranges in terms of [Ca2+] 0out:
i) 0 to 200μM, where ΔΨmdoes not change and PTPs are closed; ii) 200
to 350μM, where both parameters of interest vary dramatically, and iii) 350 to 500μM, where ΔΨmis close to zero, while the probability of PTP
opening is close to 1. Based on this analysis, we conclude that the in-termediate [Ca2+]0outrange corresponds to the active PTP regulation in
Fig. 3. Dynamics of (a) matrix pH, (b) probability of PTP opening, (c) and (d)ΔΨm, (e) and (f) matrix volume at [Ca2+]ext0= 1.0 µM (black lines) and 500 µM (red
lines). Dashed lines: our earlier reported data (Makarov et al, 2018) and solid lines: data from the current study. (For the interpretation of the references to colour in thisfigure legend, the reader is referred to the web version of this article.)
the mitochondrion.Fig. 6d shows mitochondrial volume behavior as a function of [Ca2+]
0out, where the relative volume increases up to the
maximum value of 0.31 at around 243μM of [Ca2+]
0out. Then the
re-lative volume decreases to a constant value of about 0.17 with a further increase of [Ca2+]
0out. This should be caused by the irreversible
swel-ling that eventually reduces the mitochondrial volume, apparently due to a strong efflux of water from the matrix through the PTP. The data analyzed in this section allow us to conclude that the behavior of the simulated mitochondrial parameters (matrix pH, ΔΨm, PTP opening
probability, and matrix volume) as a function of [Ca2+]0outis quite
reasonable.
The results presented inFig. 6a demonstrate that pH is about 7.17 and the relative mitochondrial volume is about 0.17 at high [Ca2+]. The maximum matrix pH is around 9.4 and drops to about 7.17 at an infinite time for 500 μM Ca2+ in the sarco/endoplasmic reticulum
(Fig. 3a). Thus, matrix pH asymptotically approaches the value of 7.17 on this time scale. The same is apparent for the data shown inFig. 6d, where the relative mitochondrial volume asymptotically approaches 0.17. To test these conclusions, we calculated the relative volume dy-namics in the extended time range of [0; 6000] s. Both dependencies presented inFig. 7a and b show that the system arrives to an almost steady state t > 3000 s, with the asymptotic values of 7.17 and 0.17 for pH and the relative mitochondrial volume, respectively.
5. Discussion
Currently, the existing experimental approaches have a limited ability to produce precise in silico models that describe the mechanisms of the MS dynamics in vivo. Besides, existing experimental data on the MS were obtained using a wide spectrum of techniques, experimental conditions, and tissue sources. This compromises a correct interpreta-tion of the results and the development of a general model of MS. The changes in the influx and efflux mechanisms across the IMM for a broad range of ions and solutes, along with the physicochemical parameters of mitochondria such asΔΨm, PTPflickering, membrane rigidity, matrix
colloidal osmotic pressure, and others, all should be monitored si-multaneously. The latter approach can track more accurately the dy-namics of the MS and the transition of mitochondria from a reversible to an irreversible state. A quantitative biophysical model would be very helpful in the interpretation of the experimental data, with the model parameters evaluated by simulation of the experimental results.
The MS generates mechanical stress in the IMM determined by the IMM strain and membrane rigidity, in response to the high colloid-os-motic pressure in the matrix. Large IMM strains during severe (patho-logical) MS stimulate mechanical degradation, inducing mitochondrial and cellular death. A wide range of biophysical modeling approaches was applied in previous studies that described the MS as a reversible linear process (Baranov et al., 2008; Bazil et al., 2010b; Massari, 1996; Pokhilko et al., 2006; Selivanov et al., 1998). The earlier discussed Fig. 4. Current and reported data differences: (a) Dynamics of the matrix pH difference; (b) probability of PTP opening difference; (c) ΔΨmdifference; (d) matrix
volume difference: [Ca2+]ext
0= 1.0 (black lines) and 500 (red lines)μM. (For the interpretation of the references to colour in this figure legend, the reader is referred
model described reversible MS dynamics, considered in the linear ap-proximation, and represented by the expression:
∑
= − = dV dt λS RT ρ (C C ) 0 m m H O iin iout 2 (18)whereλ is the IMM permeability for water, Smis the IMM outer surface
area, R is the gas constant, T is the absolute temperature,ρH2Ois water
density, Ciinand Cioutare the matrix and sarco/endoplasmic reticulum
concentrations of the i-th solute species. The last relationship does not consider the IMM rigidity and the mechanical stress developed in the IMM when it is strained. According to Eq.(18), MS is only complete if ∑(Ciin−Ciout)=0. On the other hand, such a model takes into account only the osmotic pressure factor. This approach is generally insufficient, as it enters in contradiction with the physical equilibrium concept re-quiring the osmotic pressure acting on an elastic membrane permeable to water to be compensated by the membrane stress forces. Let us consider an example where a mitochondrial matrix containing known concentrations of different ions is placed into a chamber with pure water, with the volume of water much larger than the mitochondrial volume. According to Eq. (18), we would expect MS continuing in-finitely, as the ionic concentrations remain always higher inside the matrix as compared to outside. Thus, Eq.(18)will produce an appar-ently meaningless result. Therefore, we need a water outflow, which could be induced by negative osmotic pressure (negative terms under the sum in Eq.(18)), and/or by the pressure created by the mechani-cally strained IMM due to its nonzero rigidity. Assuming equilibrium conditions, the positive sum in Eq.(18)producing an osmotic pressure
and a water inflow should be compensated by the water outflow in-duced by the IMM stress. Note that modeling analysis based on Eq.(18) is described as linear MS, where the rate of mitochondrial volume change is linearly dependent on the osmotic pressure. On the other hand, a linear MS model may be described by Eq.(16)for small IMM strains, where the pressure created by IMM strain is linearly dependent on the strain. It should also be noted that the model represented by Eq. (18)cannot reproduce irreversible MS or simulate the IMM degradation dynamics. As discussed above, the IMM rigidity tensor components defined for an ellipsoidal mitochondrion were represented by Eq.(13), where the nonlinearity of the IMM rigidity was modeled by the fol-lowing expressions: = − + = − + g g β r β r g g β z β z Δ Δ 1 Δ ; Δ Δ 1 n n zz zz z n z n 0 00 0 0 ,0 1 1 1 1 (19)
where the parameter values were determined byfitting the model to the experimental data (see above). The functional form of Eq.(19)was chosen so that the rigidity tensor components would vanish asympto-tically at large strains, modeling irreversible swelling. This functional form was chosen based on the ideas of the material resistance theory (Pelleg, 2013). Naturally, an asymptotically vanishing rigidity at large IMM strains implies physical disruption of the IMM, describing irre-versible (pathological) MS. The analysis of the presently upgraded model improved the estimates of the parameters describing the IMM rigidity. Further studies are required to introduce an irreversible MS description into the general biophysical model that had been analyzed earlier (Bazil et al., 2010a,b; Pokhilko et al., 2006).
In the current study, we estimated the values of the phenomen-ological rigidity tensor components. It is important to examine the origins of these phenomenological parameters within the IMM struc-ture. The IMM has a very high protein-to-phospholipid ratio (> 3:1 by weight, which is about 1 protein molecule for 15 phospholipids). Since the detailed structure of the IMM is still under intensive investigation, it is difficult to interpret a certain IMM structure in terms of the rigidity tensor component values. We assume that it is possible to simulate an optimized IMM structure using the Monte Carlo method. In this case, binary interaction potentials between phospholipids and proteins of IMM may be determined. Then, we may use the generalized interaction potential, obtained for the optimized IMM structure, in order to cal-culate the macroscopic rigidity parameters of the IMM. This analysis should take into consideration the well-known effects of different bio-molecules on the IMM rigidity. For example, the cholesterol-to-phos-pholipid molar ratio affects the rigidity of the membrane. The presently reported upgraded model produced significant deviations in the ΔΨm
dynamics in comparison with the results obtained in the earlier version (Makarov et al., 2018) at the sarco/endoplasmic reticulum [Ca2+]
0out= 500μM. These deviations can be explained by the
feed-back coupling between the TopandΔΨmparameters. Apparently,
si-milar reasoning may be used to explain significant differences in the mitochondrial volume dynamics observed between the two models (Fig. 3e).
Note that the effects of mechanic stress on the IMM behavior were ignored in the previous models, and different system parameters have been reported to oscillate in physiological conditions (Selivanov et al., 1998), although the respective oscillations were quite different from those presently observed. Apparently, such differences may be attrib-uted to the diverse descriptions of the MS dynamics. Another reason could be the different forms of the master equation used in the re-spective models. Not that most every one of the earlier models used the dynamic equations in the form WX= JX, without expressing theflux JX
of the species X in the function of S(t)/V(t). Here WXis the rate of the
matrix concentration change of the species X, and S(t) and V(t) are the time-dependent mitochondrial surface area and volume, respectively. Such factorization was used in our analysis, that used time dependence of the permeability coefficients for the species X in the form pX(S(t)/S
Fig. 5. Oscillations observed in the numerically simulated time dependence of Topat initial sarco/endoplasmic reticulum [Ca2+] = 500μM: (a) initial 0–85 s
(t = 0)). Thus, although the reduced permeability coefficient pX/S
(t = 0) remains constant, the species water flux in/out of the matrix varies due to changes in the IMM surface area, S(t).
Notably, in addition to the extent of osmosis in the matrix and cy-toplasm, physical properties of the IMM including itsfluidity, rigidity (stiffness), thickness, and permeability also play an important role in the MS process. There are several factors that may affect the physical properties of the membrane. The most important factor, as was already noted, is the cholesterol-to-phospholipid molar ratio (Shinitzky and Barenholz, 1978). Cholesterol increases the rigidity of the membrane fluid phase, thus the reduction of cholesterol content reduces the membrane rigidity. In contrast, phospholipids increase membrane fluidity and thus reduce its rigidity (Crockett et al., 2001; Wodtke, 1978). Therefore, an increased cholesterol-to-phospholipid ratio should increase the IMM resistance to swelling due to its higher rigidity. In contrast, decreased cholesterol to phospholipid ratio should reduce the membrane rigidity and facilitate its swelling. In addition, fatty acid composition and protein-to-lipid ratio may also affect the IMM physical properties and thus change its response to osmotic gradients. For in-stance, the specific molecular volume created by phospholipids may vary depending on the saturation and length of acyl groups, which can affect the close packing of phospholipids. Phospholipids containing longer acyl groups will enhance chain-to-chain interactions between fatty acids and thus reduce the membrane fluidity (Ladbrooke and Chapman, 1969). Thus, the IMM physical properties are dependent on a variety of factors, which warrants detailed experimental and theoretical analysis in order to relate the IMM composition and structure with its rigidity parameters.
It should be noted that the results offitting analysis shown inFig. 2b demonstrate high accuracy of the experimental data fitting. The average deviation of thefitting curve from the set of experimental data points is around 10%. We expect thatfitting results can be improved by developing an upgraded biophysical model that would take into ac-count an extended set of parameters. Future comprehensive modeling analysis of MS will be useful for understanding the molecular identity of the PTP complex and the dynamics of pore opening. In the present model, we made certain progress by taking into consideration the me-chanical properties of the IMM. In particular, the estimated values of the IMM rigidity were obtained byfitting of the earlier reported ex-perimental data. These estimated values give a key to the modeling of the IMM organization and to the structural identity of the PTP.
6. Conclusions
In the current study, we upgraded and further developed our pre-vious biophysical model of MS (Makarov et al., 2018). It should be noted that the upgraded model produced better estimates for the components of the IMM rigidity tensor, as evidenced by betterfits of the present model to the previous experimental data. The new estimates of the IMM rigidity tensor components used in numerical experiments produced significant differences in the mitochondrial behavior in comparison to the earlier reported results. We conclude that the up-graded model produces a better description of the irreversible MS dy-namics than the models developed previously. New tools developed and tested in the current study should be further applied for the analysis of irreversible MS. This will result in a more comprehensive model of MS Fig. 6. Dependences on [Ca2+]
reproducing various physiological and pathological conditions, by taking into consideration fluxes of a large spectrum of ionic species across the IMM and physicochemical parameters of mitochondria. Thus, the current study reports a significant step in the development and testing of the irreversible MS tools and their further application.
7. Limitations of the study
The modeling approach explored in the present study is limited by the simplified treatment of the biophysical and chemical processes, including transport of only three ionic species and a simplified re-spiration mechanism. In addition to the limited number of parameters, the model did not take into consideration the differences between the distinct spatial subpopulations of mitochondria as well as sex- and age-related differences. However, more complex and comprehensive models of MS may be developed in future on the basis of the current model, using more sophisticated modeling approaches.
Declaration of Competing Interests
The authors declare that they have no known competingfinancial interests or personal relationships that could have appeared to influ-ence the work reported in this paper.
Acknowledgments
This study was supported by the USA NIGMS NIH (Grant
SC1GM128210) to S.J. and by the Institute for Functional Nanomaterials (USA NSF Grant 1002410) and PR NASA EPSCoR (USA NASA Cooperative Agreement NNX15AK43A) to V.M.
References
Arieli, Y., Gursahani, H., Eaton, M.M., Hernandez, L.A., Schaefer, S., 2004. Gender modulation of Ca(2+) uptake in cardiac mitochondria. J. Mol. Cell. Cardiol. 37, 507–513.
Baranov, S.V., Stavrovskaya, I.G., Brown, A.M., Tyryshkin, A.M., Kristal, B.S., 2008. Kinetic model for Ca2+-induced permeability transition in energized liver mi-tochondria discriminates between inhibitor mechanisms. J. Biol. Chem. 283, 665–676.
Bazil, J.N., Buzzard, G.T., Rundell, A.E., 2010a. A bioenergetic model of the mitochon-drial population undergoing permeability transition. J. Theor. Biol. 265, 672–690.
Bazil, J.N., Buzzard, G.T., Rundell, A.E., 2010b. Modeling mitochondrial bioenergetics with integrated volume dynamics. PLoS Comput. Biol. 6, e1000632.
Beavis, A.D., Brannan, R.D., Garlid, K.D., 1985. Swelling and contraction of the mi-tochondrial matrix. I. A structural interpretation of the relationship between light scattering and matrix volume. J. Biol. Chem. 260, 13424–13433.
Bernardi, P., 1999. Mitochondrial transport of cations: channels, exchangers, and per-meability transition. Physiol. Rev. 79, 1127–1155.
Bernardi, P., Di Lisa, F., 2015. The mitochondrial permeability transition pore: molecular nature and role as a target in cardioprotection. J. Mol. Cell. Cardiol. 78, 100–106.
Bernardi, P., Vassanelli, S., Veronese, P., Colonna, R., Szabo, I., Zoratti, M., 1992. Modulation of the mitochondrial permeability transition pore. Effect of protons and divalent cations. J. Biol. Chem. 267, 2934–2939.
Brenner, C., Moulin, M., 2012. Physiological roles of the permeability transition pore. Circ. Res. 111, 1237–1247.
Carraro, M., Checchetto, V., Szabo, I., Bernardi, P., 2019. F-ATP synthase and the per-meability transition pore: fewer doubts, more certainties. FEBS Lett. 593, 1542–1553.
Carroll, J., He, J., Ding, S., Fearnley, I.M., Walker, J.E., 2019. Persistence of the perme-ability transition pore in human mitochondria devoid of an assembled ATP synthase. Proc. Natl. Acad. Sci. U.S.A. 116, 12816–12821.
Chapa-Dubocq, X., Makarov, V., Javadov, S., 2018. Simple kinetic model of mitochondrial swelling in cardiac cells. J. Cell. Physiol. 233, 5310–5321.
Crockett, E.L., Dougherty, B.E., McNamer, A.N., 2001. Effects of acclimation temperature on enzymatic capacities and mitochondrial membranes from the body wall of the earthworm Lumbricus terrestris. Comp. Biochem. Physiol. B: Biochem. Mol. Biol. 130, 419–426.
Giorgi, C., Marchi, S., Pinton, P., 2018. The machineries, regulation and cellular functions of mitochondrial calcium. Nat. Rev. Mol. Cell Biol. 19, 713–730.
Griffiths, E.J., 2009. Mitochondrial calcium transport in the heart: physiological and pathological roles. J. Mol. Cell. Cardiol. 46, 789–803.
Halestrap, A.P., 1994. Regulation of mitochondrial metabolism through changes in matrix volume. Biochem. Soc. Trans. 22, 522–529.
Halestrap, A.P., Kerr, P.M., Javadov, S., Woodfield, K.Y., 1998. Elucidating the molecular mechanism of the permeability transition pore and its role in reperfusion injury of the heart. BBA 1366, 79–94.
Halestrap, A.P., Quinlan, P.T., Whipps, D.E., Armston, A.E., 1986. Regulation of the mitochondrial matrix volume in vivo and in vitro. The role of calcium. Biochem. J. 236, 779–787.
Halestrap, A.P., Richardson, A.P., 2015. The mitochondrial permeability transition: a current perspective on its identity and role in ischaemia/reperfusion injury. J. Mol. Cell. Cardiol. 78, 129–141.
Hollander, J.M., Thapa, D., Shepherd, D.L., 2014. Physiological and structural differences in spatially distinct subpopulations of cardiac mitochondria: influence of cardiac pathologies. Am. J. Physiol. Heart Circ. Physiol. 307, H1–H14.
Holmuhamedov, E.L., Wang, L., Terzic, A., 1999. ATP-sensitive K+ channel openers prevent Ca2+ overload in rat cardiac mitochondria. J. Physiol. 519 (Pt 2), 347–360.
Hoppe, U.C., 2010. Mitochondrial calcium channels. FEBS Lett. 584, 1975–1981.
Ichas, F., Jouaville, L.S., Mazat, J.P., 1997. Mitochondria are excitable organelles capable of generating and conveying electrical and calcium signals. Cell 89, 1145–1153.
Ichas, F., Mazat, J.P., 1998. From calcium signaling to cell death: two conformations for the mitochondrial permeability transition pore. Switching from low- to high-con-ductance state. BBA 1366, 33–50.
Javadov, S., Chapa-Dubocq, X., Makarov, V., 2018. Different approaches to modeling analysis of mitochondrial swelling. Mitochondrion 38, 58–70.
Javadov, S., Jang, S., Parodi-Rullan, R., Khuchua, Z., Kuznetsov, A.V., 2017. Mitochondrial permeability transition in cardiac ischemia-reperfusion: whether cy-clophilin D is a viable target for cardioprotection? Cell. Mol. Life Sci. 74, 2795–2813.
Javadov, S., Karmazyn, M., Escobales, N., 2009. Mitochondrial permeability transition pore opening as a promising therapeutic target in cardiac diseases. J. Pharmacol. Exp. Ther. 330, 670–678.
Kirichok, Y., Krapivinsky, G., Clapham, D.E., 2004. The mitochondrial calcium uniporter is a highly selective ion channel. Nature 427, 360–364.
Kuznetsov, A.V., Margreiter, R., 2009. Heterogeneity of mitochondria and mitochondrial function within cells as another level of mitochondrial complexity. Int. J. Mol. Sci. 10, 1911–1929.
Kwong, J.Q., Molkentin, J.D., 2015. Physiological and pathological roles of the mi-tochondrial permeability transition pore in the heart. Cell Metab. 21, 206–214.
Ladbrooke, B.D., Chapman, D., 1969. Thermal analysis of lipids, proteins and biological membranes. A review and summary of some recent studies. Chem. Phys. Lipids 3, 304–356.
Fig. 7. (a) Matrix pH dynamics and (b) matrix volume dynamics, all at [Ca2+]
Lehninger, A.L., 1959. Reversal of various types of mitochondrial swelling by adenosine triphosphate. J. Biol. Chem. 234, 2465–2471.
Lopez-Crisosto, C., Pennanen, C., Vasquez-Trincado, C., Morales, P.E., Bravo-Sagua, R., Quest, A.F.G., Chiong, M., Lavandero, S., 2017. Sarcoplasmic reticulum-mitochondria communication in cardiovascular pathophysiology. Nat. Rev. Cardiol. 14, 342–360.
Makarov, V.I., Khmelinskii, I., Javadov, S., 2018. Computational modeling of in vitro swelling of mitochondria: a biophysical approach. Molecules 23.
Massari, S., 1996. Kinetic analysis of the mitochondrial permeability transition. J. Biol. Chem. 271, 31942–31948.
O'Rourke, B., 2007. Mitochondrial ion channels. Annu. Rev. Physiol. 69, 19–49.
Palmer, J.W., Tandler, B., Hoppel, C.L., 1986. Heterogeneous response of subsarcolemmal heart mitochondria to calcium. Am. J. Physiol. 250, H741–H748.
Pelleg, J., 2013. Mechanical properties of materials.
Petronilli, V., Penzo, D., Scorrano, L., Bernardi, P., Di Lisa, F., 2001. The mitochondrial permeability transition, release of cytochrome c and cell death. Correlation with the duration of pore openings in situ. J. Biol. Chem. 276, 12030–12034.
Pokhilko, A.V., Ataullakhanov, F.I., Holmuhamedov, E.L., 2006. Mathematical model of mitochondrial ionic homeostasis: three modes of Ca2+ transport. J. Theor. Biol. 243,
152–169.
Scalettar, B.A., Abney, J.R., Hackenbrock, C.R., 1991. Dynamics, structure, and function are coupled in the mitochondrial matrix. Proc. Natl. Acad. Sci. U.S.A. 88, 8057–8061.
Selivanov, V.A., Ichas, F., Holmuhamedov, E.L., Jouaville, L.S., Evtodienko, Y.V., Mazat, J.P., 1998. A model of mitochondrial Ca(2+)-induced Ca2+ release simulating the Ca2+ oscillations and spikes generated by mitochondria. Biophys. Chem. 72, 111–121.
Shinitzky, M., Barenholz, Y., 1978. Fluidity parameters of lipid regions determined by fluorescence polarization. BBA 515, 367–394.
Song, D.H., Park, J., Maurer, L.L., Lu, W., Philbert, M.A., Sastry, A.M., 2013. Biophysical significance of the inner mitochondrial membrane structure on the electrochemical potential of mitochondria. Phys. Rev. E: Stat. Nonlinear Soft Matter Phys. 88, 062723.
Szabo, I., Zoratti, M., 2014. Mitochondrial channels: ionfluxes and more. Physiol. Rev. 94, 519–608.
Wodtke, E., 1978. Lipid adaptation in liver mitochondrial membranes of carp acclimated to different environmental temperatures: phospholipid composition, fatty acid pat-tern and cholesterol content. BBA 529, 280–291.
![Fig. 7. (a) Matrix pH dynamics and (b) matrix volume dynamics, all at [Ca 2+ ] 0 out = 500 μ M.](https://thumb-eu.123doks.com/thumbv2/123dok_br/18659798.913053/10.892.62.424.83.635/fig-matrix-ph-dynamics-matrix-volume-dynamics-ca.webp)
