LEVAN PRODUCTION BY
Zymomonas mobilis
ANALYZED BY
THE SURFACE RESPONSE METHOD
1Raquel Renan Jorge BORSARI
2, Maria Antonia P. Colabone CELLIGOI
2,*,
João Batista BUZATO
2, Rui Sérgio dos Santos Ferreira da SILVA
3SUMMARY
The aim of this study is to assess sugar cane juice and sucrose as substrates, the batch and fed batch processes and their interaction in the levan production using a complete factorial design. Zymomonas mobilis was cultivated in different sugar cane juice and sucrose concentrations in two fermentation processes at 25 °C for 20 h. A complete factorial design (23) was used to analyze the effects of the
type and concentration of the substrate, as well as the batch and fed batch processes. A complete second factorial design (22) was used
to observe the importance of sugar cane juice. The results indicated that the batch process improved the levan production reaching 40.14 g/L. The addition of sugar cane juice was not statistically significant for levan formation, however sugar cane juice stimulated biomass, sorbitol and ethanol production. The best medium for levan production was 150 g/L sucrose in batch.
Keywords: batch, factorial design, fed batch, sucrose, sugar cane juice.
RESUMO
INFLUÊNCIA DA FONTE DE CARBONO E DO PROCESSO FERMENTATIVO NA PRODUÇÃO DE LEVANA POR Zymomonas mobilis ANALISADA PELA METODOLOGIA DE SUPERFÍCIE DE RESPOSTA . O presente estudo avaliou caldo de cana de açúcar e sacarose como substratos e os processos batelada e batelada alimentada e suas interações na produção de levana. Zymomonas mobilis foi cultivada em diferentes concentrações de caldo de cana de açúcar e sacarose nos dois processos fermentativos a 25 °C por 20 h. Foi utilizado um delineamento fatorial completo (23) para analisar os efeitos do tipo e concentração de substratos e processos batelada e batelada alimentada. Um segundo delineamento fatorial completo (22) foi usado para confirmar a importância do caldo de cana de açúcar. Os resultados indicam que o processo batelada foi o melhor para a produção de levana, atingindo 40,14 g/L em 150 g/L de sacarose. A adição de caldo de cana de açúcar não foi estatisticamente significativa para formação de levana, porém o caldo estimulou a produção de biomassa, sorbitol e etanol.
Palavras-chave: batelada, batelada alimentada, caldo de cana de açúcar, delineamento fatorial, sacarose.
1 - INTRODUCTION
Levan is a fructose exopolysaccharide produced by mi-croorganisms as an energy reserve and defense. It presents low viscosity, high solubility in water, biocompatibility [15] as well as other properties that can have industrial applica-tions such as an hypocholesterolemic agent [34], an immune modulator agent, an antitumour activity [35], an anti-in-flammatory activity [32] and a blood plasma substitute and extender [21]. In the food industry, it is used as a fructose source and for the production of fructooligosaccharides [18], thickeners, stabilizers, encapsulating agents, flavors and aroma carriers as well as a color fixer [7, 3].
Zymomonas mobilis is a strictly fermentative, gram nega-tive and ethanologenic bacteria that ferments only glucose, fructose and sucrose with by-product formation [30]. The growth in sucrose is followed by extra-cellular formation of fructo-oligomers and levan catalyzed by the levansucrase
enzyme that hydrolyzes the sucrose and polymerizes the fructose in levan, significantly reducing the ethanol for-mation [29]. Sucrose concentration and temperature are the most important factors that regulate the activity of the levansucrase enzyme in Zymomonas mobilis. High sucrose concentrations and high temperatures stimulate fructo-oligosaccharide synthesis and the reduction leads to an increase in ethanol [5, 9].
Within the biotechnological processing economy, the fac-tors: microorganism efficiency, low cost substrate exploita-tion and the fermentaexploita-tion process choice are fundamentally important [2].
The use of low cost substrates has been investigated in research concerning microbial metabolite production. Mo-lasses and sugar cane syrup, beet juice, wheat extracts and milk serum fermentation for exopolysaccharide production including levan have been described by [14, 17]. Sorbitol and gluconic acid production by Zymomonas mobilis in sugar cane juice, molasses and corn steep liquor were reported by [8, 26] and molasses and beet juice for ethanol formation by [25].
The application of statistical designs for experiments and its modeling is important in a scientific study because it defines the effect of various factors and its interaction that leads to the optimization of the process. This instrument has been used in biotechnology by various authors [8, 25, 27]. 1Recebido para publicação em 18/7/2005. Aceito para publicação em
6/7/2006 (001575)
2Depto. Bioquímica e Biotecnologia, Universidade Estadual de Londrina,
C. P. 6001, CEP 86051-990, Londrina (Pr), Brasil E-mail: [email protected]
3Depto. Tecnologia de Alimentos e Medicamentos,
The aim of the present study is to assess sugar cane juice and sucrose as substrates, as well as the batch and fed batch process and their interactions in the levan production using a complete factorial design.
2 - MATERIALS AND METHODS
2.1 - Microorganism and maintenance
conditions
Strains CP4 (ATCC 31821) of Zymomonas mobilis were maintained at 4 °C in a liquid culture medium containing (in g/L) KH2PO4 - 2; (NH4)2SO4 - 1; MgSO4 7H2O - 0.5; yeast extract - 10; peptone - 20; sucrose - 100 and was renewed every five weeks.
2.2 - Substrate
Sucrose was sterilized at 1 atm for 20 min and added with salts above. The sugar cane juice was filtered, sterilized at 1 atm for 20 min then diluted in distilled water to obtain the required concentrations
2.3 - Fermentation conditions
The fermentation medium consisted of the salts (in g/L): KH2PO4 - 2; (NH4)2SO4 - 1; MgSO4 7H2O - 0.5; yeast extract - 2 and sugar cane juice and sucrose as carbon sources according to the design Table 1. The batch and fed batch fermentations were carried out in 125 mL erlenmeyers with 25 mL of the different fermentation media for 20 h at 25 °C and initial pH = 5.0 without agitation. The concentration cellular was standardized in 0.2 g/L for all the conditions. In fed batch fermentation, after six hours of culture, 12.5 mL was removed from the fermentation medium and 12.5 mL of the medium was added.
2.4 - Analytical methods
At the end of fermentation, the cell growth was assessed by turbidimetry in 605 nm. The cells were centrifuged at 4300 xg for 20 min at 4 °C and re-suspended in 0.9 g% (m/V) saline that was correlated with a standard biomass curve. The reducing sugar was quantified by the Somogyi-Nelson method [24, 28], total sugar by Phenol-Sulfuric [11], sorbitol by HPLC column aminex HPX 87C (300 mm
x 7.8 mm) ultra pure water as eluent, at 55 °C and with a refraction index as a detector [19]. Ethanol was determined by micro distillation [20]. Levan was separated by precipita-tion with ice-cold absolute ethanol, centrifuged at 8700 xg for 20 min at 4 °C washed in water and hydrolyzed with HCl 0.5% (V/V) for 60 min at 100 °C and estimated as fructose units by the Somogyi and Nelson reactions.
2.5 - Statistical analysis
A full factorial design 23 was used to optimize the
sub-strate concentration and the type of fermentation process.
The quantitative factors were sugar cane juice concentra-tion (X1) and sucrose concentration (X2) and the qualitative factor was process type: batch and fed batch (X3) all with two variation levels according to Table 1. The mathematical model proposed is shown in Equation 1:
Y1= b0 + b1X1 + b2X2 + b3X3 + b1*2 X1.X2 + (1)
b1*3 X1.X3 + b2*3 X2.X3
Where Y1 and Y2 are the response (levan), b0 the intersec-tion, b1, b2 b3 are the linear regression coefficients, b1*2, b1*3 e b2*3 are the regression coefficients of the interaction and X1, X2, X3 are the codified factors. After performing the 23 factorial designs, confirmatory experiments were used in
the sub-region of the best results using complete 22 factorial
designs with factors of sugar cane juice and sucrose at two levels (- 1 and + 1). The experiments were carried out in duplicate (Table 3). The proposed mathematical equation follows (Equation 2)
Y2 = b0 + b1 X1 + b2 X2 + b1*2 X1.X2 (2)
The levan, biomass, ethanol and sorbitol responses were analyzed by the STATISTICA application (1998).
3 - RESULTS AND DISCUSSION
3.1 - First design: selection of the affecting
variables in levan biosynthesis
From the results obtained (Tables 1 and 2) the effects that most affected levan formation that were statistically significant (p < 0.05) were sucrose (X2), the fermentation process (X3) and the sugar cane juice, as well as sucrose interaction (X1X2). The same interpretation was obtained from the normal graph (not shown) of the values of the ef-fects calculated by the complete 23 factorial design. The best
levan biosynthesis condition 35.58 g/L was at levels X1= - 1, X2 = + 1 and X3 = - 1.
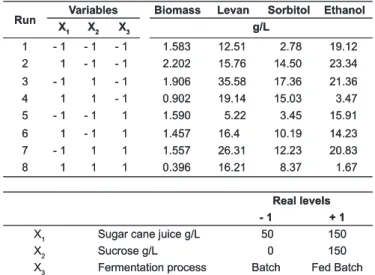
TABLE 1 – Full factorial design 23 for studies of the factors: sugar
cane juice, sucrose and fermentation process.
Run Variables Biomass Levan Sorbitol Ethanol
X1 X2 X3 g/L
1 - 1 - 1 - 1 1.583 12.51 2.78 19.12
2 1 - 1 - 1 2.202 15.76 14.50 23.34
3 - 1 1 - 1 1.906 35.58 17.36 21.36
4 1 1 - 1 0.902 19.14 15.03 3.47
5 - 1 - 1 1 1.590 5.22 3.45 15.91
6 1 - 1 1 1.457 16.4 10.19 14.23
7 - 1 1 1 1.557 26.31 12.23 20.83
8 1 1 1 0.396 16.21 8.37 1.67
Real levels
- 1 + 1
X1 Sugar cane juice g/L 50 150
X2 Sucrose g/L 0 150
X3 Fermentation process Batch Fed Batch
TABLE 1 – Full factorial design 23 for studies of the factors: sugar
cane juice, sucrose and fermentation process.
Run Variables Biomass Levan Sorbitol Ethanol
X1 X2 X3 g/L
1 - 1 - 1 - 1 1.583 12.51 2.78 19.12
2 1 - 1 - 1 2.202 15.76 14.50 23.34
3 - 1 1 - 1 1.906 35.58 17.36 21.36
4 1 1 - 1 0.902 19.14 15.03 3.47
5 - 1 - 1 1 1.590 5.22 3.45 15.91
6 1 - 1 1 1.457 16.4 10.19 14.23
7 - 1 1 1 1.557 26.31 12.23 20.83
8 1 1 1 0.396 16.21 8.37 1.67
Real levels
- 1 + 1
X1 Sugar cane juice g/L 50 150
X2 Sucrose g/L 0 150
The analysis of the results obtained in Table 1 shows that with the increase in the total sugar concentration from 200 g/L (experiment 3) to 300 g/L (experiment 4) the levan production was decreased to 46.21% and the sugar cane juice and sucrose interaction had a negative effect (Table 2). VIGANTS et al. [33] who studied culture medium osmotic pressure ascertained that the levan synthesis decreased sig-nificantly when the substrate concentration was increased. MURO et al. [23] reported that there were no differences in the levan formation when the sucrose concentration was increased from 200 to 300 g/L. DOELLE et al. [10] described that high sugar or salts concentrations caused differences in the use of fructose causing the formation of fructo-oligomers.
Table 2 shows that the X2 variable (sucrose) presented a positive effect and X3 variable (fermentation process) and X1X2 interaction (sugar cane juice - sucrose) had negative effects inhibiting levan formation.
TABLE 2 – Estimate of the effects relative to the concentration factors of sugar cane juice, sucrose and fermentation process.
Factor Effect p
Intercept 18.3912 0.000769
X1 - 3.0275 0.097331
X2 11.8375 0.007351
X3 - 4.7125 0.043841
X1 X2 - 10.2425 0.009783
X1 X3 3.5675 0.072993
X1 = sugar cane juice concentration; X2 = sucrose concentration; X3 process type; e R2 = 0.99285.
with 15.7% added salts and produced 17.8 g/L levan with Zymomonas mobilis.
The addition of sugar cane juice to the fermentation culture medium was not statistically significant. Agro-in-dustrial by-products present components that can inhibit product formation as reported by HAN & WATSON [14], FALCÃO DE MORAIS et al. [12], BEKERS et al. [4] e CAZETTA et al. [8].
Figure 1 represents the contour of the model for levan production, fixing the X3 variable (fermentation process) at level - 1 (Figure 1a) and + 1 (Figure 1b).
- 1.0 - 0.8 - 0.6 - 0.4 - 0.2 0.0 0.2 0.4 0.6 0.8 1.0
Sugar cane juice
Sucrose 1.0 0.8 0.6 0.4 0.2 0.0 - 0.2 - 0.4 - 0.6 - 0.8 - 1.0 25 20 15 30 35 a 1.0 0.8 0.6 0.4 0.2 0.0 - 0.2 - 0.4 - 0.6 - 0.8 - 1.0
- 1.0 - 0.8 - 0.6 - 0.4 - 0.2 0.0 0.2 0.4 0.6 0.8 1.0
Sugar cane juice
Sucrose 15 10 5 20 25 b
FIGURE 1 – Contour described for the levan production by Zymomonas mobilis, which represents the variable X3 (fer-mentative process) is - 1 (a) and + 1 (b).
- 1.0 - 0.8 - 0.6 - 0.4 - 0.2 0.0 0.2 0.4 0.6 0.8 1.0
Sugar cane juice
Sucrose 1.0 0.8 0.6 0.4 0.2 0.0 - 0.2 - 0.4 - 0.6 - 0.8 - 1.0 25 20 15 30 35 a 1.0 0.8 0.6 0.4 0.2 0.0 - 0.2 - 0.4 - 0.6 - 0.8 - 1.0
- 1.0 - 0.8 - 0.6 - 0.4 - 0.2 0.0 0.2 0.4 0.6 0.8 1.0
Sugar cane juice
Sucrose 15 10 5 20 25 b
FIGURE 1 – Contour described for the levan production by Zymomonas mobilis, which represents the variable X3 (fer-mentative process) is - 1 (a) and + 1 (b).
As the mathematical model (eq. 1) obtained for the levan response (Y1) had a qualitative variable. The X3 vari-able should be substituted by its upper (fed batch) or lower (batch) level to fit it to the type of process and give estimates concerning the importance of the substrates.
Y1 = 18.39 – 1.51X1 + 5.92X2 – 2.36X3 – (eq. 1)
5.12 X1X2 + 1.78X1X3
The predictive model confirmed the best levan produc-tion condiproduc-tions: 50 g/L sugar cane juice plus 150 g/L sucrose in batch. The value observed of 35.58 g/L is very close to the predicted value of 35.08 g/L bearing in mind that the explained variation percentage is at least 97%.
From the obtained results, it can be observed that variable X3 (fermentation process) had a negative effect on the levan production (Table 2) which means when the fed batch process was used there was a decrease in the levan biosynthesis (Table 1, experiments 1 and 5). Therefore in the next experiments, the bath process was used.
In the medium of sugar cane juice with 150 g/L total sugars, the levan formation was 15.76 g/L and 16.64 g/L in the batch and fed batch, respectively (experiments 2 and 6, Table 1). Similar results were obtained by RIO et al. apud FALCÃO DE MORAIS et al. [12] that used sugar cane juice
The sugar cane juice and sucrose interaction also had a negative effect on the ethanol and sorbitol production. The best conversion coefficient in ethanol was 73.64% and 71.48% in batch and fed batch, respectively with 50 g/L sugar cane juice. Concerning sorbitol, the best production was in experiment 3 reaching 17.36 g/L with 41.71% conversion efficiency. It is known that sorbitol is an osmoprotective agent, therefore there was more formation at the higher sugar concentrations [29].
3.2 - Second design: assessment of the
importance of sugar cane juice
With the aim of confirming the substrate influence (sugar cane juice and sucrose) on the fermentation medium, de-fined in the first design, new experiments were performed as shown in Table 3.
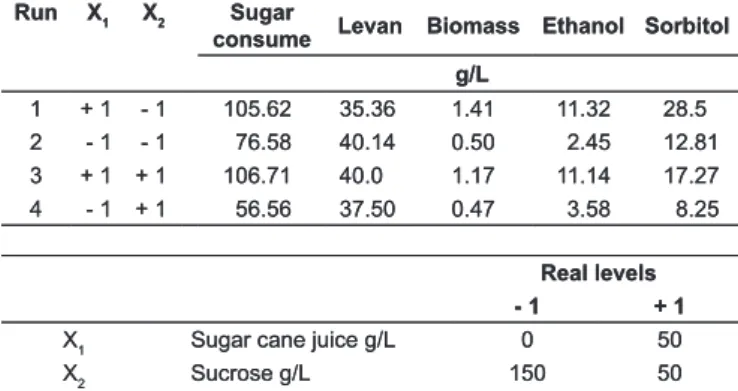
TABLE 3 – Full factorial design (22) for responses: levan, biomass,
ethanol, sorbitol.
Run X1 X2 Sugar
consume Levan Biomass Ethanol Sorbitol
g/L
1 + 1 - 1 105.62 35.36 1.41 11.32 28.5
2 - 1 - 1 76.58 40.14 0.50 2.45 12.81
3 + 1 + 1 106.71 40.0 1.17 11.14 17.27
4 - 1 + 1 56.56 37.50 0.47 3.58 8.25
Real levels
- 1 + 1
X1 Sugar cane juice g/L 0 50
X2 Sucrose g/L 150 50
The responses are means of the duplicate.
levan formation demonstrating that sugar cane juice and this concentration may have influenced production negatively.
TABLE 4 - Analysis of variance of the model (eq. 2).
Source of variation
Sum of square
Degrees of freedom
Mean Square
Fcal Ftab(5%)
Regression 31.0954 3 10.3651 7.0162 6.59
Residual 5.9093 4 1.4773 -
-Total 37.0047 7 - -
-TABLE 4 - Analysis of variance of the model (eq. 2).
Source of variation
Sum of square
Degrees of freedom
Mean Square
Fcal Ftab(5%)
Regression 31.0954 3 10.3651 7.0162 6.59
Residual 5.9093 4 1.4773 -
-Total 37.0047 7 - -
-The effect of the substrates can be modeled:
Y2 = 38.25 – 0.57X1 + 0.50X2 + 11.82 X1.X2 (eq. 2)
This is statistically significant at the level of 5% according to ANOVA (Table 4). As R2 = 0.8403, the variation percent-age explained by the model is 84%. The values observed and estimated by model eq. 2 are shown in Table 5. The greater response values indicated the importance of the experiment interaction (2a and 2b) and experiments (3a and 3b). This corroborates with greater coefficients of the interaction in the model.
It is worth mentioning that the coefficients for sugar cane juice and sucrose are of the same order, but with op-posing signs, that 150 g/L sucrose produced the best results in levan formation. To obtain a similar result, the addition of 50 g/L sugar cane juice should be compensated with 200 g/L sucrose. ANANTHALAKSHMY & GUNASEKARAN [35] reported no differences in the 150-250 g/L sucrose concentrations in the levan production. Table 3 (experiment 2) and Table 1 (experiment 2) show that, where the culture mediums contained 150 g/L total sugars (either sucrose or sugar cane juice) there was a 40 g/L to 15.46 g/L decrease in
These experiments showed that the high level of the X1 variable (sugar cane juice) had a positive effect on the responses: biomass (0.807), sorbitol (8.2150) and ethanol (12.355) and was statistically significant at 5% probability. The addition of sugar cane juice favored bacteria growth with a consequent increase in sorbitol and ethanol forma-tion. The greatest sorbitol formation reached was 11.32 and 11.41 g/L in experiments 1 and 3 with a conversion efficiency of 20.17% and 19.62%, respectively.
TABLE 5 - Experimental and predicted values for model eq. 2.
Runs X1 X2 Experimental Predicted
g/L
1a + 1 - 1 36.19 35.36
2a - 1 - 1 41.16 40.14
3a + 1 + 1 40.27 40.01
4a - 1 + 1 38.57 37.50
1b + 1 - 1 34.53 35.36
2b - 1 - 1 39.11 40.14
3b + 1 + 1 39.74 40.01
4b - 1 + 1 36.43 37.50
X1 = sugar cane juice; X2 = sucrose.
4 - CONCLUSION
The present study used a complete factorial design for levan production by Zymomonas mobilis CP4. The fermen-tation conditions were the type and concentration of the substrate and fermentation processes (batch and fed batch). The highest levan production of 40.14 g/L was when both sucrose 150 g/L and batch fermentation were achieved. The results showed that the addition of sugar cane juice to the fermentation medium resulted in an increase in cell concen-tration, as well as ethanol and sorbitol production.
5 - REFERENCES
[1] ANANTHALAKSHMY, V. K.; GUNASEKARAN, P. Opti-mization of levan production by Zymomonas mobilis. Brazilian Arch. Biol Technol., v. 42, p. 291-297, 1999.
[3] BEKERS, M.; LAUKEVICS, J.; UPITE, D.; KAMINSKA, E.; VIGANTS, A.; VIESTURS, U.; PANKOVA, L.; DANILEVICS, A. Fructooligosaccharide and levan producing activity of Zymomonas mobilis extracelular levansucrase. Proc. Biochem., v. 38, p. 701-706, 2002.
[4] BEKERS, M.; LINDE, R.; UPITE, D.; KAMINSKA, E.; VIESTURS, U. Sugar beet juice fermentation by Zymomonas mobilis attached to stainless steel wire spheres. Acta Biotechnol., v. 21, p. 89-96, 2001.21, p. 89-96, 2001. [5] BEKERS, M.; UPITE, D.; KAMINSKA, E.; GRUBE, M.;
LAUKEVICS, J.; VINA, I.; VIGANTS, A.; ZIRKMANIS, P. Fructan biosynthesis by intra and extracellular Zymomonas mobilis levansucrase after simultaneous production of ethanol and levan. Acta Biotechnol., v. 23, p. 85-93, 2003.23, p. 85-93, 2003.
[6] CALAZANS, G. M. T.; LOPES, C. E.; LIMA, R. M. O. C.; FRANÇA, F. P. Molecular weight and antitumor activity of Zymomonas mobilis levan. Int. J. Biol. Macromol., v. 27, p. 245-247, 2000.
[7] CALAZANS, G. M. T.; LOPES, C. E.; LIMA, R. M. O. C.; FRANÇA, F. P. Antitumuor activities of levans produced by Zymomonas mobilis strains. Biotechnol. Lett., v. 19, p. 19-21, 1997.
[8] CAZETTA, M. L.; CELLIGOI, M. A. P. C; BUZATTO, J. B.; SCARMINO, I. S.; SILVA, R. S. F. Optimization study for sorbitol production by Zymomonas mobilis in sugar cane juice. Proc. Biochem., v. 40, n. 2, p. 747-751, 2005.
[9] CRITTENDEN, R. G.; DOELLE, H. W. Identification and characterisation of the extracellular sucrases of Zymomonas mobilis UQM 2716 (ATCC 39676). Appl. Microbiol. Biotechnol., v. 41, p. 302-308, 1994. [10] DOELLE, H. W.; KIRK, L.; CRITTENDEN, R.; TOH, H.
Zymomonas mobilis – Science and industrial applica-tion. Crit. Rev. Biotechnol., v. 13, p. 57-98, 1993. [11] DUBOIS, M.; GILLES, K. A.; ROBERTS, P. A.; SMITH,
F. Colorimetric methods for determination of sugars and related substances. Anal. Chem., v. 25, p. 350-356, 1956.
[12] FALCÃO DE MORAIS, J. O.; RIOS, E. M. M. M.; CALAZANS, G. M. T.; LOPES, C. E. Zymomonas mobilis research in the Pernambuco Federal University. in the Pernambuco Federal University. J. Bio-technol., v. 31, p.75-91, 1993.
[13] GORRET. N.; MAUBOIS, J. L.; ENGASSER, J. M.;NGASSER, J. M.; GHOUL, M. Study of the effects of temperature, pH and yeast extract on growth and exopolysaccharides production by Propionibacterium acidi-propionici on milk microfiltrate using a response surface methodol-ogy. J. Appl. Microbiol.Microbiol., v. 90, p. 788-796, 2001. [14] HAN, Y. W; WATSON, M. A. J. Production of microbial
levan from sucrose, sugarcane juice and beet molasses. Ind. Microbiol., v. 9, p. 257-260, 1992.
[15] HUBER, A. E.; STAYTON, P. S.; VINEY, C.; KAPLAN, D. L. Liquid crystalline of a biological polysaccharide: The levan/water phase diagram. Macromol., v. 27, n. 4, p. 953-957, 1994.
[16] JANG, K. H.; SONG, K. B.; KIM, C. H.; CHUNG, B. H.; KANG, S. A.; CHUN, U. H.; CHOUE, R. W.; RHEE, S. K. Comparison of characteristics of levan produced by different preparations of levansucrase from Zymomonas mobilis. Biotechnol. Lett. Lett., v. 23, p. 339-344, 2001.
[17] JAVAD, B.; BAZZAZ, B. S. F.; ZOHREH, S. Optimization of dextran production by Leuconostoc mesenteroides NRRL B-512 using cheap and local sources of carbo-hydrate and nitrogen. Biotechnol. Appl. Biochem., v. 38, p. 267-269, 2003.
[18] KANG, J. E.; LEE, S. O.; LEE, J. D.; LEE, T. H. Purifi-cation and characterization of a levanbiose producing levanase from Pseudomonas sp. Biotechnol. Appl. Biochem., v. 29, p. 263-268, 1999.
[19] KANNAN, T. R.; SANGILIYANDI, G.; GUNASEKARAN, P. Influence of intra and extracellular sucrases of Zymomonas mobilis on ethanol production and by production formation. Biotechnol. Lett., v. 19, p. 661-664, 1997.
[20] KAYE, S.; HAAG, H. B. Determination of alcohol content. J. Forenses Medical, v. 1, p. 373, 1954.
[21] KIM, C. H.; LEE, J. Y; KIM, M. G.; SONG, K. B.; SEO, J. W.; CHUNG, B. H.; CHANG, S. J.; RHEE, S. K. Fer-mentation strategy to enhance plasmid stability during the cultivation of Escherichia coli for the production of recombinant levansucrase. J. Ferment. Bioeng., v. 86, p. 391-394, 1998.
[22] MACEDO, M. G.; LACROIX, C.; GARDNER, N. J.; CHAMPAGNE, C. P. Effect of medium supplementation on exopolysaccharide production by Lactobacillus rhamnosus RW-9595M in whey permeate. Int. Dairy J., v. 12, p. 419-426, 2002.
[23] MURO, A. C.; RODRIGUEZ, E.; ABATE, C. M.; SIÑERIZ,MURO, A. C.; RODRIGUEZ, E.; ABATE, C. M.; SIÑERIZ, F. Levan production using mutant strains of Zymomonas mobilis in different culture conditions. Biotechnol. Lett., v. 22, p. 1639-1642, 2000.
[24] NELSON, N. A. A photometric adaptation of the somo-gyi method forr determination of glucose. Biochem., v. 153, p. 375-380, 1945.
[25] RATNAM, B. V. V.; NARASIMHA, R. M.; DAMODAR R. M.;AR R. M.; SUBBA R. S.; AYYANNA, C. Optimisation of fermenta-tion condifermenta-tions for the producfermenta-tion of ethanol from sago starch using response surface methodology. World J. Microbiol. Biotechnol., v. 19, p. 523-526, 2003. [26] SILVEIRA, M. M; WISBECK, E.; HOCH, I.; JONAS, R.
Production of glucose-fructose oxidase and ethanol by Zymomonas mobilis ATCC 29191 in medium contai-ning corn steep liquor as a source of vitamins. Appl. Microbiol. Biotechnol., v. 55, p. 442-445, 2001. [27] SKOWOK, M.; FIEDURED, J. Optimisation of inulinase
production by Aspergillus niger using simplex and classical method. Food Technol. Biotechnol., v. 42, n. 3, p. 141-146, 2004.
[28] SOMOGYI, M. A. A new reagent for determination of sugar. J. Biol. Chem., v. 160, p. 61-68, 1944.
[29] SPRENGER, G. A. Carbohydrate metabolism in Zymomonas mobilis: a catabolic highway with some scenic routes. Fems Microbiol. Lett., v. 145, p. 301-307, 1996.
[30] SWINGS, J.; DE LEY, J. The Biology of Zymomonas. Bacteriol. Rev.Rev., v. 41, p. 1-46, 1977.
[32] VIGANTS, A.; HICKE, H. G.; MARX, S. P. A simple and efficient method for the purification of membrane bound levansucrase from Zymomonas mobilis. Current Microbiol., v. 42, p. 415-418, 2001.
[33] VIGANTS, A.; ZIKMANIS, P.; BEKERS, M. Sucrose me-dium osmolality as a regulator of anabolic and catabolic parameters in Zymomonas culture. Acta Biotechenol., v. 16, p. 321-327, 1996.
[34] YAMAMOTO, Y.; TAKAHASHI, Y.; KAWANO, M.; IIZUKA, M.; MATSUMOTO, T.; SAEKI, S.; YAMAGUCHI, H. In vitro digestibility and fermentability of levan and its hypocholesterolemic effects in rats. J. Nutr. Biochem., v. 10, n. 1, p. 13-18, 1999.