Published online 7 October 2003 in Wiley InterScience (www.interscience.wiley.com). DOI: 10.1002/xrs.667
Numerical description of photoelectric absorption
coefficients for fundamental parameter programs
Horst Ebel,
1∗Robert Svagera,
1Maria F. Ebel,
1Abdallah Shaltout
2and John H. Hubbell
31Institut f ¨ur Festk ¨orperphysik, Vienna University of Technology, Vienna, Austria 2National Research Center, Spectroscopy Department, Dokki, Cairo, Egypt 311830 Rocking Horse Road, Rockville, Maryland 20852, USA
Received 3 September 2002; Accepted 22 April 2003
After a systematic analysis of different databases and a comparison with empirical data, we decided to describe photoelectric absorption coefficients, coherent and incoherent scattering coefficients and mass attenuation coefficients in the energy range from 1 to 300 keV for elements fromZ= 1 to 94 by a modified version of Scofield’s tables in combination with scattering coefficients from Elamet al. Modifications include check and correction of edge positions, description of M4- and M5-ranges of elements from
promethium upwards by sawtooth responses and reduction of data by introduction of least-squares fits of fifth order to Scofield’s and Elamet al.’s numerical data. Our database was developed especially for application in fundamental parameter programs for quantitative x-ray analysis (XRFA, EPMA, XPS and TEY). Copyright2003 John Wiley & Sons, Ltd.
INTRODUCTION
Fundamental parameter programs for quantitative x-ray analysis compare computed and measured signals in order to determine compositions of the investigated specimens. Two of the fundamental parameters are photoelectric and mass attenuation coefficients of the elements. A great number of numerical values of these quantities are given in the literature and on the Internet. To obtain an overview of the actual state, an extended search has to be performed. One of the recent papers on this subject was published in 1999 by Hubbell.1Besides completeness of such a collection and critical considerations on their features with regard to fundamental parameter algorithms, the availability of digitized data for computer programs is an essential criterion. There exist numerous theoretical or semi-empirical descriptions of photoelectric absorption coefficients versus photon energy with atomic number as parameter but, for comparison of theory and experiment, mass attenuation coef-ficients have to be calculated from photoelectric absorption and scattering coefficients.
It should be mentioned that fluorescence yields, transition probabilities, Coster–Kronig transition probabilities, photon energies of characteristic radiations, asymmetry parameters of electron emission, inelastic and elastic mean free paths and escape probabilities of electrons released by x-rays are not within the scope of the present paper.
Another feature of the data sets is information necessary for the specific type of fundamental parameter algorithm:
ž XRFA: edge energies define the integration intervals and
absorption edge jumps the absorption in specific shells and subshells of the atoms.
Ł
Correspondence to: Horst Ebel, Institut f ¨ur Festk ¨orperphysik, Vienna University of Technology, Vienna, Austria.
E-mail: [email protected]
ž EPMA: a situation similar to XRFA arises,
consider-ing secondary excitation of characteristic radiations by electron-excited characteristic and white radiations of the specimen.
ž XPS: subshell cross-sections give the number of electrons
per photon and kinetic electron energies determine the probability of electron escape without inelastic scattering.
ž TEY (total electron yield): by measuring the x-ray induced
total electron yield, the knowledge of subshell absorption in combination with the corresponding edge positions allows one to quantify the effective number of electrons per photon and from the start energies of the electrons their escape probability.
Whereas in XPS the energy range of photons is restricted by the available x-ray sources of standard equipment to only a few keV, an extension to¾50 keV becomes necessary for
EPMA and TEY and XRFA with high-voltage systems up to 200 kV or isotope excitation requires maximum photon energies of 200 keV and even more. An argument for a low-energy cut-off is the increasing uncertainty of data with decreasing photon energies. For this reason, we decided to describe photoelectric absorption and scattering coefficients in an energy range from 1 to 300 keV. Cross-sections are given in units of cm2g1.
COMPARISON OF DIFFERENT DATABASES
We start by looking at the classical McMaster tables.2 Elements fromZD1 to 83 and elementsZD86, 90, 92 and
first-order coefficients in the M- and N-range and third-order least-squares fit coefficients of coherent and incoherent scattering coefficients. Least-squares fit coefficients of N-range of elementsZD61 to 69 are not correct. No detailed
information on position and jumps of M-edges of elements
Z>51 and N-edges of elementsZ>85 is given.
Shaltout3completed the McMaster tables by adding the missing elements Z D 84, 85, 87, 88, 89, 91 and 93. For
this purpose, photoelectric cross-sections have been taken from Scofield’s tables4 and coherent and incoherent scat-tering cross-sections from Elamet al.’s tables.5Furthermore, Shaltout corrected the mentioned wrong values of least-squares fit coefficients and added missing M- and N-edge data.
The most essential database of photoelectric cross-sections is contained in Scofield’s tables. Elements from
Z D 1 to 94 and photon energies from 1 keV to 1.5 MeV
are covered. Shell and subshell coefficients can be quantified by interpolation of tabulated numerical values. For mass attenuation coefficients, coherent and incoherent scattering coefficients have to be taken from other tables. The responses of photoelectric absorption versus photon energy differ from other databases especially in the region of M-edges.
Berger and Hubbell6 published a database (XCOM) for personal computers. It contains photon energies from 1 keV to 100 GeV, atomic numbers from 1 to 94 and edge positions, jumps and scattering coefficients, but no shell and subshell cross-sections.
Sasaki’s tables7 are similar to Berger and Hubbell’s and include elements fromZD4 to 83 and in additionZD92.
Photon energies extend from 4 to 100 keV. Interpolation of tabulated values is required.
Data from Henke et al.’s tables8 are valid for elements from Z D 1 to 92 and photon energies from 50 eV to
30 keV. Photoelectric and scattering coefficients are available. Interpolation of tabulated values is required.
In 1995, Chantler9published a database where elements from Z D 1 to 92 and photon energies from 1–10 eV to
0.4–1 MeV are within the scope. Additionally to photoelec-tric and scattering coefficients, the photoelecphotoelec-tric absorption in the K-shell is also given. Minor errors are wrong expo-nents in K-edge energies of elements from Z D 31 to 86.
Interpolation of tabulated values is required.
The most recent databases are those from Cullenet al.10 (1997) and Elamet al.5(2001). The former starts at 1 eV and ends at 100 GeV for atomic numbers from Z D 1 to 100,
whereas the latter covers photon energies from 100 eV to 1 MeV and atomic numbers from ZD 1 to 98. Very good
agreement between both tables and Scofield’s numerical data exists in the range of photon energies from 1 to 300 keV. Again M-edges are exceptions. Interpolation of tabulated values is required. Elam et al.’s database includes edge positions, jumps, fluorescence yields, transition probabilities, Coster–Kronig transition probabilities, photon energies of characteristic radiations and coherent and incoherent scattering coefficients.
Experimental values of mass attenuation coefficients have been collected by Salomanet al.11and Hubbell.12Both papers represent more or less the complete state of experimental results up to 1996. In the meantime, Ertugrulet al.,13Kerur et al.,14Karabulut et al.,15 Angeloneet al.,16 Chantleret al.,17 Mallikarjunaet al.18and Suzuki and Saito19published further experimental values.
Sch¨afer20 digitized the tables of Saloman et al.11 and Shaltout3digitized Hubbell’s12data collection and the results from Refs 13–19 from 1 keV upwards, to allow a convenient comparison of theoretical and experimental photoelectric absorption coefficients. An additional contribution to this subject was a careful comparison of coherent and incoherent
1000
C
0.1
1 100
Photon Energy (keV) 10
1 10 100
µ
/
ρ
(cm
2/g)
'Sasaki' 'Cullen' 'Henke' 'Chantler' 'Scofield' 'Scofappr' 'XCOM' 'McMaster' 'Elam' 'meas'
'Sasaki' 'Cullen' 'Henke' 'Chantler' 'Scofield'
'XCOM' 'Scofappr'
'McMaster' 'Chant-Cu' 'Elam' 'meas' 10000
Cu
0.1
1 100
Photon Energy (keV) 10
1 100
10 1000
µ
/
ρ
(cm
2/g)
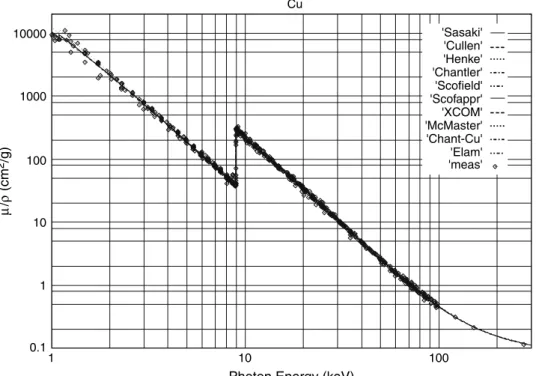
Figure 2. Mass attenuation coefficient of copper.
scattering coefficients versus photon energy and atomic number. The results can be summarized by the statement that the agreement of scattering coefficients from different sources does not influence our considerations on photoelectric absorption coefficients.
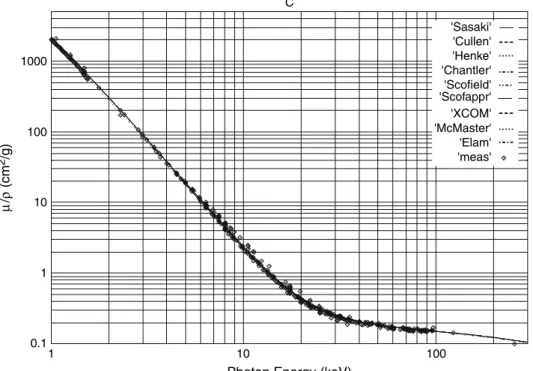
Figures 1 to 7 contain computed responses of mass atten-uation coefficients from different databases and experimental data. Elements with increasing atomic number were chosen arbitrarily. The only criterion was the existence of either no edge between 1 and 300 keV (C), or the L3- and K-edges (Cu), or the K- and L-edges (Ag) or finally, the K-, L- and M-edges (Au). Magnifications of some interesting features are given in Figs 3, 5 and 7.
In Fig. 1, carbon represents mass attenuation coefficients of an element with its K-edge at a photon energy of
<1 keV. The nine computed responses of µ/ can only be distinguished after magnification. The statistical scatter of measured values is withinš10%.
Copper (Fig. 2) has its K-edge at 8.979 keV and the L3 -edge at 1.096 keV. A comparably more pronounced scatter of experimental data of up to š20% can be observed at
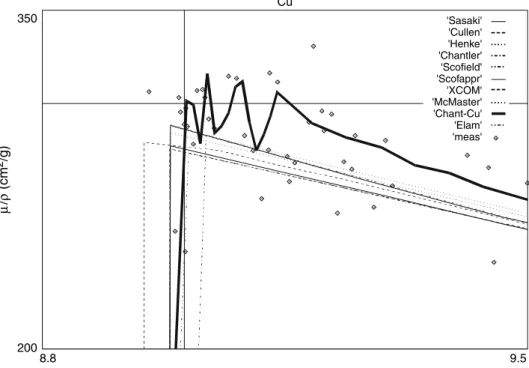
photon energies from 1 to 5 keV. Figure 3 is a magnification of the K-edge. Curves of computed values of µ/ show differences up to 4% and the K-edge positions vary from 8.95 to 9.03 keV. The scatter of measured data isC10% and 5% with regard to the computed responses of the different
authors. The measured response of ‘Chant-Cu’ is represented by a ‘thick’ curve. ‘Chant-Cu’ is the result of an extremely careful synchrotron investigation which was performed by Chantler et al.17 The oscillations are from absorption edge fine structures (EXAFS, XANES). As copper is embedded in another matrix, the shape, position and amplitude of the oscillations change. Since absorption edge structures have to be expected from other edges, elements and matrices also,
a general description of photoelectric absorption close to absorption edges becomes questionable.
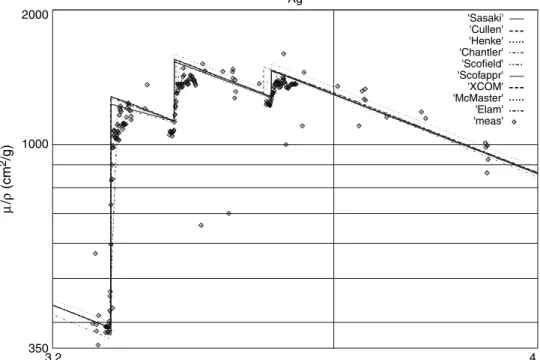
Silver (Fig. 4) has its K- and L-edges above 1 keV. Figure 5 is a magnification of the L-edge range. A well pronounced deviation between theory and experiment can be recognized, whereas the computed responses differ only within a few per cent. A possible explanation of the finite slopes of measured values at the L-edges could be the bandwidth of the x-ray monochromators in the experiments.
The K-, L- and M-edges of gold appear at photon energies
>1 keV (Fig. 6). An essential feature in the M-edge region is the remarkable differences between the responses from various databases. Figure 7 is a magnification of the M-edge range.
From Figs 1–7 we conclude that above M1-, L1- and K-edges and below M5-, L3- and K-edges most of the computed responses of mass attenuation coefficients do not differ too much and are in reasonable agreement with measured values. The situation changes, considering the measured Cu K-edge response of Chantleret al.17with a deviation of nearly 10% from computed responses due to the superposition of the absorption edge fine structure. Some of the L-edges show systematic deviations between computed responses and measured values. In the case of M-edges there exists practically no agreement between the data from different databases.
'Sasaki' 'Cullen' 'Henke' 'Chantler' 'Scofield'
'XCOM' 'Scofappr'
'McMaster' 'Chant-Cu' 'Elam' 'meas' 350
200
8.8 9.5
Cu
Photon Energy (keV)
µ
/
ρ
(cm
2/g)
Figure 3. Magnification of the K-edge range of copper.
10000
0.1
1 100
Photon Energy (keV) 10
1 100
10 1000
µ
/
ρ
(cm
2/g)
Ag
'Sasaki' 'Cullen' 'Henke' 'Chantler' 'Scofield'
'XCOM' 'Scofappr'
'McMaster' 'Elam' 'meas'
Figure 4. Mass attenuation coefficient of silver.
characteristic K-radiations is obtained from total photoelec-tric absorption coefficientsby the use of absorption edge jump ratioSK:
KDÐSK
1
SK
⊲1⊳
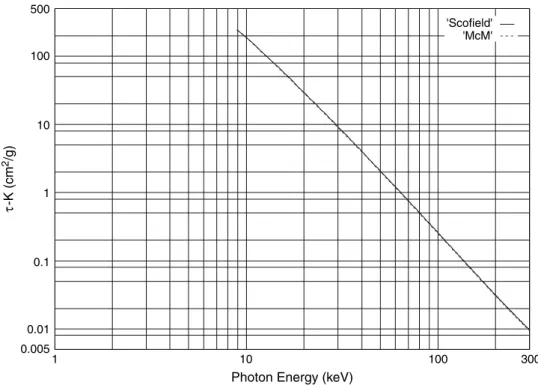
In Fig. 8, Scofield’s K-shell cross-sections of copper are compared with values computed from McMaster’s tables by means of absorption edge jumps. The excellent agreement of the responses seems to confirm the validity of the concept of
absorption edge jumps. Therefore, the next step is dedicated to L-shell cross-sections by L-edge jumps for computation of characteristic L-radiations. The corresponding equation for the L3is
L3DÐ
SL31
SL3
⊲2⊳
'Sasaki' 'Cullen' 'Henke' 'Chantler' 'Scofield'
'XCOM' 'Scofappr'
'McMaster' 'Elam' 'meas'
4.7 Ag
3.2
Photon Energy (keV) 1000
350 2000
µ
/
ρ
(cm
2/g)
Figure 5. Magnification of the L-edge range of silver.
10000
1 100
Au
Photon Energy (keV) 10
1 100
10 1000
µ
/
ρ
(cm
2/g)
'Sasaki' 'Cullen' 'Henke' 'Chantler' 'Scofield'
'XCOM' 'Scofappr'
'McMaster' 'Elam' 'meas'
Figure 6. Mass attenuation coefficient of gold.
L1-edge and K above the K-edge. Thus, in the K-range
L3DÐ 1
SK
Ð 1
SL1
Ð 1
SL2
ÐSL31
SL3
⊲3⊳
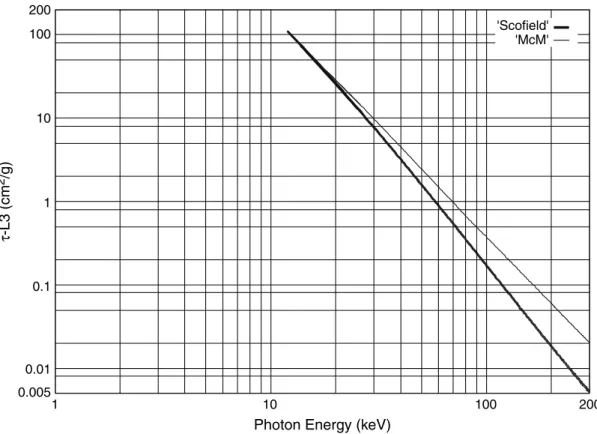
describes the photoelectric absorption in the L3-subshell at photon energies higher than the K-edge energy. A similar procedure gives the values for the other two L-subshells. Figure 9 compares the L3-subshell cross-section of gold as computed from McMaster’s and Scofield’s tables. Gold is a prominent candidate for quantitative
analysis by characteristic L-radiations. The cross-section
L˛ of the strongest Au L˛ radiations includes also the Coster–Kronig transition probabilities fij, the photoelectric shell- and subshell coefficients of K, L1, L2and L3:
L˛D[L3CKpKL3C⊲L2CKpKL2⊳f23
4000 Au
800
2.1 3.7
Photon Energy (keV)
1000
µ
/
ρ
(cm
2/g)
'Sasaki' 'Cullen' 'Henke' 'Chantler' 'Scofield'
'XCOM' 'Scofappr'
'McMaster' 'Elam' 'meas'
Figure 7. Magnification of the M-edge range of gold.
500
0.005
1 100 300
Photon Energy (keV)
10 0.1
0.01 10
1 100
τ
-K (cm
2/g)
'Scofield' 'McM'
Figure 8. Photoelectric absorption in the K-shell of copper from McMaster’s and Scofield’s tables.
subshell cross-sections. Transition probabilities, fluorescence yields and Coster-Kronig transition probabilities are from Elamet al.’s tables. The pronounced difference especially in the photon energy range between L1and K makes the concept of absorption edges only a rough approximation in the case of L-subshells. Consequently, there remain only Scofield’s data from the complete set of databases for application in XRFA.
From the similarity of the fundamental parameter approaches, the considerations are also valid for EPMA. On the other hand, the methods of x-ray excited electron
200
0.005
1 100 200
Photon Energy (keV)
10 0.1
0.01 10
1 100
τ
-L3 (cm
2/g)
'Scofield' 'McM'
Figure 9. Photoelectric absorption in the L3-shell of gold from McMaster’s and Scofield’s tables.
'error-La' 10
8
6
4
2
0
-2
-4
0 100 150 200 250 300
Photon Energy (keV)
50
rel.error (%)
Figure 10. Relative error of the L˛cross-sectionL˛of gold: relative error (%)D
L˛,McML˛,Scof
L˛,Scof Ð100.
MODIFICATION OF SCOFIELD’S DATABASE
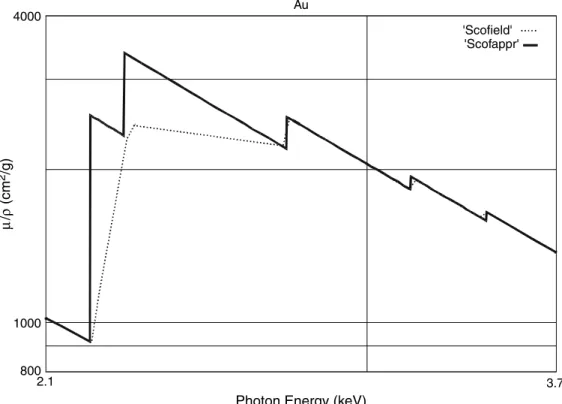
We describe Scofield’s numerical values of shell- and subshell cross-sections by least-squares fit polynomials of fifth order. Maximum deviations are <0.1%. In some cases (compare the M4- and M5-edges of gold in Fig. 11).
4000
1000
800
2.1 3.7
Photon Energy (keV)
µ
/
ρ
(cm
2/g)
'Scofield' Au
'Scofappr'
Figure 11. Comparison of our description of Scofield’s data (Scofappr) with the original values (Scofield) in the M-edge range of gold.
to the conclusion that the existing theoretical models and experimental data require further investigations. Therefore, for an application in fundamental parameter programs of x-ray analysis, we recommend a sawtooth response at the M4- and M5-edges calculated by extrapolation of Scofield’s subshell cross-sections. A further modification of Scofield’s data arises from a careful check of edge positions. Responses which have been computed by means of this database are indicated by ‘Scofappr.’
The structure of a datafile is demonstrated by the computer printout for copper. Table 1 gives the datafile. Numerical values of the lsf-coefficients are given in single precision. With different values E (in keV) of the photon energy we compute the following quantities for fundamental parameter programs and start with the determination of the coherent and the incoherent scattering coefficients; all cross-sections are given in units of cm2g1:
coh/Dexp
1.610760.00786082 ln⊲E⊳0.120265[ln⊲E⊳]2
0.0847087[ln⊲E⊳]3C Ð Ð Ð
⊲5⊳
inc/Dexp
5.1247C1.52359 ln⊲E⊳1.48407[ln⊲E⊳]2
1.82812[ln⊲E⊳]3C Ð Ð Ð
⊲6⊳
The next step is an arbitrarily chosen photoelectric absorption in the L3-subshell (Cu 2p3/2⊳for an application in XPS or TEY:
L3/Dexp
8.695162.45156 ln⊲E⊳0.287522[ln⊲E⊳]2
C0.0375707[ln⊲E⊳]3C Ð Ð Ð
⊲7⊳
with kinetic energyEkinof the photoelectron:
EkinDEEL3 ⊲8⊳
EL3 D0.9311 keV is the L3-edge energy or binding energy of Cu 2p3/2 electrons. The total photoelectric absorption coefficient is obtained from the ‘global data.’ For photon energiesEabove the K-edge energy the K-range fit has to be used:
/Dexp5.99849C4.41377 ln⊲E⊳3.57877[ln⊲E⊳]2
C0.910946[ln⊲E⊳]3C Ð Ð Ð ⊲9⊳
and for photon energies below the K-edge energy the L-range fit
/Dexp9.368462.3652 ln⊲E⊳0.0728571[ln⊲E⊳]2
0.112747[ln⊲E⊳]3C Ð Ð Ð
⊲10⊳
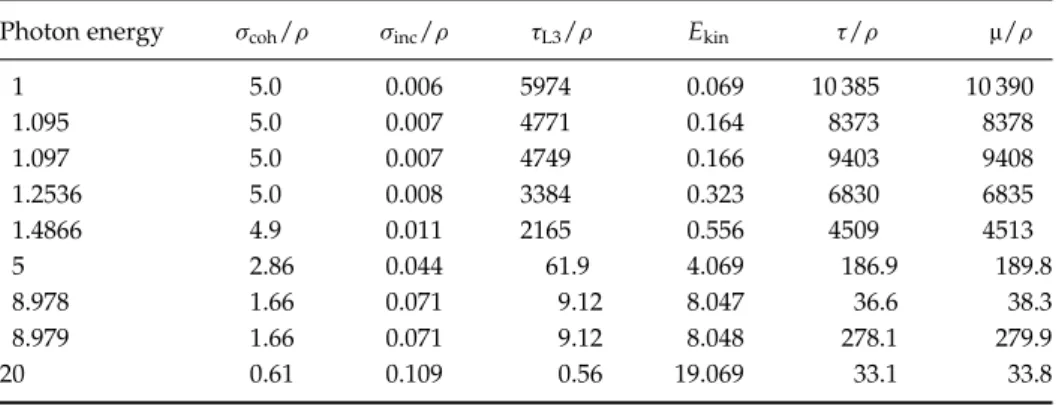
At photon energies between 1 keV and L1, the numerical value has to be divided by the L1-edge jump, 1.1279. Computed values of coherent and incoherent scattering coefficients, of the photoelectric absorption coefficient in the L3-subshell, of the kinetic energy of Cu 2p3/2photoelectrons and of the total photoelectric absorption coefficient together with the mass attenuation coefficient of copper are given in Table 2.
For high-Zelements where the M5-edge energy exceeds 1 keV the scheme is as follows. From 1 keV to M5 we use the N-range fit, from M5to L3 the M-range fit and from L3 to K the L-range fit. Jumps are considered by dividing by the corresponding edge jump values. Thus, for example, at a photon energy between M4and M3we use the M-range fit and divide by the jumps of M1, M2and M3.
Table 1. Datafile of copper for computation of coherent and incoherent scattering coefficients, subshell, shell and total photoelectric absorption coefficients, mass attenuation coefficients and kinetic energy of photoelectrons for fundamental parameter programs
Cu Z A rho
29 3.54 8.9400EC00
Cu coherent and incoherent lsf-coefficients
1.61076EC00 7.86082E03 1.20265E01 8.47087E02 1.97910E02 1.33671E03 5.12470EC00 1.52359EC00 1.48407E01 1.82812E02 2.05003E03 2.37385E05
Cu edge-energies edge-jumps and lsf-coefficients K
8.97890 7.59994
5.06132EC00 5.39792EC00 4.05976EC00 1.03004EC00 1.34157E01 7.03190E03 L1
1.09610 1.12790
7.12848EC00 1.28404EC00 4.07297E01 7.16763E02 1.11716E02 8.18537E04 L2
0.9510 1.00000
8.03446EC00 2.45466EC00 2.51178E01 1.93953E02 2.29673E03 3.55470E04 L3
0.9311 1.00000
8.69516EC00 2.45156EC00 2.87522E01 3.75707E02 6.49420E03 6.74545E04 M1
0.1198 1.00000
5.53791EC00 1.76042EC00 1.50392E01 3.43852E03 2.13485E03 3.41960E04 M2
0.0736 1.00000
5.60834EC00 2.18191EC00 3.13296E01 2.77407E02 3.23429E03 4.21111E04 M3
0.0736 1.00000
6.27241EC00 2.20456EC00 3.21048E01 3.32612E02 5.02599E03 5.74792E04 M4
0.0016 1.00000
4.80058EC00 3.32464EC00 2.80331E01 1.81929E02 6.39701E04 2.65036E04 M5
0.0016 1.00000
5.17738EC00 3.31854EC00 3.05612E01 3.15850E02 4.03917E03 5.55743E04 N1
0.0000 1.00000
1.78978EC00 1.82892EC00 9.49832E02 1.74157E02 1.52049E03 1.01834E04 global data
Cu lsf-coefficients of K- L- M- and N-range
5.99849EC00 4.41377EC00 3.57877EC00 9.10946E01 1.19373E01 6.30051E03 9.36846EC00 2.36520EC00 7.28571E02 1.12747E01 6.87008E02 1.23671E02 0.00000EC00 0.00000EC00 0.00000EC00 0.00000EC00 0.00000EC00 0.00000EC00 0.00000EC00 0.00000EC00 0.00000EC00 0.00000EC00 0.00000EC00 0.00000EC00
Table 2. Numerical values of characteristic data computed with data in Table 1
Photon energy coh/ inc/ L3/ Ekin / µ/
1 5.0 0.006 5974 0.069 10 385 10 390
1.095 5.0 0.007 4771 0.164 8373 8378
1.097 5.0 0.007 4749 0.166 9403 9408
1.2536 5.0 0.008 3384 0.323 6830 6835
1.4866 4.9 0.011 2165 0.556 4509 4513
5 2.86 0.044 61.9 4.069 186.9 189.8
8.978 1.66 0.071 9.12 8.047 36.6 38.3
8.979 1.66 0.071 9.12 8.048 278.1 279.9
Finally, we should mention that in all of our data files, edge energies or binding energies of shells and subshells have been taken from Bearden and Thomsen’s tables26and from Cardona and Ley’s tables.27
Data files are available at http://www.ifp.tuwien.ac.at/ forschung/horst.ebel.
REFERENCES
1. Hubbell JH.X-Ray Spectrom. 1999;28: 215.
2. McMaster WH, Kerr Del Grande N, Mallett JH, Hubbell JH. Lawrence Livermore National Laboratory Report UCRL-50174, Sec. II, Rev. 1. Lawrence Livermore National Laboratory: Livermore, CA, 1969–70; see also http://ftp.esrf.fr/pub/scisoft/xop/ DabaxFiles/CrossSec McMaster.dat.
3. Shaltout A. PhD Thesis, Vienna University of Technology, 2003. 4. Scofield JH.Lawrence Livermore Laboratory Report UCRL-51326. Lawrence Livermore National Laboratory, Livermore, CA, 1973. 5. Elam WT, Ravel BD, Sieber JR.Radiat. Phys. Chem.2002;63: 121. 6. Berger MJ, Hubbell JH. NBSIR 87–3597. National Bureau of Standards: Gaithersburgh, MD, 1987; for version 3.1, 1999; see http://physics.nist.gov/PhysRefData/Xcom/Text/
XCOM.html.
7. Sasaki S.KEK Report 88-14.National Laboratory for High Energy Physics, Tsukuba, 1989.
8. Henke BL, Gullikson EM, Davis JC.At. Data Nucl. Data Tables 1993;54: 181.
9. Chantler CT.J. Phys. Chem. Ref. Data1995;24: 71.
10. Cullen DE, Hubbell JH, Kissel L. Lawrence Livermore National Laboratory Report UCRL-50400 6, Rev. 5. Lawrence Livermore National Laboratory: Livermore, CA, 1997.
11. Saloman EB, Hubbell JH, Scofield JH.At. Data Nucl. Data Tables 1998;38: 1.
12. Hubbell JH.NISTIR No.58931996.
13. Ertugrul M, Simsek ¨O, Dodan O, Turgut ¨U.J. Radioanal. Nucl. Chem. Lett.1996;213: 37.
14. Kerur BR, Thontadarya SR, Hanumaiah B.X-Ray Spectrom. 1997; 27: 45.
15. Karabulut A, Budak G, Ertugrul M.Nucl. Instrum. Methods Phys. Res. B1999;152: 202.
16. Angelone M, Bubba T, Esposito A.Appl. Radia. Isotopes2001;55: 505.
17. Chantler CT, Tran CQ, Barnea Z, Paterson D, Cookson DJ, Balaic DX.Phys. Rev. A2001;64: 2506.
18. Mallikarjuna ML, Appaji Gowda SB, Krishnaveni S, Gowda R, Umesh TK.Nucl. Sci. Eng.2002;140: 96.
19. Suzuki IH, Saito N.J. Electron Spectrosc. Relat. Phenom.2002;123: 239.
20. Sch¨afer E. PhD Thesis, Vienna University of Technology, 1993. 21. Reilman RF, Msezane A, Manson ST.J. Electron Spectrosc. Relat.
Phenom.1976;8: 389.
22. Tanuma S, Powell CJ, Penn DR.Surf. Interface Anal.1991;17: 911. 23. Tanuma S, Powell CJ, Penn DR.Surf. Interface Anal.1991;17: 927. 24. Tanuma S, Powell CJ, Penn DR.Surf. Interface Anal.1993;20: 77. 25. Ebel H, Svagera R, Ebel MF, Werner WSM. Adv. X-Ray Anal.
2001;44: 380.
26. Bearden JA, Thomsen JS. InAmerican Institute of Physics Handbook (3rd edn. McGraw-Hill: New York, 1972; 7–96.