Vítor José Bernardes Crispim
Licenciado em Ciências da Engenharia Química e Bioquímica
Study of structural and dynamic properties
of alpha-synuclein
Dissertação para obtenção do Grau de Mestre em
Engenharia Química e Bioquímica
Orientador: Dr. Frédéric Halgand, Researcher, Université
Paris-Sud
Co-orientador: Dr. Ana Aguiar Ricardo, Professora
Catedrática, FCT-UNL
Júri
Presidente: Prof. Doutor Mário Fernando José Eusébio
Arguente: Prof. Doutor José Ricardo Ramos Franco Tavares
Vogal: Prof. Doutora Ana Isabel Nobre Martins Aguiar de Oliveira Ricardo
Vítor José Bernardes Crispim
Licenciado em Ciências da Engenharia Química e Bioquímica
Study of structural and dynamic properties of
alpha-synuclein
Dissertação para obtenção do Grau de Mestre em
Engenharia Química e Bioquímica
Orientador: Dr. Frédéric Halgand, Researcher, Université Paris-Sud
Co-orientador: Dr. Ana Aguiar Ricardo, Professora Catedrática, FCT-UNL
Júri
Presidente: Prof. Doutor Mário Fernando José Eusébio
Arguente: Prof. Doutor José Ricardo Ramos Franco Tavares
Vogal: Prof. Doutora Ana Isabel Nobre Martins Aguiar de Oliveira Ricardo
Study of structural and dynamic properties of alpha-synuclein
Copyright Vítor José Bernardes Crispim, FCT/UNL, UNL
A Faculdade de Ciências e Tecnologia e a Universidade Nova de Lisboa têm o direito, perpétuo e sem limites
geográficos, de arquivar e publicar esta dissertação através de exemplares impressos reproduzidos em papel ou
de forma digital, ou por qualquer outro meio conhecido ou que venha a ser inventado, e de a divulgar através de
repositórios científicos e de admitir a sua cópia e distribuição com objetivos educacionais ou de investigação, não
Acknowledgements
My time at the NOVA University of Lisbon has come to an end, and I may now admit that the years spent here have been the most arduous, stressful, but also, funnily enough, best I have had so far. I am fully aware that I may never again experience what I did while being a part of this institution, and I have to therefore give my thanks to the university as a whole, but also, to key people that without whom, I would never have succeeded as I did in writing this thesis.
To my family, and more importantly, to my mother, the main enabler to the time I was able to spend in this project, and the one that always believed in me and in my capabilities no matter what,
throughout the entire time of my master’s degree.
To my tutor, Dr. Frédéric Halgand, of Université Paris-Sud, for the great knowledge, teaching, patience, and of course, allowing me to work as part of his project, and for helping me be a part of the great research group that is RISMAS.
To my instructor, Dr. Ana Aguiar Ricardo, of Faculdade de Ciências e Tecnologias, that despite the distance we were from each other during the development of this project, was always available for me when I needed help to share her expertise, or to simply give news on how the work was going.
To Dr. Guillaume van der Rest, of Université Paris-Sud for all the help and great expertise provided throughout the internship period, and also for allowing me to be a part of the research group.
To Drs. Human Rezeai, Davy Martin, and Jan Bohl of the Institut National de la Recherche Agronomique, for all the help provided in the production of my protein.
Resumo
As doenças neurológicas estão a ganhar um papel dominante na taxa de mortalidade dos países desenvolvidos. Além disso, os tratamentos atuais para estas doenças apenas atenuam os sintomas, e não constituem uma solução definitiva para o problema. A doença de Parkinson enquadra-se no perfil descrito e é conhecida por degradar o nível de vida dos indivíduos afetados, provocando demência, dificuldades motoras, e eventualmente morte.
Muitas destas doenças são causadas por agentes patológicos conhecidos por prion-like proteins, sendo uma destas, a responsável pela doença de Parkinson, a alfa sinucleína.
Este estudo foca-se nas mudanças dinâmicas e estruturais que ocorrem na alfa sinucleína quando exposta a diferentes fatores externos. E ainda, pretende-se comparar com as mudanças ocorridas em prião quando exposto às mesmas perturbações.
Nesse sentido, estudaram-se as alterações na concentração de proteína alterando entre 0,05 M e 80 M, no pH do meio, no tipo de tampão utilizado, e ainda ao efeito de stress oxidativo. Os efeitos causados foram estudados com ajuda de espectrometria de massa, espectrometria mobilidade iónica, cromatografia de exclusão de massa, MALDI, e análise de péptidos após digestão por tripsina.
Abstract
Neurological diseases are gaining an important role in the death rate in the developed world. Besides that, the current treatments for these types of diseases only serve as a symptomatic relief, and do not serve as an actual solution for the issue. Parkinson’s Disease fits the aforementioned profile, and it is known for degrading the quality of life of the affected individuals, causing dementia, slowness of movement, and eventually death.
Many of these diseases are caused by pathological agents known as prion-like proteins, one of them being alpha synuclein, which is the one currently attributed as being responsible for Parkinson’s.
This study focuses on the dynamic and structural changes which occur to alpha-synuclein when exposed to different external factors. Moreover, this study also aims to compare the data gathered from these tests and compare it with tests already made on prion exposed to the same conditions.
With that aim, the studies were first directed to varying the protein concentrations between 0,05 M and 80 M (the same concentration range studied on prion), altering the pH of the medium, the type of
buffer utilized, and also the effect of oxidative stress. The effects caused by these changes were then studied by utilizing mass spectrometry, ion mobility spectrometry, size exclusion chromatography, MALDI, and peptide analysis after a trypsin digestion.
Table of contents
1 Introduction 1
1.1 Neurological diseases 1
1.2 Prion related neurodegenerative diseases 1
1.3 -synuclein 2
2 Objectives 7
3 Materials and methods 9
3.1 Extensive list of used reagents and other materials 9
3.2 Methods for protein production 9
3.2.1 Introduction of the plasmid into the E. coli through heat shock 9
3.2.2 Growth and induction of the E. coli cultures 10
3.2.3 Attainment and purification of the alpha-synuclein 10
3.2.4 Analysis by electrophoresis gel 10
3.2.5 Dialysis of the protein sample 11
3.2.6 Lyophilization of the protein sample 11
3.3 Methods for protein sample analysis 11
3.3.1 Calibration of the mass spectrometer 11
3.3.2 Preparation of solutions to be analyzed 12
3.3.3 Analysis of a protein sample 14
4 Results 19
4.1 Conformational landscape 19
4.2 Effect of pH 20
4.3 Effect of protein concentration 21
4.4 Effect of protein irradiation 22
5 Discussion 29
5.1 What is a conformer family? 29
5.2 Results discussion 29
5.2.1 Unmodified protein 29
6 Conclusions and future work 37
List of Figures
Figure 1.1 - Basic structure of alpha-synuclein subdivided in its 3 main regions. 3
Figure 1.2 - Proposed mechanism for alpha-synuclein's self-aggregatory pattern (adapted) 4
Figure 1.3 - Oligomeric and fibrillar alpha synuclein in a human cell (adapted) [21] 5
Figure 3.1 - Explanatory diagram on the functioning of Ion Mobility separation 14
Figure 3.2 - Spectrum of 60 uM protein in TEAA pH 3,36 16
Figure 4.1 - Mass spectrum and CF profile of alpha-synuclein in 20mM TEAA pH3,36, with 30M protein concentration, the red circles indicate the presence of dimer in the sample 19
Figure 4.2 - Distribution of conformer families by protein concentration 19
Figure 4.3 - Effect of pH in conformer family abundance in different concentrations, in TEAA (blue
representing pH 7 and orange pH 3,3) 20
Figure 4.4 – Effect of concentration in conformer family, in TEAA 21
Figure 4.5 - Chromatograms from SEC experiments with no irradiation (Témoin), 25 Gray, and 100 Gray 22
Figure 4.6 - Relative intensity of each charge state in the front, middle, and end of the monomer’s signal
wave of the Témoin sample 23
Figure 4.7 - Relative intensity of each charge state in the front, middle, and end of the monomer’s signal
wave of the 100 Gy sample 23
Figure 4.8 - Structure of the a-synuclein protein with the areas of the peptides shown in the table before
(table 4.4) highlighted 27
Figure 5.1 - Spectrum of the protein in denaturing conditions (30 M), the red Xs are placed over the peaks
relative to an unknown contaminant of 13,7 kDa 29
Figure 5.2 - Spectrum of the protein in non-denaturing conditions (30 M), the red Xs are placed over the peaks relative to an unknown contaminant of 13,7 kDa 30
Figure 5.3 - Comparison between the spectrum of alpha-synuclein in TEAA in pH 3,36 (on top) and in pH 7
(on the bottom), both 30 M 31
Figure 5.4 - Monomer (on top) and dimer (on the bottom) of the 100 Gy irradiated alpha synuclein sample 33
Figure 5.5 - Ilustration of the relative regions for "F", "M" and "E" in a signal wave 34
Figure 5.6 - Spectrum of a single monomer charge state, in the "Témoin" sample on top and on the 100 Gy
sample on the bottom 34
Figure 6.1 - Comparison between prion's and alpha-synuclein's conformational landscape 37
Figure 6.2 - Effect of protein concentration in the conformer family’s relative abundance of both prion (on
the left) and alpha synuclein (on the right) 37
Figure 6.3 - Chromatograms of the irradiation experiments for prion (on the left) with irradiation doses of
15, 25, 50, and 100 Gy together with the contraol, and for Alpha-synucelin on the right with irradaition
List of tables
Table 3.1 - Solutions created to be tested in the mass spectrometer, supposing a stock protein solution
concentration of 200 M 13
Table 3.2 - Calculation of the masses according to each peak difference 17
Table 4.1 - Errors associated with each value of concentration when calculating conformer family ratios 21
Table 4.2 - Mass changes to the monomer in irradiated and non-irradiated samples 24
Table 4.3 – Mass changes to the dimer on the irradiated samples 25
List of abbreviations and acronyms
•
-syn
–
Alpha-synuclein
•
AA
–
Ammonium Acetate
•
AD
–
Alzheimer’s Disease
•
ALS
–
Amyotrophic Lateral Sclerosis
•
CF
–
Conformer Family
•
CSD
–
Charge State Distribution
•
IDP
–
Intrinsically Disordered Protein
•
IPTG
–
Isopropyl
-D-1-thiogalactopyronaside
•
LB
–
Lysogeny Broth
•
NAC
–
Non-Amyloid
Component
•
Ni-NTA
–
Nickel-nitrilotriacetic acid
•
PD
–
Parkinson’s Disease
•
PMD
–
Protein Misfolding Disease
•
ROS
–
Reactive Oxygen Species
•
SNARE
–
Soluble NSF Attachment protein Receptor
•
SOD
–
Superoxide Dismutase
•
TEAA
–
Triethylammonium Acetate
•
Na-TFA
–
Sodium Trifluoroacetate
1
Introduction
1.1
Neurological diseases
Nowadays in the developed world, neurological diseases are gaining more and more ground as one of the main causes of death in humankind. More so in highly developed countries in which the average life expectancy is higher, meaning that as humanity as whole develops, and is able to live until older ages, this increase in lethality by brain related disorders should continue.
Neurological disorders have always been an issue to the older population, with the most common, Alzheimer’s disease, together with other types of dementia being the fifth most common cause of death in 2016. It is also the third most common when considering only high-income countries
according to the World Health Organization (WHO)1. These diseases cause death through damages to
the brain tissue that result in initial loss of functions for the patients, that manifest through losses of memory, total or partial loss of motor functions, speech impediments, among others, and with further damage in the tissues resulting in brain death.
It is also important to note that most of the countries that are part of the developed world which contains most of Western Europe together with North America are experiencing an increase in the average age of their populations. With an increase of 2,4% of the total population aged over 65 years
in European Union in the last 10 years according to EuroStat2, which can be correlated to an increase
in the standards of living that itself translates into a higher average life expectancy, but also to decreases in fertility rates. This sets the stage for an even bigger importance to the understanding of neurodegenerative diseases to the population, in order to develop preventions and also create treatments to one of the largest death risks to humankind
1.2
Prion related neurodegenerative diseases
Neurodegenerative diseases have been a growing problem in the past years for “first world” countries, a specific group of these are called protein misfolding disorders, or PMDs. These diseases are characterized by having an accumulation of amyloidogenic aggregates in different organs[1]. PMDs include some of the most common brain related diseases such as Alzheimer’s Disease (AD)[2], and Parkinson’s Disease (PD)[3], among others. Among these PMD’s, prion diseases are unique in the fact that the pathogen is a proteinaceous agent which is called a prion, that spreads the disease by
1
http://www.who.int/news-room/fact-sheets/detail/the-top-10-causes-of-death
2
propagating[4] it’s misfolding and self-aggregatory pattern to other (otherwise) healthy proteins[5], [6]. However, there has been experimental [7], [8] data supporting the prion-like hypothesis for misfolded proteins in some diseases such as the beta amyloid in AD, alpha-synuclein in PD[9], and superoxide dismutase (SOD)[10] in Amyotrophic Lateral Sclerosis (ALS)[11], [12]
The characterization of these proteins has been posing a challenge in the last few years since many of them belong to a group called intrinsically disordered proteins (IDPs), meaning that their tridimensional structure is not fixed, due to a lack of an ordered secondary structure in one or multiple regions.
1.3
-synuclein
-synuclein is a protein found in presynaptic nerve cells, and which the main purpose (if there is any) is still unknown. Rather, it might be possible that this protein is involved in many different functions in the human body, and, therefore, cannot be assigned to one specific role[13], [14]. Some of those functions include fatty acid binding, interaction with membranes, metal binding, the release of synaptic vesicles, among many others that have recently been, and are still to this date being, discovered[13], [15]. A (not extensive) list of some of these interactions between outside agents and alpha-synuclein is in annex V. Its main structure is composed of 140 amino acids and it is usually organized as an unfolded and rather disordered protein, it is part of a large group of proteins referred to as intrinsically disordered proteins [13], [16]. This protein was first discovered in 1988, expressed in the nuclear envelope of a synapse, hence the name synuclein[17].
The interest for this specific protein sparked in 1997 when it was discovered that a mutation in -synuclein was associated with Parkinson’s disease (PD) and that the aggregates that it formed were
the main component of Lewy bodies (LB), one of the main indicators for PD[16]. It has since then been thoroughly studied, both in vivo and in vitro, as both its structure and its role(s) in the human body may prove useful in the attempt to fight prion-related pathogenies.
One of the main interactions seen by this protein is that with cell membranes[18], more so those with high curvatures[15] and because of that, this protein shows a very high affinity with micelles[19]. It was even shown that -synuclein has a role in vesicle release[16], [20], [21] further deepening this interaction. Being bound to a membrane also seems to play a role in the -synuclein’s structure, it was
Figure 1.1 - Basic structure of alpha-synuclein subdivided in its 3 main regions.
This protein’s structure is usually subdivided into 3 distinct areas[16], [23](Figure 1.1), each having its own function and interactions with outside stimuli due to fundamentally distinct features. This provides -synuclein with a multitude of relations with other proteins, cell membranes, lipids, and even itself. The three regions that comprise -synuclein are, in order:
• The N-terminus, which comprises residues 1 through 60 and it is characterized by having the highest membrane affinity of the three[20] due to it being the most amphipathic. It also has in its sequence the repeat KTKEGV (or variations of it) four times [15]in a conservative fashion. This region of the protein shows a preference towards adopting an alpha-helical secondary structure, especially when the protein is membrane-bound;
• The Non-amyloid component, comprising residues 61 through 95, is the one responsible for most of the aggregate formations, due to it being the most prone to form hydrophobic clusters[16]. Similar to the N-terminus, it is also responsible for membrane binding. This region contains 3 other KTKEGV repeats and maintains an alpha-helical secondary structure when bound to a membrane. It can, however, also form cross -sheet structures;
• The C-terminus, comprising the final 45 residues (96 through 140), is a highly acidic and negatively charged region. This domain can form hydrophobic clusters together with the NAC region due to noticeable intra-molecular interactions between those two domains. These interactions seem to be both electrostatic, since the C terminal has a negative charge and the NAC region has a positive charge, but also through direct interaction between the two chains, possibly mediated by M116, V118, Y125, and M127[16]. This region adopts a randomly coiled structure, even when membrane-bound unlike the other two, and it is thought that it is responsible for protein-protein, as well as protein-cation bonds.
Part of this protein’s cytotoxicity comes from its natural predisposition to form aggregates,
being either oligomers, fibrils, or both. It was discovered that the majority of the protein’s neurotoxicity
The process through which -synuclein aggregates is similar to that of other amyloidogenic proteins[26], where the aggregation process starts with a nucleation step[16], [27], in which the monomers form metastable oligomeric intermediates, and to which other monomers can bind to, and form bigger aggregates: fibrils. This mechanism is schematized in figure 1.2. In this mechanism the rate-limiting step is that of the formation of proto-nuclei, the meta-stable oligomers, since it occurs randomly, but this can be accelerated if seeds are added to act as preformed intermediates to which the -synuclein monomers can bind to.
The toxicity of -synuclein in its oligomeric and fibril forms can be described by three different
proposed mechanisms: Disruption of cellular processes[28], [29], toxic gain of function, and toxic loss of function[16], [26]. One example of the first mechanism proposed for the toxicity[30] of -synuclein
is the disruption of lipid bilayers by the protein, while some oligomeric forms were able to penetrate the membrane and create channels[16], [31], [32]. The latter leads to the leakage of neurotransmitter and subsequent apoptosis[23]. In figure 1.3 is illustrated an example of how alpha synuclein in its oligomeric form can interact and disrupt a cell membrane by creating pore-like oligomers, while still retaining some of the formed oligomers in solution[33]. these oligomers are also thought to impair vesicle association, by blocking SNARE[34] dependent vesicle fusion[13], [21], [25], [31].
It is also worth noting that the most common -synuclein mutations related to PD are found in
the N-terminus of the protein’s structure, such as A30P, E46K, H50Q, G51D, A53E, and A53T, further corroborating the importance of the membrane-binding function of this protein[31], [35]. While the majority of these mutations seem to have some interaction with the aggregation propensity of -synuclein, with all but A30P, G51D, and A53E increasing this tendency to form insoluble aggregates[35], only some of these mutations appear to have direct consequences to the ability of -synuclein to bind to membranes, most notably, the A30P mutation seems to weaken the interaction between the protein and lipids, and the E46K mutation strengthens it.
Another pathway of -synuclein’s toxicity goes hand in hand with the levels of Reactive Oxygen
Species (ROS). Indeed high levels of -synuclein have been associated with the alteration of mitochondrial behavior[36], which leads to the increase of mitochondrial ROS species and subsequent dopaminergic cell death[37]. This interaction with the mitochondria seems to be mediated by the
terminus of the protein, which may mean that it binds to the membrane of the mitochondria. This could possibly mean that there’s a disturbance in the mitochondria’s dynamics and an increase to its
2
Objectives
The work that is presented in this dissertation comes as follow-up on studies made to prion proteins, in which the aim is to remake the analyses already made on prion, but on a prion-like protein, in the case of this dissertation, on -synuclein. These tests will come as a way to infer on possible properties that are shared between prion and a prion-like protein, and to answer the question: To what extent is a prion-like protein like a prion? To answer this question, the data from additional prion-like proteins must be gathered in addition to alpha synuclein.
The analyses performed involve modifications to the environment of the protein applying changes to its concentration, pH of the media, and apply oxidative stress. The objectives of this thesis are therefore as follows:
• Remake the experiments performed on prion proteins on prion-like proteins; • Compare the newly gathered data with the data already obtained for prion protein; • Draw possible similarities between prion and prion-like proteins from the results
3
Materials and methods
3.1
Extensive list of used reagents and other materials
1. Plasmid containing alpha-synuclein and kanamycin resistance expression (custom order) 2. Escherichia Coli BL21DE3
3. Lysogeny broth (produced in the laboratory) 4. Kanamycin (ThermoFisher)
5. Isopropyl β-D-1-thiogalactopyranoside (IPTG) 6. Tris(hydroxymethyl)aminomethane (TRIS) buffer 7. Triton lysis buffer
8. Nickel-nitrilotriacetic acid (Ni-NTA) resin (purchased from ThermoFisher) 9. Nickel (II) sulfate (NiSO4)
10. Binding guanidine (produced in the laboratory) 11. Elution buffer (produced in the laboratory) 12. SGX electrophoresis solution (BIO RAD) 13. Reducing solution
14. Protein size standard (BIO RAD)
15. Coomassie brilliant blue solution (produced in the laboratory) 16. Milli-Q water
17. Nitrogen (obtained from purified atmospheric air) 18. Sodium Trifluoroacetate (TFA Na) (Sigma-Aldrich) 19. Protein sample (produced in the laboratory)
20. Buffer solutions (either Ammonium Acetate or Triethylammonium Acetate, both were purchased from Sigma-Aldrich)
3.2
Methods for protein production
3.2.1 Transformation of the E. coli through heat shock
Reagents: 1, 2, and 3
Equipment: Bunsen burner; Incubator; Agarose plate; Ice container.
Procedure: Introduce 3 L of the plasmid solution into 100 L of the solution containing the E. Coli bacteria, close to a Bunsen burner. Leave the solution on ice for 45 min. Subject the solution to a temperature of 42 C for 1 min. Leave again the solution on ice for 5 min. Add 100 L of lysogeny
3.2.2 Growth and induction of the E. coli cultures
Reagents: 3, 4 and 5
Equipment: Bunsen Burner; Erlenmeyer; Incubator
Procedure: Add 0,5 L of lysogeny broth into a 3-5 L Erlenmeyer. Take a sample of the bacteria from the agarose plate and put it in the lysogeny broth while close to a Bunsen burner, afterwards, leave it at 37 C for 10 min. Add 20 mg of kanamycin to the medium. Leave the medium to rest at 37 C with agitation in the incubator until the following day. Add another 0,5 L of lysogeny broth into the Erlenmeyer (1 L total). Add 380 mg of IPTG and 20 mg of kanamycin into the medium. Leave the Erlenmeyer in the incubator at 37 C with agitation until the following day.
3.2.3 Expression and purification of the alpha-synuclein
Reagents: 6, 7, 8, 9, 10, and 11
Equipment: Centrifuge; NiNta column; Sonicator (QSonica Q700); Spectrophotometer
Procedure: Centrifuge the medium containing the bacteria at 6000 g for 10 min. Carefully dispose of the supernatant. Wash the pellet formed by the centrifugation with 50 mL of 20 mM TRIS buffer, resolubilizing it. Add 10mL of 10x triton and leave the solution at 37 C for 15 min. Leave the solution
on ice for 10 min. Sonicate the solution for 2 min (setting for 36 power with the sonicator at the lab). Centrifuge the solution for 30 min at 10000 g. Save the supernatant and carefully dispose of the pellet. Add Ni-NTA and NiSO4 to the nickel column, leave it for 2 min, then drain. Add the supernatant into
the column, leave it for 5 min, then drain. Wash the column twice with 20 mL of 20 mM TRIS buffer, each time leaving it for 5 min and then draining. Wash the column twice with 10 mL of binding guanidine, each time leaving it for 3 min and then draining. Wash the column with elution buffer (3-6 mL) repeating it as many times as deemed necessary, after each elution the OD must be measured to determine if a further elution must be performed: If an OD of under 0,4 is measured no further elutions should be performed.
3.2.4 Analysis by electrophoresis gel
Reagents: 12, 13, 14, and 15
for at least 2 min. Assemble the electrophoresis gel into its case, and into a recipient containing the SGX electrophoresis solution. Load each sample into a different chamber of the gel, leaving one of the chambers to be loaded with a protein standard. Apply a voltage of 190V for around 35 min (time may vary depending on a lot of factors, like room temperature, contents of the solution, etc., therefore, the tension should be applied until a full elution of the solutions in the gel is achieved, i.e. the tension should be removed when the front of the elution reaches the end of the gel). Remove the gel from its case and leave it in a staining solution with mild agitation until the location of the proteins is visible.
3.2.5 Dialysis of the protein sample
Reagents: 16
Equipment: Dialysis membrane
Procedure: Cut a dialysis membrane to the size needed according to the amount of sample needed to dialyze. Boil the membrane for around 10 min making sure to not allow too much contact between the heated surface of the boiler and the membrane. Load the sample into the membrane. Place the membrane in a recipient filled with Milli-Q water and leave it inside for 3 days, with a change of the water once per day.
3.2.6 Lyophilization of the protein sample
Reagents: 17
Equipment: Freeze dryer
Procedure: Place the protein sample inside a container. Freeze the sample with liquid nitrogen. Place the container in a freeze dryer for 1 day.
3.3
Methods for protein sample analysis
3.3.1 Calibration of the mass spectrometer
Reagents: 18
Equipment: Mass spectrometer; Needle; Pump
3.3.2 Preparation of solutions to be analyzed
Reagents: 19 and 20
Equipment: Micropipette; Vials
Table 3.1 - Solutions prepared to be tested in the mass spectrometer, supposing a stock protein solution concentration of 200 M
Concentration
(M)
Volume of stock protein solution
(L)
Volume of buffer solution
(L)
Volume of 5M protein solution (L)
Total sample volume
(L)
0.05 - 49.5 0.5 50
0.15 - 48.5 1.5 50
0.25 - 47.5 2.5 50
0.5 - 45 5 50
0.75 - 42.5 7.5 50
1 - 40 10 50
3 - 20 30 50
5 2.5 97.5 - 100
7 1.75 48.25 - 50
10 2.5 47.5 - 50
15 3.75 46.25 - 50
20 5 45 - 50
25 6.25 43.75 - 50
30 7.5 42.5 - 50
35 8.25 41.25 - 50
40 10 40 - 50
45 11.25 38.75 - 50
50 12.5 37.5 - 50
55 13.75 36.25 - 50
60 15 35 - 50
65 16.25 33.75 - 50
70 17.5 32.5 - 50
75 18.75 31.25 - 50
3.3.3 Analysis of a protein sample
3.3.3.1 Mass Spectrometry
MS analyzes samples by ionizing them in their gas phase, measuring afterwards their mass-to-charge ratio (m/z).
Thanks to an electromagnetic field, differently charged molecules (different values of m/z) are separated from one another, a detector then counts the number of molecules in each m/z value according to a pre-specified range. This can then be analyzed in a graphic with relative abundances for each one of the charges of the protein in the case of this study[40].
3.3.3.2 Ion Mobility Spectrometry
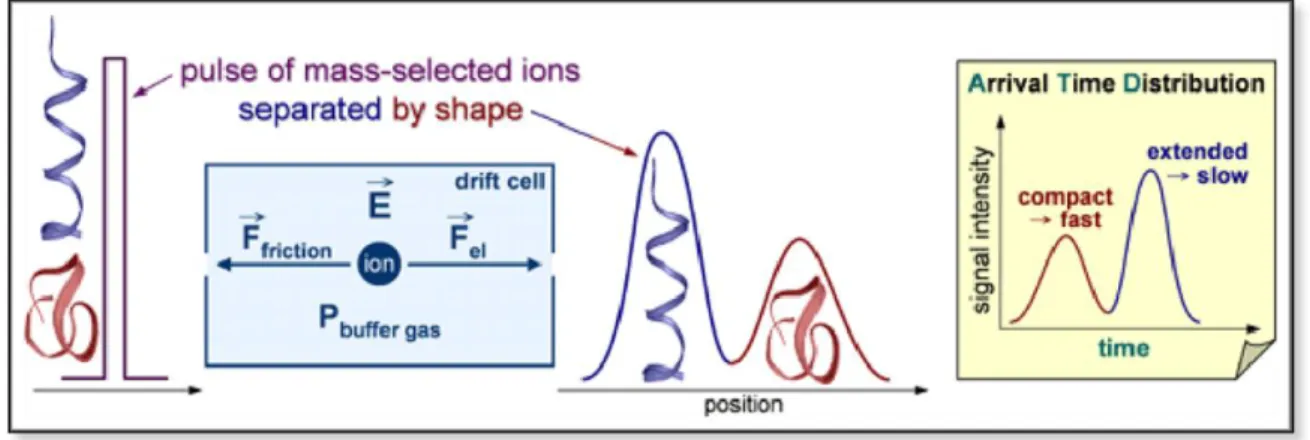
Ion mobility complements the sample analysis by differentiating molecules according to their charge, Collisional Cross Section (CCS), and size by the analysis of drift times. This process is done utilizing an inert gas (usually nitrogen or hydrogen or even a mix of both) and spraying a sample into a chamber containing these gases, the subsequent collisions incurred by this allows different molecules to behave differently and therefore be separated. Figure 3.1 serves as graphic explanation of the process occurred in ion mobility spectrometry.
Figure 3.1 - Explanatory diagram on the functioning of Ion Mobility separation
3.3.3.3 Ion mobility spectrometry – mass spectrometry coupling data treatment
To analyze the data gathered from ion mobility, the spectra obtained were opened utilizing the DriftScope software. A peak detection on the file is performed with a resolution of 2000 and a threshold detection of 2000 counts. The DriftScope software afterwards creates an Apex3D .csv file, and utilizing a home-made script that is able to extract m/z values, drift times, relative intensities, etc. An excel file is then created, from which data can be easily handled.
Reagents: 19
Equipment: Mass spectrometer; Needle; Pump
Procedure: Fill a needle with a protein sample and place the needle on a pump. Connect the pump to the mass spectrometer and start it. Begin the data collection around 2 or 3 min after the pumping has begun. To interpret the results equations 1, 2, and 3 are needed.
Starting by these two known equations:
𝑧2= 𝑧1+ 1
(Eq. 1)
(𝑚𝑧 )
𝑛=
𝑚 + 𝑧𝑛
𝑧𝑛
(Eq. 2)
A correlation between the mass of the protein and the mass-to-charge ratio of a peak is easily obtainable:
(𝑚𝑧 )
2=
𝑚 + 𝑧2
𝑧2 ⇔ (
𝑚
𝑧 )2∗ 𝑧2 = 𝑚 + 𝑧2⇔ 𝑚 = (
𝑚
𝑧 )2∗ 𝑧2− 𝑧2⇔
⇔ 𝑚 = ((𝑚𝑧 )
2− 1) ∗ 𝑧2
Taking a second peak into account and applying the new mass formula to it, the following is obtained:
(𝑚𝑧 )
1=
𝑚 + 𝑧1
𝑧1 ⇔ (
𝑚 𝑧 )1=
((𝑚𝑧)2− 1) ∗ 𝑧2+ 𝑧1
⇔ (𝑚𝑧 )
1=
((𝑚𝑧)2− 1) ∗ 𝑧2+ 𝑧2− 1
𝑧2− 1 ⇔
⇔ (𝑚𝑧 )
1∗ (𝑧2− 1) = ((
𝑚
𝑧 )2− 1) ∗ 𝑧2+ 𝑧2− 1 ⇔
⇔ (𝑚𝑧 )
1∗ 𝑧2− (
𝑚 𝑧 )1= (
𝑚
𝑧 )2∗ 𝑧2− 1 ⇔
⇔ ((𝑚𝑧 )
1− (
𝑚
𝑧 )2) ∗ 𝑧2= (
𝑚
𝑧 )1− 1 ⇔
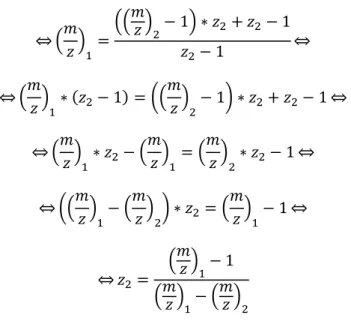
⇔ 𝑧2= (𝑚𝑧)1
− 1 (𝑚𝑧)1− (𝑚𝑧)2
(Eq. 3)
With this final equation it is possible to obtain the charge of a peak, which allows afterwards to obtain the mass of the protein utilizing equation 2.
Following this explanation on the interpretation on the resulting spectra an example on how to apply the equations to calculate masses and charges of a protein spectrum is provided, being applied to the spectrum in figure 3.2.
500 5000m/z
0 100
%
Figure 3.2 - Spectrum of 60 uM protein in TEAA pH 3,36
1100,55 1179,09 1269,72 1375,43 1500,39 1650,32 1833,59 2062,67
This specific spectrum shows 11 peaks, each corresponding to a different charge state. Each of these peaks will then have to be considered for the equation to calculate the masses, since two are needed. What will be done is the analysis of all the peaks and an average mass of the protein will be achieved this way. The result of this is shown in table 3.2.
Table 3.2 - Calculation of the masses according to each peak difference
(m/z)
1(m/z)
2z
2Rounded
z
2m
2m
2-z
21179,09
1100,55
15,000
15
16508,25
16493,25
1269,72
1179,09
13,999
14
16507,26
16493,26
1375,43
1269,72
13,002
13
16506,36
16493,36
1500,39
1375,43
11,999
12
16505,16
16493,16
1650,32
1500,39
11,001
11
16504,29
16493,29
1833,59
1650,32
9,999
10
16503,2
16493,2
2062,67
1833,59
9,000
9
16502,31
16493,31
2357,21
2062,67
8,000
8
16501,36
16493,36
2749,89
2357,21
7,000
7
16500,47
16493,47
3299,64
2749,89
6,000
6
16499,34
16493,34
4
Results
4.1
Conformational landscape
The mass spectrometry analyses performed on the prepared samples produced similar results, in regard to the fact that all presented a similar range in the charge states (between +4 and +15) and all of them showed three conformer families (Figure 4.1), which is very useful to draw comparisons between the different samples tested, respecting to different conditions, since throughout the experiments a similar conformational landscape was maintained. All the experiments were performed in the 500 to 5000 m/z range.
Changing tested conditions would produce changes to relative intensity of charge states and conformer families but, retain the same distribution in both, examples of this behavior are shown in annex, where an array of MS spectra of alpha synuclein in different concentrations, buffers and pH are displayed.
These changes in relative abundance of species are actually correlated, since lower charge states are associated with conformer families 2 and 3, while the higher ones are associated only with conformer family 1, which means that only by looking at the mass spectrum, a rough estimate of conformer family distribution can be made.
CF 3 CF 2 CF 1 CC S (Å 2 ) 250 350 450 550
4 8 12 16
z 500 5000 0 100 R el at ive a bunda nce ( % ) m/z +6 +9 +12 +15 lo g in ten si ty 4,5 5,5 6,5 7,5
4.2
Effect of pH
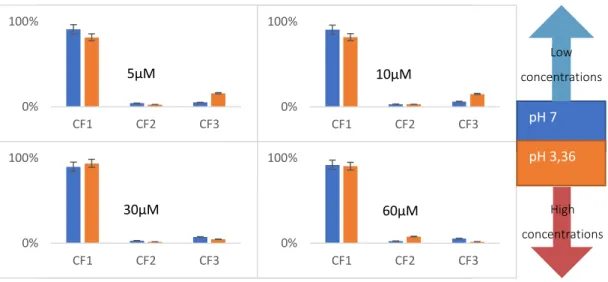
The conformational landscape was also assessed as a function of buffer pH by recording mass spectra and ion-mobility data at pH 7 and 3,3 in multiple concentrations. In the graphs of figure 4.3 it is clear the effect that it has in the relative abundance of conformer families, in lower values of protein concentration, CF3 is favored by the lower values of pH, while in higher values of protein concentration, CF3 is favored by the higher values of pH, indicating a possible role of charge networks in the conformational landscape.
0% 100%
CF1 CF2 CF3
0% 100%
CF1 CF2 CF3
0% 100%
CF1 CF2 CF3
5µM 10µM
30µM
0% 100%
CF1 CF2 CF3
60µM
Figure 4.3 - Effect of pH in conformer family abundance in different concentrations, in TEAA
0% 100%
CF1 CF2 CF3
0% 100%
CF1 CF2 CF3
0% 100%
CF1 CF2 CF3
5µM 10µM
30µM
0% 100%
CF1 CF2 CF3
4.3
Effect of protein concentration
In the graph showing the evolution of the relative abundance of each conformer family (Figure 4.4) it is noticeable the effect protein concentration has in it, more precisely, the change in concentration creates a shift in the relative abundances of conformer families of alpha synuclein, With the most abundant conformation throughout all the different tested concentrations being CF1. CF3 sees a decrease in its abundance with the increase in protein concentration, while CF1 sees an increase. The error assumed for each of the concentrations for the conformer families’ ratios is in table 4.1.
Table 4.1 - Errors associated with each value of concentration when calculating conformer family ratios
Concentration intervals (M)
< 1 1 < C < 5 > 5
Error (%) 6 2,5 1
4.4
Effect of protein irradiation
The irradiation of protein samples was afterwards performed in order to assess the effect of oxidative stress on alpha-synuclein. The irradiation of the samples was performed utilizing a cobalt
source, more specifically, a 60Co γ-source IL60PL, which generated in the protein sample hydroxyl
radicals[42], in order to simulate an oxidised cell environment[43]. The hydroxyl radicals formed by the cobalt source have an extremely small half-life, reacting almost immediately with the protein or disintegrating themselves. Different radiation doses were absorbed by each sample, which were used to tightly control the hydroxyl radicals’ concentration.
With this, four different samples were created in order to infer on the effect of different degrees of oxidation in alpha-synuclein. The samples created were, in order, “Témoin” in which no radiation
was applied, 25, 50, and 100 Gy in which the respective doses of radiation were absorbed by each sample, corresponding to 13,75; 27,5; and 55 M[44] of hydroxyl radical in each, respectively.
The chromatograms on Figure 4.5 show the different species produced when an alpha-synuclein
sample is subjected by irradiation, which simulates an organism’s oxidative stress, the sample labeled
“Témoin” (French for witness, or, in this case, control) was not subjected to irradiation, and reports only
were irradiated with either 25 Gy or 100 Gy of irradiation and in both are reported the presence of both monomer (around 20,7 min) and dimer (around 18,8 min).
m/z
m/z
m/z
F
M
E
m/z
m/z
m/z
F
M
E
Figure 4.6 - Relative intensity of each charge state in the front (F), middle (M), and end (E) of the monomer’s signal wave of the Témoin sample
Figure 4.7 - Relative intensity of each charge state in the front (F), middle (M), and end (E) of the
Figures 4.6 and 4.7 serve as an analysis of the contents in relative regions “F”, “M” and “E” of a chromatogram’s signal wave, showing an identical charge distribution.
These analyses were performed in order to assess possible effects due to protein concentration, since in different stages of the elution different concentrations of the protein are present.
Table 4.2 - Mass changes to the alpha synuclein monomer in irradiated and non-irradiated samples
Condition Masses Variations to base
Témoin
16492,64 0,00
16507,90 15,25
16525,36 32,72
25 Gy
16492,61 0,00
16507,90 15,29
16525,36 32,75
100 Gy
16492,61 0,00
16507,95 15,33
16524,87 32,25
Table 4.3 – Mass changes to the alpha synuclein dimer on the irradiated samples
In table 4.3 are displayed the mass changes that were noted on the -synuclein dimer, in this
case, only showing the ones on the irradiated samples since the dimer wasn’t present on the “Témoin”
sample. Additionally, similarly to the monomer mass increments, these are just an average and to understand their true values which are correlated to the actual mass of the adducts, further analyses will be performed, with the help of a trypsin digestion.
Condition Masses Variations to base
25 Gy
32978,89 0,00
32995,81 16,93
33010,96 32,07
33027,18 48,29
33044,97 66,08
33066,25 87,36
100 Gy
32979,94 0,00
32997,19 17,25
33012,51 32,57
33026,50 46,56
33050,04 70,10
Table 4.4 - Tryptic peptides with possible mass changes correlated to oxidation mechanism
In order to better assess the mass changes seen after irradiation a tryptic digestion was performed. With that it was hoped to achieve a cleavage of the irradiated protein samples in which the modifications were kept intact. This would cause certain peptides to keep the mass increment caused by the modifications incurred by the irradiation.
After tryptic digestion of the irradiated samples, a reverse-phase chromatography was performed in order to collect the resulting peptides. From this, table 4.4 was obtained. This table shows the peptides with the mass increments that could be correlated to oxidation mechanisms. The mass increments were calculated by using as control the peptides seen on the “témoin”, since these would not
see the same modifications. These peptides were chosen by the following criteria:
1. Matching peptides must be true tryptic peptides, including, or not, miscleavages;
2. Mass increments measured must match with known chemical modifications for simplification of data interpretation;
Figure 4.8 - Structure of the a-synuclein protein with the areas of the peptides shown in the table before (table 4.4) highlighted
The most important modified peptides were chosen according to their position in the protein’s
structure, since the modifications in the ordered regions, as seen in figure 4.8 (in red and blue) can make
5
Discussion
5.1
What is a conformer family?
The term “conformer family” has been used throughout this report, as a grouping of the same conformation of alpha synuclein in different charge states which maintains a similar (or where there is a clear ordered progression) collisional cross section. This term allows for a much clearer and more stable definition of a single conformation of alpha-synuclein while still being able to evaluate different charge states.
Additionally, a conformation of alpha-synuclein is defined as a specific folding of the protein which can be more or less compact. A change in the conformation of alpha-synuclein also changes the collisional cross section of it, as seen in graphs such as the one in figure 4.1, where it’s clearly observable that some charge states are related to other neighboring charge states, which form series of points that are here denoted as conformer families [45]
5.2
Results discussion
5.2.1 Unmodified protein
The 2 following figures (figures 5.1 and 5.2) show mass spectra of the protein, both in similar conditions (same concentration) however in different buffers since a H2O/ACN/FA buffer needs to be used to obtain the protein in its denatured form. The first one shows the protein in its denaturing conditions and the second one in its native (non-denaturing) conformation. The main change between the 2 is in the lower charge states, which seem to be favored in native conditions when compared to denaturing conditions, this last one seems therefore less prone to accept positive charges in its structure.
500 +10 +7 5000 +13 m/z
Figure 5.1 - Spectrum of the protein in denaturing conditions (30 M), the red Xs are placed over the peaks relative to an unknown contaminant of 13,7 kDa
In TEAA pH 3,36 the effect of protein concentration is very noticeable in the charge state distribution, there is a clear shift from lower charges to higher charges with the increase in protein concentration, the most noticeable ones being charge states +6 to +4 (m/z 2749,9 to 4124,3) which suffer a very clear decrease in relative abundance compared to charge states +15 to +8. This shift can be interpreted a as change of abundance of different conformer families, since these intervals are consistent with the domains of conformer families 1 and 3 as seen in the CCS vs f(z) graph of figure 4.1.
In higher concentrations it is clear the possible presence of dimer too, which would be consistent with literature data that the oligomerization of alpha synuclein occurs more easily in lower values of pH, and also possibly due to the higher concentration there could be more crowding effects which causes the protein to readily self-assemble.
500 5000
+10
+13
+7
m/z
Figure 5.2 - Spectrum of the protein in native (non-denaturing) conditions (30 M), the red Xs are placed over the peaks relative to an unknown contaminant of 13,7 kDa
1134.97 1229.46
1341.15 1475.17
1638.95
1843.70
2106.92
2457.93
2949.32
3686.34
100
%
When changing the pH of TEAA buffer to 7 the main change is in the most abundant charge state which changes from the +10 to +11, as seen in figure 5.3. This change is not consistent with the change of available positive charges which is higher in lower pH, that means that the shift occurred due
to a different factor possibly related with the protein’s structure, not just the availability of positive
charges in the medium. This may mean that the available protonation sites of the protein change with the different pH, making this factor more critical.
In a similar fashion to what happened in TEAA pH 3,36 the lower charge states (+4 to +6) are less abundant in higher protein concentrations, indicating once more a shift towards higher ones, which, again, may be due to the change in relative abundance of monomers which sees an increase in the concentration of conformer family 1 and a decrease in conformer family 3.
+10
+11
Figure 5.3 - Comparison between the spectrum of alpha-synuclein in TEAA in pH 3,36 (on top) and in pH 7
(on the bottom), both 30 M
1100.52 1179.96 1269.69 1375.40 1500.36 1650.28 1835.55 2062.62 2357.14 2749.84 3299.60 4124.23
500 5000
5.2.2 Irradiated protein
In order to analyze the irradiated samples, first, a size exclusion chromatography was performed on each one of the samples to detect their components. A problem occurred with the data collection of the 50 Gy sample and therefore the data for this sample is not shown, showing only the chromatograms
for “Témoin”, 25 Gy, and 100 Gy. The chromatogram for the Témoin (not irradiated) (figure 4.5) sample shows the presence of the alpha-synuclein monomer which exits the column at the 20,75 min mark and then only small salts which exit the column at 24,62 min, this sample will show the standard unmodified protein, therefore being the comparison basis for the other samples. The chromatogram for the 25 Gy sample shows, like the Témoin, the monomer and salts exiting the column, however it also shows in the 18,75 min mark a very faint signal corresponding the elution of alpha-synuclein dimer. Finally, the chromatogram for the 100 Gy sample, similarly to the 25 Gy one, shows first the elution of dimer (this time however with a slightly higher signal), followed by monomer, and salts at the end.
An additional analysis was performed on the irradiated samples, in which the contents of the
front (“F”) medium (“M”) and end (“E”) of a signal wave of the chromatogram were analyzed, this was done for the sole purpose of knowing if protein concentration changes under chromatographic peak promote changes in CSD were eluted at different points of the chromatography, since this was the case for the prion protein.
Figure 5.5 serves as a visual aid for the different points of the chromatogram’s wave from which the spectra were withdrawn. The results from these spectra analyses are seen in figures 4.6 and 4.7 and reveal that the contents throughout the chromatogram wave seem to be consistently the same, telling that the elution provides a constant stream of similar relative conformer family distribution monomer, not having a preferred conformational family in any point of the elution. This means that the effect of
different concentrations in the different regions of the wave does not affect the conformer family’s
ratios. This could mean that the change to concentrations occurs in a range in which the conformer
family’s ratios are relatively stable, for example around the 40-80 M concentration range, in which all the 3 conformer families maintain a steady relative value of percentage.
alpha Syn irrad 100G
m/z 500 750 1000 1250 1500 1750 2000 2250 2500 2750 3000 3250 3500 3750 4000 4250 4500 4750
%
0 100
m/z 500 750 1000 1250 1500 1750 2000 2250 2500 2750 3000 3250 3500 3750 4000 4250 4500 4750
%
0 100
180509_aSyn_100G_SEC 1224 (20.711) Sm (SG, 2x50.00); Cm (1215:1243) 1: TOF MS ES+ 3.48e5 3299.59 2749.81 2357.13 2062.59 1833.53 2755.33 3306.92 3310.94 3325.43 4124.18
180509_aSyn_100G_SEC 1115 (18.868) Sm (SG, 2x50.00); Cm (1088:1166) 1: TOF MS ES+
4.55e3 2065.87 1945.53 1837.35 1739.57 1652.26 1574.00 1500.70 1408.38 2202.73 2359.52 2541.28 2753.04 3002.61 3299.75 3060.33 4134.40 3671.24 4721.11 3299,59 1833,532062,59 2357,13 2749,81 4124,18
500
5000
500
5000
2541,28 2753,04 3002,61 3299,753671,24 4134,4 4721,11
1739,57 1837,35 1945,53 2065,87 2202,73 2359,52 1652,26 1754,00 m/z m/z
+7
+17
+13
+9
+5
+9
+6
100 100 Re la ti ve in tens it y ( % ) Re la ti ve in tens it y ( % )Figure 5.4 - Monomer (on top) and dimer (on the bottom) of the 100 Gy irradiated alpha synuclein sample Monomer
A final analysis was performed to the results obtained by the sample’s irradiation, in which the
mass increments of the spectra of both the monomer and the dimer were inspected, these served as a way to both investigate the possible effect that the irradiation had in these different alpha-synuclein structures – if they were affected in the same way or if one was more sensible. These served also as a way to discover what was causing the mass increments, if these were directly a consequence of the irradiation, or, if not, just simple adducts that bound the protein.
F E
M
Figure 5.5 - Ilustration of the relative regions for "F", "M" and "E" in a signal wave
alpha Syn irrad temoin
%
100
m/z 3200 3220 3240 3260 3280 3300 3320 3340 3360 3380 3400 3420 3440 3460 3480 3500
%
0 100
180509_aSyn_Temoin_SEC 1226 (20.745) Sm (SG, 2x50.00); Cm (1207:1244) 1: TOF MS ES+
4.89e5
3299.59
3307.00
3311.04
3325.46
The results of these analyses, first to the monomer in table 4.2, showed that this one was not affected by the irradiation, showing the same mass increments throughout the irradiated and non-irradiated samples, of around +15,3 Da and +33 Da to the base mass of the alpha-synuclein monomer. Not only these mass increments were more or less maintained throughout the irradiation experiments, they were also not mass increments correlated to oxidation mechanisms, further proving that the
monomer doesn’t seem to be affected by the irradiation. To further verify that the monomer was not affected by the sample irradiation a spectrum of a single charge state was retrieved from the “Témoin” sample and from the 100 Gy sample, as seen in figure 5.6. These two spectra show the same mass changes to the unmodified (without any adducts) monomer and in the same relative intensites as well, meaning that the adducts that were originally in the control are still found and are not changed in the irradiated sample. These results can, however, not be fully confirmed since the mass changes noted in the table come from averages done to signal waves from the spectra that were analyzed, meaning that the true mass changes which can be correlated to the actual mass of the adducts that are bound to the monomer are unknown.
The results for the mass changes of the dimer are shown in table 4.3, in which, naturally, are only shown the mass changes for the samples irradiated with the 25 Gy and 100 Gy doses since they were the only ones with dimer present. These results are more promising than the monomer ones, due to the fact that in here some of the mass changes show values which could be attributed to oxidation mechanisms (more specifically +32 Da and +48 Da corresponding to the addition of 2 and 3 oxygen atoms respectively), and also due to the fact that the dimer is possibly a direct consequence of the irradiation of the samples. These mass changes on their own have little to no meaning in the fact that it is not known if the change is in fact what we expect (an addition of an oxygen atom) since it could be any combination of adducts which creates a mass change as the one seen, and also, as it was said before, the mass changes listed come from averages of signal values meaning that the true mass changes are unknown. Additionally, it is not known where in the structure of the protein the change took place, and therefore it is possible that this change is meaningless structurally.
Therefore, after the irradiation of the samples, a digestion to the irradiated and non-irradiated samples with trypsin was performed. This digestion served one main purpose: to identify the regions that were possibly modified by the irradiation of the protein, and with this, infer on possible structure modifications caused by the irradiation.
peptides in the 100 Gy sample, one of which corresponds to the same region as the peptide in the former sample, which corroborates the importance of this one, since a modification present in a low intensity irradiation should still be seen in a higher intensity one. There are two additional peptides which correspond to the same (blue in figure 4.8) region as one another, that do not appear in the 25 Gy sample meaning that the modification of this region only occurs due to a higher dose of irradiation. And finally, a fourth one which was deemed as of less interest due to it being in a disordered region of the protein and therefore it can’t cause structural changes to the same extent as the others.
Structural changes can occur as a result of any of these modifications, since there are interactions between different regions of the protein, being them ordered or disordered any modification of any region can cause an impact to the usual behavior of the protein.
6
Conclusions and future work
Achieving the main goal of this study, which was to reproduce the analyzes performed before prion, on alpha-synuclein allowed for a comparison between the two.
Starting first on a comparison between the conformational landscape between the two, as see in figure 6.1.
Both prion and alpha-synuclein arrange themselves in conformer families (both in three distinct ones), the relative abundance of which are modulated by the protein concentration as seen in figure 6.2.
In both cases it is noted that one of the conformer families is benefited from the increase in
C C S ( Å ) C C S ( Å ) 1400 600 1000 300
5 25 5 20
lo g in ten si ty lo g in ten si ty 6.6 4.2 z z 7.2 4.4 CF3 CF3 CF2 CF1 CF2 CF1
Prion
Alpha-synuclein
Figure 6.1 - Comparison between prion's and alpha-synuclein's conformational landscape
0% 100%
0 20 40 60 80
R a ti o I n te n si ty (% )
Protein concentration (µM)
%Família 1 %Família 2 %Família 3
Prion
Alpha-syn
Figure 6.2 - Effect of protein concentration in the conformer family’s relative abundance of both prion (on the left) and alpha synuclein (on the right)
CF1 CF2 CF3
increases with protein concentration, while CF3 and CF4 decrease, and since CF1 is seemingly unaffected by this protein concentration change it is possible to affirm that CF1 in prion is an intermediate species while CF3 and CF4 are being converted to CF2 with the increase in protein concentration. A similar effect is seen in Alpha-synuclein, in which CF1’s relative abundance increases with the increase in protein concentration while CF3 decreases, and in the meantime CF2 maintains a similar relative abundance. Again, it is possible to deduce that CF3 is being converted to CF1 with CF2 as an intermediate species with the increase in protein concentration.
Finally, the effect of irradiation was compared between the two, with the chromatograms from the irradiation experiments seen in figure 6.3
In this case it was noted that the effect of irradiation was noticed in a bigger extent on prion than it was on alpha synuclein. In alpha-synuclein the irradiation didn’t seem to affect the monomer and created only small amounts of dimer. While in prion, irradiation was able to create not only dimer but also heavier oligomers and in a larger quantity as it can be seen in the signal intensity of the chromatograms.
These comparisons facilitate a parallelism between prion and a prion-like protein. By analyzing specific responses to the same perturbance in their medium it is possible to understand in what way they
18,7 5 18,87 20,74 20,75 20,71 Témoin 25 Gy 100 Gy 16,00 16,00 16,00 28,00 28,00 28,00 Time (min) Time (min) Time (min) 100 0 100 0 100 0 Si gn al in ten si ty (% ) Si gn al in ten si ty (% ) Si gn al in ten si ty (% )
Prion
Alpha-syn
Figure 6.3 - Chromatograms of the irradiation experiments for prion (on the left) with irradiation doses of 15, 25, 50, and 100 Gy together with the contraol, and for Alpha-synucelin on the right with irradaition doses of 25 and 100 Gy, together with the control.
show that alpha-synuclein doesn’t share just the self-aggregation patterns of prion, but also has other behavioral similarities.
Further studies should be made in known toxic mutations on alpha synuclein, such as the very
common A30P mutation seen in many Parkinson’s Disease patients. These tests should focus on the
7
References
[1] C. Soto, “Unfolding the role of protein misfolding in neurodegenerative diseases,” Nat. Rev.
Neurosci., vol. 4, no. 1, pp. 49–60, 2003.
[2] T. Author, J. Hardy, and D. J. Selkoe, “The Amyloid Hypothesis of Alzheimer’s Disease: Progress
and Problems on the Road to The Amyloid Hypothesis of Alzheim Progress and Problems on
the Road to,” Source Sci. New Ser., vol. 297, no. 5580, pp. 353–356, 2002.
[3] M. Iljina et al., “Kinetic model of the aggregation of alpha-synuclein provides insights into prion-like spreading,” Proc. Natl. Acad. Sci., vol. 113, no. 9, pp. E1206–E1215, 2016.
[4] J. R. Silveira et al., “The most infectious prion protein particles,” Nature, vol. 437, no. 7056, pp. 257–261, 2005.
[5] S. Prusiner, “Novel proteinaceous infectious particles causescrapie,” Science (80-. )., vol. 216,
no. 4542, pp. 136–144, 1982.
[6] S. Lee and H.-J. Kim, “Prion-like Mechanism in Amyotrophic Lateral Sclerosis: are Protein
Aggregates the Key?,” Exp. Neurobiol., vol. 24, no. 1, p. 1, 2015.
[7] J. A. Steiner, E. Quansah, and P. Brundin, “The concept of alpha-synuclein as a prion-like
protein: ten years after,” Cell Tissue Res., vol. 373, no. 1, pp. 161–173, 2018.
[8] P. Aguilar-Calvo, C. García, J. C. Espinosa, O. Andreoletti, and J. M. Torres, “Prion and prion-like
diseases in animals,” Virus Res., vol. 207, pp. 82–93, 2015.
[9] M. Masuda-Suzukake et al., “Prion-like spreading of pathological α-synuclein in brain,” Brain, vol. 136, no. 4, pp. 1128–1138, 2013.
[10] C. Munch, J. O’Brien, and A. Bertolotti, “Prion-like propagation of mutant superoxide dismutase-1 misfolding in neuronal cells,” Proc. Natl. Acad. Sci., vol. 108, no. 9, pp. 3548–3553, 2011.
[11] A. Mukherjee and C. Soto, “Prion-Like Protein Aggregates and Type 2 Diabetes,” 2017.
[12] M. A. Hanspal, C. M. Dobson, J. J. Yerbury, and J. R. Kumita, “The relevance of contact -independent cell-to-cell transfer of TDP-43 and SOD1 in amyotrophic lateral sclerosis,” Biochim. Biophys. Acta - Mol. Basis Dis., vol. 1863, no. 11, pp. 2762–2771, 2017.
[13] V. N. Uversky, “Looking at the recent advances in understanding α-synuclein and its
[14] D. P. Hong, A. L. Fink, and V. N. Uversky, “Smoking and Parkinson’s disease: Does nicotine affect
α-synuclein fibrillation?,” Biochim. Biophys. Acta - Proteins Proteomics, vol. 1794, no. 2, pp.
282–290, 2009.
[15] J. T. Bendor, T. P. Logan, and R. H. Edwards, “The function of α-synuclein,” Neuron, vol. 79, no. 6, pp. 1044–1066, 2013.
[16] L. Breydo, J. W. Wu, and V. N. Uversky, “α-Synuclein misfolding and Parkinson’s disease,” Biochim. Biophys. Acta - Mol. Basis Dis., vol. 1822, no. 2, pp. 261–285, 2012.
[17] L. Maroteaux, J. T. Campanelli, and R. H. Scheller, “Synuclein: a neuron-specific protein
localized to the nucleus and presynaptic nerve terminal.,” J. Neurosci., vol. 8, no. 8, pp. 2804–
2815, 1988.
[18] C. M. Pfefferkorn, Z. Jiang, and J. C. Lee, “Biophysics of α-synuclein membrane interactions,” Biochim. Biophys. Acta - Biomembr., vol. 1818, no. 2, pp. 162–171, 2012.
[19] W. Li, V. N. Uversky, A. K. Dunker, and S. O. Meroueh, “A computational investigation of allostery in the catabolite activator protein,” J. Am. Chem. Soc., vol. 129, no. 50, pp. 15668– 15676, 2007.
[20] I. Dikiy and D. Eliezer, “Folding and misfolding of alpha-synuclein on membranes,” Biochim. Biophys. Acta - Biomembr., vol. 1818, no. 4, pp. 1013–1018, 2012.
[21] K. J. Vargas, S. Makani, T. Davis, C. H. Westphal, P. E. Castillo, and S. S. Chandra, “Synucleins
Regulate the Kinetics of Synaptic Vesicle Endocytosis,” J. Neurosci., vol. 34, no. 28, pp. 9364–
9376, 2014.
[22] D. Eliezer, E. Kutluay, R. Bussell, and G. Browne, “Conformational properties of α-synuclein in its free and lipid-associated states,” J. Mol. Biol., vol. 307, no. 4, pp. 1061–1073, 2001.
[23] F. N. Emamzadeh, “Alpha-synuclein structure, functions, and interactions,” J. Res. Med. Sci., vol. 21, no. 2, 2016.
[24] S. Simoneau et al., “In vitro and in vivo neurotoxicity of prion protein oligomers,” PLoS Pathog., vol. 3, no. 8, pp. 1175–1186, 2007.
![Figure 1.2 - Proposed mechanism for alpha-synuclein's self-aggregatory pattern (adapted)[29]](https://thumb-eu.123doks.com/thumbv2/123dok_br/16497037.733625/27.892.118.773.366.716/figure-proposed-mechanism-alpha-synuclein-aggregatory-pattern-adapted.webp)
![Figure 1.3 - Oligomeric and fibrillar alpha synuclein in a human cell (adapted) [21]](https://thumb-eu.123doks.com/thumbv2/123dok_br/16497037.733625/28.892.152.764.105.698/figure-oligomeric-fibrillar-alpha-synuclein-human-cell-adapted.webp)