Aryl-Substituted Ruthenium(II) Complexes: A Strategy for Enhanced
Photocleavage and E
ffi
cient DNA Binding
Felipe Dio
genes Abreu,
́
†Tercio de F. Paulo,
†Marcelo H. Gehlen,
‡Ro
̂
mulo A. Ando,
§Luiz G. F. Lopes,
†Ana Cla
udia S. Gondim,
́
†Mayron A. Vasconcelos,
∥,⊥Edson H. Teixeira,
∥Eduardo Henrique Silva Sousa,
*
,†and Idalina Maria Moreira de Carvalho
*
,††
Laboratorio de Bioinorgá ̂nica, Departamento de Química Organica e Inorgâ nica, Universidade Federal do Cearâ ́, Cx. Postal 6021, 60440-900 Fortaleza, CearáBrazil
‡
Instituto de Química de Sao Carlos, Universidade de Sã o Paulo, 13566-590 Sã o Carlos, Sã o Paulo, Brazil̃
§
Instituto de Química, Universidade de São Paulo, Cx. Postal 26077, 05508-000 São Paulo, Brazil ∥
Laboratório Integrado de Biomoleculas, Departamento de Patologia e Medicina Legal, Universidade Federal do Ceará , 60441́ −750 Fortaleza, CearáBrazil
⊥
Departamento de Ciências Biológicas, Faculdade de Ciências Exatas e Naturais, Universidade do Estado do Rio Grande do Norte, 59625-620, Mossoró, Rio Grande do Norte, Brazil
*
S Supporting InformationABSTRACT: Ruthenium polypyridine complexes have shown promise as agents for photodynamic therapy (PDT) and tools for molecular biology (chromophore-assisted light inactivation). To accomplish these tasks, it is important to have at least target selectivity and great reactive oxygen species (ROS) photogeneration: two properties that are not easily found in the same molecule. To prepare such new agents, we synthesized two new ruthenium complexes that combine an efficient DNA binding moiety
(dppz ligand) together with naphthyl-modified (1) and
anthracenyl-modified (2) bipyridine as a strong ROS generator bound to a ruthenium
complex. The compounds were fully characterized and their photophysical
and photochemical properties investigated. Compound2 showed one of
the highest quantum yields for singlet oxygen production ever reported (ΦΔ= 0.96), along with very high DNA binding (log Kb= 6.78). Such
photochemical behavior could be ascribed to the lower triplet state involving the anthracenyl-modified bipyridine, which is
associated with easier oxygen quenching. In addition, the compounds exhibited moderate selectivity toward G-quadruplex DNA and binding to the minor groove of DNA, most likely driven by the pendant ligands. Interestingly, they also showed DNA photocleavage activity even upon exposure to a yellow light-emitting diode (LED). Regarding their biological activity, the compounds exhibited an exciting antibacterial action, particularly against Gram-positive bacteria, which was enhanced upon blue LED irradiation. Altogether, these results showed that our strategy succeeded in producing light-triggered DNA binding agents with pharmacological and biotechnological potential.
■
INTRODUCTIONPhotodynamic therapy (PDT) is an important strategy against cancer because it is a noninvasive intervention that uses visible light to enhance the action of a photosensitizer drug in the tumor region. Thus, PDT provides temporal and spatial selectivity for cancer treatment.1 The chemical and optical characteristics of many photosensitizers preclude their effective
use in tumor-tissue treatment.2It is therefore important tofind
new light-active molecules that can effectively generate reactive
oxygen species (ROS), such as singlet oxygen (1O
2).
Ruthenium(II) polypyridine complexes may be tuned to exhibit suitable optical properties (e.g., long-wavelength bands, strong absorptivity) along with high quantum yield for1O
2formation,
allowing their possible use in PDT. The triplet metal-to-ligand
charge-transfer (3MLCT) state of [Ru(bpy)
3]2+ can be
quenched by molecular oxygen to generate 1O
2;1 however,
the low DNA binding affinity of [Ru(bpy)
3]2+ makes this
molecule a nonselective agent, and this has limited its further application. Ruthenium and dppz-based metallointercalators have proven to be powerful molecular light-activated switches for binding and detecting DNA but with a significant drop in
ROS generation. Two classical intercalators, [Ru-(bpy)2(dppz)]2+ and [Ru(phen)2(dppz)]2+ (where bpy =
2,2′-bipyridine, dppz = dipyrido [3,2a:2,3-c]phenazine, and phen = phenanthroline), have been extensively investigated by Barton and colleagues3−5
using spectroscopic techniques. For
molecular recognition of specific DNA sequence
(G-quad-Received: May 2, 2017 Published: July 20, 2017
ruplexes, B-DNA, Z-DNA, mismatches, CC- and GC-rich sequences, etc.), the metallointercalators, in general, present a well-defined symmetry and rigid structure.5In order to enhance
DNA binding and selectivity to certain DNA sequences, e.g., G-quadruplexes, B-DNA, mismatches, CC- and GC-rich sequen-ces, etc., the shape and size of the ancillary ligands can be important and should be exploited.5−11
Chromophore-assisted light inactivation (CALI) is another useful strategy to study biological systems, and it has employed organic dyes and ruthenium(II) tris(bipyridine) complexes as ROS generators. This tool requires linkage of the ruthenium(II) complex to an antibody to provide selectivity, enabling interaction with a specific protein that will be inactivated upon light generation of
1O 2.10
In this study of visible-light-induced DNA photodamage, we have explored the influence of the ancillary ligands on DNA
binding and ROS generation. For this purpose, we synthesized and characterized two RuIIdppz-based complexes with naphthyl and anthracenyl aromatic groups appended to the bipyridine ancillary ligand. The structures of complexes1and2are shown
inFigure 1.
■
EXPERIMENTAL SECTIONPhysical Measurements. Absorption spectra of dilute solutions (5×10⁻⁵ mol L−1) were measured with a Hewlett-Packard model
8453 spectrophotometer, and the steady-state emission and excitation spectra were recorded using a PTI Quanta-Master QM-40 fluorescence spectrophotometer. Emission quantum yields were calculated relative to [Ru(bpy)3]2+ in methanol (Φem = 0.045).
Luminescence decays were recorded with a laser spectrometer by time-correlated single-photon counting using a TC900 counting board from Edinburgh Instruments as described elsewhere.12 Lifetimes were evaluated by the reconvolution procedure usingFASTsoftware from Edinburgh Instruments. Kinetic analyses of the decays were fit to biexponential decay functions:I(t) =I0[a1exp(−t/τ1) +a2exp(−t/τ2),
whereI(t) is the signal intensity as a function of time,I0is the intensity
at long time,anis a preexponential factor that represents the relative contribution from thenth component to the initial emission intensity, and τn is the lifetime of the nth component. All solutions were deoxygenated with argon for at least 10 min prior to measurements.
1H NMR spectra were obtained in the designated solvents on a Bruker
(300 MHz) spectrometer. Electrochemical data were obtained by cyclic voltammetry using an Epsilon potentiostat [Bioanalytical Systems Inc. (BAS), West Lafayette, IN] at 25 ± 0.2 °C. The
measurements were performed in a single-compartment glass cellfilled with deaerated (argon-purged) acetonitrile containing a tetra-N-butylammonium perchlorate (0.1 mol L−1) electrolyte solution and
equipped with glassy-carbon working, platinum-wire auxiliary, and Ag/ AgCl pseudoreference electrodes. All of the potentials described in this study were reported versus Ag/AgCl electrodes, which, under the given experimental conditions, gave a value of 0.54 V for the ferrocene/ferrocenium couple.
Materials. Acetonitrile, 2-aminoanthracene (anth), 2-aminonaph-thalene (naph), tetrafluorboric acid, 1,3-diisopropilcarbodiimide, 4,4′ -dimethyl-2,2′-bipyridine, selenium dioxide, 1-hydroxybenzotriazole hydrate, N-methylmorpholine, ethidium bromide (EB), Hoechst 33258, methyl green, ruthenium(III) chloride hydrate, and ruthenium trisbipyridine chloride from Aldrich Co, methanol from Mallinckrodt, and sulfuric acid and trifluoracetic acid from Merck were all used as received. Acetone (Mallinckrodt) was treated with sodium sulfate and then distilled and stored over 4 Å molecular sieves. Dimethylforma-mide (DMF; Merck) was distilled under reduced pressure at 75°C, kept dry, and stored over 4 Å molecular sieves. Diethyl ether (Synth) was treated with metallic sodium and then distilled twice before use. Calf-thymus DNA (CT-DNA; stored at 4°C) was purchased from Sigma-Aldrich. DNA oligomers 5′-G3(T2AG3)3- 3′ (HTG21), the
complementary cytosine-rich strand 5′-C3(TA2C3)3-3′(ssDNA), the
CC mismatch ssDNA 5′-ATCACACCGAACACTCC-3′, and the
complementary strand 3′-TAGTGTGCCTTGTGAGG-5′ were pur-chased from IDT, Inc. Single-stranded extinction coefficients were calculated from mononucleotide data using a nearest-neighbor approximation. The preparations of G-quadruplex, single-stranded, matched, and mismatched DNA were carried out as follows: the oligonucleotide samples, dissolved in different buffers, were mixed when necessary (matched and mismatched DNA), heated to 90°C for 5 min, spontaneously cooled to room temperature, and then incubated at 4°C overnight. Buffer A: 10 mmol L−1Tris-HCl, pH 7.4. Buffer B: 10 mmol L−1Tris-HCl, 100 mmol L−1KCl, pH 7.4. Stock solutions
were stored at 4 °C and used after no more than 4 days. Further dilution was made in the corresponding buffer to the required concentrations for all of the experiments.
Syntheses. 4′-Methyl-2,2′-bipyridine-4-carboxylic acid (mbpy-OH),13 4′-methyl-N-(anthracen-2-yl)-2,2′-bipyridine-4-carboxyamide
(mbpy-anth), and 4′-methyl-N-(naphthalen-2-yl)-2,2′ -bipyridine-4-carboxyamide (mbpy-naph),14 and dipyrido[3,2a:2,3-c]phenazine (dppz)9 were prepared following the procedure described in the literature.
[Ru(bpy)(dppz)(L)](PF6)2 Complexes. The precursor complex cis-[Ru(bpy)(dppz)Cl2]·3H2O was synthesized according to the literature
procedure.9,15 Then, [Ru(bpy)(dppz)(L)](PF6)2 complexes were
prepared as follows: 100 mg (0.163 mmol) ofcis-[Ru(bpy)(dppz)Cl2]
and 0.163 mmol of L (mbpy-anth or mbpy-naph) were dissolved in 30 mL of a solution of water/ethanol (1:1) and kept under stirring and refluxed for 8 h. This mixture was concentrated by rotary evaporation and loaded onto a silica gel column, which was eluted with DMF/ methanol (1:1). An orange running band was collected containing the desired complex, which was dried by rotary evaporation, dissolved in a minimum volume of DMF, and precipitated by adding a few drops of concentrated NH4PF6, followed by the addition of anhydrous diethyl
ether. The precipitate was filtered off, washed with an excess of anhydrous ether, and dried under vacuum. Spectroscopic data for the mixture of geometric isomers of1.1H NMR [Figure S1; (CD
3)2SO]:δ
10.94−10.85 (2H, NH), 9.69−9.61 (4H, H2dppzand H11dppz), 9.30−
9.24 (2H, H3a), 8.97−8.83 (4H, H5′bpyand H4′bpy), 8.58−8.50 (4H,
H5dppz and H8dppz), 8.45−8.37 (2H, H3′a), 8.36−8.31 (2H, H6a),
8.29−8.17 (12H, H4dppz, H9dppz, H6′bpy, H3′bpy, H6dppz, and H7dppz),
8.16−8.11 (2H, H5a), 8.08−8.01 (4H, H3dppz and H10dppz), 8.01−
7.95 (4H, H4bpy, H1b), 7.95−7.88 (2H, H3bpy), 7.88−7.82 (4H, H3b
and H4b), 7.82−7.75 (2H, H8b), 7.75−7.71 (2H, H6′a), 7.67−7.60 (2H, H5b), 7.58−7.55 (2H, H5′a), 7.55−7.44 (4H, H7b and H6b), 7.55−7.37 (2H, H5bpy), 7.32−7.26 (2H, H6bpy), 2.61 and 2.53
(6H,CH3). IR: ν(CO) amide 1667 cm−1 Anal. Calcd for
C50H45F12N9OP2Ru·3H2O: C, 49.76; H, 3.42; N, 10.44. Found: C,
49.72; H, 3.39; N 10.41. Spectroscopic data for the mixture of
geometric isomers of2.1H NMR [Figure S2; (CD
3)2SO]: 11.00−
10.94 (2H, NH), 9.70−9.63 (4H, H2dppz and H11dppz), 9.29−9.27
(2H, H3a), 8.98−8.85 (4H, H4′bpyand H5′bpy), 8.69−8.65 (2H, H6a), 8.63−8.59 (2H, H5a), 8.58−8.51 (4H, H5dppzand H8dppz), 8.36−8.32
(2H, H3′a), 8.28−8.23 (4H, H4dppz and H9dppz), 8.23−8.18 (4H,
H6dppz and H7dppz), 8.18−8.13 (4H, H6′bpyand H3′bpy), 8.12−8.01
(4H, H3dppzand H10dppz), 8.00−7.97 (2H, H4b), 7.96−7.91 (4H, H1b
and H3b), 7.88−7.83 (2H, H6′a), 7.81−7.75 (4H, H6b and H9b), 7.72−7.68 (2H, H5′a), 7.67−7.60 (4H, H7b and H8b), 7.55−7.46 (4H, H5b and H10b), 7.43−7.37 (2H, H5bpy), 7.31−7.27 (2H, H6bpy),
2.61−2.54 (6H, CH3). IR:ν(CO) amide 1668 cm−1. Anal. Calcd for C54H37F12N9OP2Ru·3H2O: C, 51.68; H, 3.29; N, 10.05. Found: C,
51.55; H, 3.32; N, 9.93. Measurement of1O
2Photogeneration.
1,3-Diphenylisobenzo-furan (DPBF) was chosen to measure the quantum yield of 1O 2
generation by the ruthenium complexes. DPBF is fluorescent and reacts selectively with1O
2 to produce a nonluminescent product. A
series of 2 mL air-saturated ethanol solutions containing DPBF (20
μmol L−1) and the complexes were prepared in a 1 cm path length
fluorescence cuvette and illuminated with LED light of 463 nm (Basetech Conrand, 1.7 W) for 100 s. The consumption of DPBF by reaction with 1O
2 was followed by monitoring of the fluorescence
intensity decrease at the emission maximum (λex= 405 nm;λemmax= 479
nm) at different irradiation times. The quantum yield of the triplet state (ΦΔ) for 1O2 generation by the [Ru(bpy)3]2+ complex in
air-saturated ethanol,ΦΔ= 0.84, was taken as a reference.16
DNA Binding and Photocleavage Studies.DNA titrations were followed by electronic absorption spectroscopy. A constant concen-tration of the ruthenium complexes (10μmol L−1, respectively) was
mixed with varying DNA concentrations (0−40 μmol L−1 in
nucleotide base pairs) in 10 mmol L−1 of Tris buffer (pH 7.4).
After each addition of DNA into the solution containing the ruthenium complex, the mixture was allowed to equilibrate at 25°C for 5 min, after which the absorption and emission readings were recorded.
Binding to small oligonucleotide sequences was used to investigate interactions with G-DNA quadruplex (HTG21), single-stranded DNA (ssDNA), stranded (dsDNA), and mismatched double-stranded DNA (CCmis). These oligos were prepared as described before and their concentrations measured by their absorbance at 260 nm. Binding studies were conducted by titrating 5μmol L−1DNA with
complex1or2in 10 mmol L−1Tris-HCl buffer (pH 7.4) at 22°C and
following the fluorescence emission. Free complex 1or 2 was also titrated without DNA as a control for the basalfluorescence signal. The total volume added during titration did not exceed 1% of the initial volume of the mixture in the cuvette, and so there was no requirement for dilution correction. All of the data were collected at least in duplicate and fit to a single binding equation using Prism software withR2at least above 0.97.
Investigations on the intercalation and type of groove binding mode were done using EB, methyl green, and Hoechst agents, versus the metal complexes as competitors, in 10 mmol L−1Tris-HCl (pH 7.4) at
22°C. These measurements used Calf thymus DNA (CT) at 10μmol L−1along with 5
μmol L−1 of EB, methyl green, or Hoechst, which
were titrated with metal complex 1 or 2 and monitored by
fluorescence spectroscopy. All of the data were collected at least in duplicate andfit to a single binding equation usingPrismsoftware, and an apparent dissociation constant (appK
d1) was obtained. The appKd1
values for metal complexes1and2were used to estimate Kd (Kd1)
using eq 1, considering a simple competition, where L is the concentration of the DNA binding agent (EB, methyl green, or Hoechst) andKdL is their dissociation constant, as reported in the
literature. Controls without DNA were treated as described above to evaluate any quenching event with EB, methyl green, and Hoechst.
= +
K K (1 L K/ L) app
d1 d1 d (1)
Gel electrophoresis was done in triacetate ethylenediaminetetraa-cetate (TAE) buffer for the investigations of DNA photocleavage. These experiments used supercoiled pBR322 DNA (21μmol L−1in a
nucleotide base pair) in 10 mmol L−1Tris-HCl buffer (pH 7.4), which
was mixed with ruthenium complex and irradiated or incubated in the dark. The samples were analyzed after electrophoresis in agarose gels (0.8% w/v in TAE buffer, pH 8.0) stained with EB (1μg mL−1, 1 h), and the data were documented using a Gel Doc XR+ System (Biorad). Irradiation experiments were carried out using LED Basetech Conrand, 1.7 W (λemmax= 463, 520, and 592 nm).
Computational Studies.All DFT calculations in this study were performed using the Gaussian 09 program package, revision A.02 (Gaussian Inc., Wallingford, CT).17 The geometries of complexes
1
and2were optimized at the density functional theory (DFT) level by means of the B3LYP functional.18−20
The 6-31G(d) basis set was used for C, H, O, and N atoms, and the LANL2DZ relativistic effective core potential basis set was used for the Ru atom. Optimized geometries in a minimum of the potential energy were confirmed by the absence of any imaginary frequency in vibrational analysis calculations.
On the basis of the optimized geometries, time-dependent DFT (TD-DFT) was applied to investigate the electronic properties of the complexes and simulate the absorption spectra. TD-DFT calculations were carried out in acetonitrile solvent fields by means of the polarizable continuum model.21 The molecular orbital composition, UV−vis spectra, and assignment of principal transitions were extracted using theMultiwf n22andGaussSum 3.023programs, respectively.
Antibacterial Activity.Microorganisms and Culture Conditions. The bacteria used in this study includedStaphylococcus aureusATCC
25923, Staphylococcus epidermidis ATCC 12228, Pseudomonas
aeruginosa ATCC 10145, and Escherichia coli ATCC 11303. These strains were stored in Tryptic Soy Broth (TSB) with 20% (v/v) glycerol at−80°C. They were inoculated in Tryptic Soy Agar (TSA) plates and incubated aerobically at 37°C for 24 h. After growth on agar plates, individual colonies were removed and inoculated in 10 mL of a fresh TSB medium and incubated for 24 h at 37°C under steady agitation. Prior to each antibacterial assay, thefinal cell concentration was adjusted to 1×10⁶colony-forming unit (cfu) mL−1.
Antibacterial Assay.The susceptibility of the bacteria to ruthenium complexes was evaluated by the minimum inhibitory concentration (MIC) and minimum bactericidal concentration (MBC) of the complexes. The MIC values were determined according to the National Committee for Clinical Laboratory Standards M7-A6 (NCCLS, 2003), with some modifications. Briefly, the compounds were diluted in ultrapure sterile water at concentrations ranging from 3.9 to 500 μg mL−1 and dispensed into 96-well plates, with each
bacterial suspension (1×10⁶ cfu mL−1) in TSB. These plates were
submitted to irradiation with blue LED for 1 h or kept in the dark and then incubated overnight at 37°C. The MIC was determined to be the lowest compound concentration that completely inhibited visible bacterial growth. For the measurement of MBC, 10μL was removed from each well, where no visible bacterial growth was observed, plated Table 1. Spectroscopic and Electrochemical Properties of Complexes 1 and 2a
E, V vs Ag/AgCl
complex λabs, nm (ε×104, mol L−1cm−1) E1/2(RuIII/II) Ox Red1 Red2 Red3 Red4
1 227 (31), 281 (42), 360 (1.75), 458 (2.2) 1.35 −0.71 −0.97 −1.48 −1.72 2 257 (52), 276 (54), 360 (1.8), 460 (2.7) 1.33 1.30 −0.96 −1.61 −1.78
3 284 (10.4), 320 (2.14), 359 (1.75), 370 (1.72), 445 (1.63)b 1.29c −0.98c −1.40c −1.63c
4 285 (8.71), 323 (sh), 345 (sh), 452 (1.45)c 1.31d −1.27d −1.46d −1.73d
onto TSA plates, and incubated at 37°C. The MBC was considered to be the lowest antibacterial concentration of the compound for which colony growth was not observed.
■
RESULTS AND DISCUSSIONCharacterization of Ruthenium Complexes.
Spectro-scopic and electrochemical studies were carried out to characterize two new complexes,1and2, which were compared to [Ru(bpy)2dppz]2+(3) and [Ru(bpy)3]2+(4) complexes. The
cyclic voltamograms for complexes 1 and 2 measured in an
acetonitrile electrolyte are illustrated inFigure S3, and the data are summarized in Table 1. The half-wave potentials (E1/2) assigned to the RuIII/IIredox pair of1and2were determined as
1.35 and 1.33 V versus Ag/AgCl, respectively; these were consistent with other ruthenium(II) polypyridine com-plexes.9,11,24 However, complex 2 presented an additional oxidation process at ca. 1.30 V. A similar process was assigned to anthracene oxidation by Padilla et al.25
Regarding the reduction processes, complexes 1 and 2
exhibited thefirst processes at−0.71 and−0.96 V, respectively.
For complex 2, the potential is close to the first reduction
potential of complex 3,11and this suggests that the reduction process mainly involves the dppz ligand, which is more easily reduced than bpy.9 On the other hand, the first reduction
process of 1 was significantly less negative. Only the second
reduction process of1(−0.97 V) was indeed very close to the reduction potential of dppz found in2. So, on the basis of these redox potentials, we can suggest that the lowest unoccupied
molecular orbital (LUMO) of 1 resides most likely in the
naphthalene moiety, while the LUMO of2resides on the dppz ligand.9,11,26The other reduction potentials observed for both
complexes were assigned to bipyridine reduction processes, along with processes involving reduction of the naphthalene (naph) and anthracene (anth) moieties.
To study the electronic properties of 1 and 2, DFT
calculations were carried out. According to the DFT results, illustrated in Figures S4−S6, the highest occupied molecular orbitals (HOMOs) of1 and2 were located in π(naph), with the d(Ru) contribution and anth moiety, respectively. The LUMOs of1and2resided in the dppz and bpy-naph ligands, respectively. As can be ascertained from these results, DFT predictions corroborated with the aforementioned electro-chemical discussion, supporting the first reduction process
being on dppz for2 and on bpy-naph for1.
The electronic absorption spectra for the complexes in acetonitrile (Figure 2) showed high-energy transition bands
between 200 and 350 nm, which correspond to π → π*
transitions within the bpy and dppz ligands and a broad band around 460 nm associated with metal-to-ligand charge-transfer
(MLCT). The maximum MLCT band of3 (λmax= 440 nm)16
was blue-shifted compared to complexes1and2, likely because of the lack of inductive effects from functionalized bipyridines.
The spectroscopic data are shown in Table 1, which also
includes data for complexes3and4. Electronic transitions for the complexes were investigated using the time-dependent DFT (TD-DFT) approach. TD-DFT results suggested the contribution of singlet metal-to-ligand charge-transfer
(1MLCT) and metal−ligand-to-ligand charge-transfer
(1MLLCT) transitions in the high-energy bands between 200
and 350 nm, besidesπ→π*transitions [intraligand (IL) and
ligand-to-ligand charge-transfer (LLCT)] within the pendant aromatic ligands. Additionally, these calculations reinforced the
finding that the low-energy absorption resulted mainly from an
MLCT. The calculated spectra, excitation wavelengths, and oscillator strengths for selected transitions are presented in
Figure S7 and Table S1, respectively.
It is known that compound3exhibits a so-called light-switch effect attributed to the occupation of two separated excited
states, a luminescent“bright”state (BS) and a nonluminescent “dark” state (DS), depending on the local solvent environ-ment.16,30,31The BS is stabilized in aprotic solvents, whereas
the DS dominates in protic solvents. It was proposed that the lowest-energy emissive state for this compound arises from
3MLCT transition from ruthenium(II) to the phenanthroline
moiety of the dppz ligand, whereas the nonemissive state is localized on the phenazine moiety of the same ligand.1,3,16,30,31
There might be another low-lying electronic state for
complexes 1 and 2 that has a role in the photophysical
behavior, the3MLCT state localized on the modified bipyridine
with the amide group. An energy stabilization of about 0.5−2
kcal mol−1 was observed for ruthenium tris(bipyridine)
complexes linked to anth and naph by an amide bridge.32For
complex1, a weak luminescence was observed in water, while complex2remained completely nonluminescent. Otherwise, in acetonitrile both complexes showed emission with a maximum
at 645 nm (Figure 2) and exhibited similar luminescence
lifetimes (τ= 229 ns for1andτ= 225 ns for2). The emission quantum yields, however, were 0.040 and 0.006 for1 and2, respectively. These data indicate that the emission of1and2in an aprotic solvent is from a3MLCT state that is
photophysi-cally similar to that of the [Ru(dcbpy)2(mbpy-naph)]2+ and
[Ru(dcbpy)2(mbpy-anth)]2+ as reported previously.14 Thus,
the relaxation to the ground state occurs from the3MLCT state
localized on the bpy modified with the naph or anth moieties.
The lower quantum yield observed for2 was assigned to the
luminescence quenching of the ruthenium3MLCT because of
the low-lying ππ*triplet state of the anth ligand (1600 cm−1
below ruthenium 3MLCT).33,34 Otherwise, for 1 (Φ
em =
0.040), the energy transfer from3MLCT to theππ*triplet state
of the naph ligand was not observed because of the higher energy of this state. The emission quenching observed in a water solution is due to the DS localized on the phenazine moiety that is stabilized relative to the MLCT state corresponding to the charge-transfer state from the RuII ion
Figure 2.Absorption (solid line) and emission (dashed line) spectra in acetonitrile (5×10⁻⁵mol L−1) at 293 K of (
to the bpy-L ligand. A diagram depicting these states is shown
inFigure 3.
DNA Binding Measurements.DNA Titration Monitored
by Electronic Absorption Spectroscopy. DNA binding constants (Kb) were estimated by the changes in the UV−vis
absorption spectra promoted by DNA addition to the ruthenium complexes (Figure 4). Indeed, during a gradual addition of CT-DNA, the MLCT band at 460 nm and the IL band at 280 nm became red-shifted to 473 and 290 nm, respectively; in addition, a decrease in their intensities was
observed. The hypochromism,H(%), for the MLCT bands of
the complexes varied 23% for1and 20% for2.Equation 2was used to obtain the binding affinity of the metal complexes for
DNA (Figure 5a,b, insets).35
ε −ε ε −ε
= b− b − K s K
( )/( )
[ ( 2 [Ru][DNA]/ ) ]/2 [Ru]
a f b f 2
b2 1/2 b (2)
where b= 1 + Kb[Ru] + Kb[DNA]/2s, εa, εf, and εb are the apparent, free, and bound metal complex extinction coefficients,
respectively, and s is the binding size. The intrinsic binding constants were calculated as 6.83 (±0.3)× 106L mol−1 (s =
1.1) and 6.04 (±0.2) × 106 L mol−1 (s = 0.8) for 1 and 2,
respectively. These values are typical for DNA intercalation processes and agree well with the classic intercalator3(Kb= 3.2
× 106 L mol−1).36 It is worth noting that the DNA binding
constants for both complexes are slightly higher than those for 3(Kb= 3.2×10⁶L mol−1) and [Ru(phen)2(dppz)]2+(Kb= 5.1 × 10⁶ L mol−1).37,38
Other measurements using competitors
such as EB and Hoescht were also consistent with those values, as described below. The higher binding constant is probably due to an increased π density from ancillary-functionalized ligands, which contribute to the interaction with DNA.
DNA Binding in Competition with EB.EB is a well-known DNA intercalator that has been used as a competitor probe to investigate new DNA intercalating agents. A maximum
fluorescence emission for EB is achieved upon binding to
DNA, which should exhibit its minimum upon complete
displacement of the EB−DNA adduct. This lower emission
should, in principle, be identical with a sample of EB without DNA, validating complete displacement. To evaluate the
displacement of EB from the EB−DNA adduct, we carried
out titrations of the metal complexes 1 and 2 in a mixture containing 3μmol L−1of EB and 10μmol L−1of CT-DNA in
10 mmol L−1Tris buffer (pH 7.4), which were monitored by
fluorescence. A decrease in the EB emission was observed
during the addition of complex1 or2, supporting the theory that a competition process was taking place (Figure S8).
These data were analyzed and fit to a single binding curve
(R2> 0.98), where the apparent dissociation constant (appK d)
was obtained. Additionally, a competition equation (eq 1in the
Experimental Section) was used to estimate the actual Kd for
DNA binding of both complexes, using aKdvalue of 0.1μmol
L−1for EB (K
b= 1×10⁷).39Interestingly, theKdvalues for1
and2, obtained usingeq 1, were 0.106 and 0.177μmol L−1,
respectively, which were reasonably close to the binding constants measured by UV−vis as reported above [UV−visKd
of 0.146μmol L−1(1) and 0.166μmol L−1(2)]. Nevertheless,
caution must be exercised in analyzing those values because complexes1and 2, upon binding to DNA, also emit close to the EB maximum emission band. Thus, a decrease in EB due to displacement did not lead to a full emission drop because the complexes themselves also contribute to the emission. However, these measurements supported that DNA binding of these complexes follows an intercalative mode.
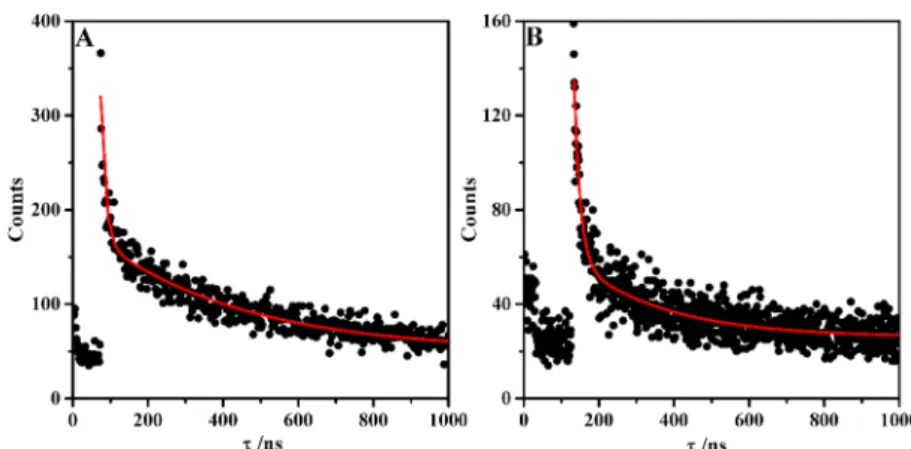
Effect of DNA on the Emission Lifetime. The excited-state lifetimes of1and2were determined with CT-DNA. Although only a weak luminescence was observed in water for complex1, upon the addition of CT-DNA, the luminescence intensity increased. Complex2 was nonluminescent in water like3 but also presented emission after CT-DNA addition1,16 (Figure
Figure 3.Schematic energy diagram of excited states of1and2: GS, ground state; BS, bright state; DS, dark state.
Figure 4.DNA titration monitored by UV−vis absorption changes of1(a) and2(b) in the presence of an increasing amount of salmon DNA (0− 35μmol L−1). [Ru] = 10μmol L−1. Inset: Plot of (ε
S9). Both complexes also exhibited biexponential decay (Figure
5). The measured decay time components and respective
normalized contributions were 18.3 ns (0.57) and 426 ns (0.43) for1 and 6.5 ns (0.86) and 160 ns (0.14) for2. These results were indicative that intercalation was the predominant binding mode with CT-DNA. This could be due to rigidity in the system upon binding to DNA, thus increasing the luminescence average lifetime of the complexes. The longer decay component may be ascribed to the intercalated ruthenium complex stabilized in the DNA (head-on mode),40−42and the short component (side-on mode) could
be related to relaxation of the prompt MLCT excited state formed upon excitation and its quenching by water or photoinduced charge migration to the DNA.
Binding to G-Quadruplex, Double-Stranded, and Single-Stranded DNA Structures. The interaction of the ruthenium complexes with distinct DNA structures was also investigated via emission spectroscopy using small oligonucleotides. A human telomeric single sequence (HTG21) can generate a G-quadruplex (G4) structure with K+, and this was chosen for this
investigation. There is great interest in investigating G-quadruplex DNA because of its widespread presence in the
human genome and its importance in gene regulation.43 A
major effort has been conducted to identify selective
G-quadruplex binding molecules for use in detection and
therapy.44,45 Besides the G-quadruplex DNA, we also
investigated how well the metal complexes would bind to single-stranded (ssDNA), double-stranded (dsDNA) DNA and also to single mismatches in double-stranded DNA (ds_misD-NA). All of these measurements were carried out using 5μmol L−1DNA in 10 mmol L−1Tris buffer (pH 7.4), which were
titrated with complex 1 or 2. For G-quadruplex DNA
measurements, we also included 100 mmol L−1KCl to induce
its formation.
Interestingly, complex1 showed a measurable luminescence even without DNA, as mentioned earlier, which is in contrast to other dppz-bound ruthenium complexes often described as light switches.1,24 On the other hand, complex 2 showed no emission at all in the absence of DNA but showed a strong emission upon DNA addition. For both compounds, however, the relative emission was significantly enhanced in the presence
of the oligonucleotide sequences studied. In all cases, compared
to complex 2, complex 1 exhibited better emission upon
binding to DNA (Figure 6). Both complexes showed the
following trend regarding the maximum emission upon DNA
binding: dsDNA∼ds_misDNA > ssDNA∼G4, where binding
to double-stranded DNA led to the strongest emission, and1 emitted ca. 5-fold higher than2. The strongest emission was quite similar for matched and mismatched sequences, suggesting that the complexes cannot recognize single-stranded DNA mistakes. It is important to note that maximum emission cannot be directly used as a criterion for a stronger thermodynamic stability, which was clearly observed below during binding studies (Figure 6).
All titrations carried out were analyzed using a single binding equation, and the dissociation constants are reported (Figure
S10andTable 2). Interestingly, complexes1and2showed not
much difference in the Kd values for binding to these DNA
structures, as would have been expected from their differences
in the maximum emission (Figure S10 and Table 2). In
particular, for the G-quadruplex (G4-DNA), 1 and 2 showed
the strongest binding with Kd values of 6.0 (±0.3) and 2.8
(±0.1) μmol L−1, respectively. Interestingly, as revealed by
these dissociation constants, complex2binds 2.2-fold better to Figure 5.Time-resolved luminescence of1(a) and2(b) in the presence of CT-DNA in 50 mM Tris-HCl (pH 7.4). [Ru] = 12μmol L−1and
CT-DNA = 200μmol L−1in base pairs.
G4-DNA than complex 1. This trend was also noticed for stranded DNA (3.5-fold) and single-mismatch double-stranded DNA binding to2(2.0-fold), whereas for binding of
the complexes to single-stranded DNA, the Kd values were
identical (Table 2). Complex1bound 7.7-fold stronger to G-quadruplex than to double-stranded DNA, despite having a 5-fold lower maximum emission upon binding. There was an overall better binding of these DNA structures to complex2. Because the structural difference between1and2is due to one
additional aromatic ring in compound2, these bindings may be a consequence of stronger π-stacking and/or favorable steric orientations.
In summary, this quantitative study further supports that a complex can strongly interact with a DNA sequence but not necessarily reveal itself as an efficient luminescent probe. These
results also support the theory that there is an exciting potential application in cancer therapy for these compounds based on
their efficient interaction with G-quadruplex DNA, which
deservers further investigation.
Groove Binder Investigations.Because polypyridine ruthe-nium complexes can usually bind to DNA, either through intercalation, groove binding, or a combination of these modes,4,5 we have investigated this behavior for complexes1 and2using sodium iodide and two selective minor and major groove binder compounds, Hoechst and methyl green.
The groove binding preference can be exploited using NaI as an anionic luminescence quencher for ruthenium complexes, as
described elsewhere.4 Iodide can quench the ruthenium
complex bound to the DNA, providing information about the degree of protection caused by DNA polyanion regions. B-DNA shows quite distinct regions, where the major groove is more accessible than the minor groove. This makes us expect a more efficient quenching process by I−if the complex binds to
the major groove. Nonquenching KCl salt was also added, along with our complexes, to maintain a constant ionic strength and also evaluate ionic effects. Interestingly, no significant
luminescence change was caused by either KCl or NaI (Figure S11). This behavior was further validated using3as a control,
where there was also no significant luminescent change.
Remarkably, this behavior was different for 3 as reported
elsewhere, which might be due to the different DNA employed.
Lim et al. reported this type of study for 3 using small
oligonucleotide sequences.4 It is not unusual to find reports
where quite distinct binding was noticed for ruthenium complexes depending on the DNA sequence. Besides that, a greater number of accessible sites for binding and distinct sequences in a larger DNA might lead to a more reliable study of groove interactions than a shorter sequence. Currently, there is a well-established understanding that 3 binds to the minor groove.46 This behavior has been supported by solved X-ray structures.47−49Our results here also suggest that3binds to the
minor groove of DNA, where a lower accessibility would prevent major quenching. This interpretation can also be drawn for complexes1and2, suggesting that they interact with DNA also via the minor groove (Figure S11). This result indicated that the aryl pendent complexes might not alter the binding modes to DNA.
To validate this binding mode further, we carried out a competition experiment using methyl green and Hoechst as two selective major and minor groove binders, respectively.50,51 The luminescence intensity of Hoechst bound to CT-DNA decreased significantly upon the addition of1and2(Figure 7),
indicating the preference of both complexes for the minor groove, in agreement with the previous iodide study. The apparent Kd values calculated for complexes 1 and 2 during
competition with Hoechst were 1.2 and 2.1 μmol L−1,
Table 2. DNA Binding Measurements for Complexes 1 and 2
Kd(μmol L−1)
DNA structure complex1 complex2 G-quadruplex 6.0 2.8 single-stranded 12.9 10.7 double-stranded 46.1 13.0 single-mismatch double-stranded 31.4 15.5 calf-thymus 0.146a 0.166a
0.106b 0.177b
0.050c 0.095c
aUV−vis measurement.bLuminescence measurement in competition with EB.cLuminescence measurement in competition with Hoechst. All measurements were repeated at least twice.
respectively. By using eq 1and Hoechst binding to CT-DNA (Kdof 0.140 μmol L−1), we estimatedKdvalues of 0.050 and
0.095μmol L−1, suggesting that1competes slightly better than
2 against Hoechst for DNA. This result supported other
measurements of binding to CT-DNA, where complex1 was
slightly better than 2. As an additional control, 3 was also employed in this experiment, where it was observed to compete well against Hoechst for binding to DNA with an estimatedKd
value of 0.72 μmol L−1. This behavior supported the finding
that the unmodified ruthenium complex also bound mainly
through the minor groove, as reported in the literature.4,5,42All attempts to displace methyl green with complex 1 or 2 were unfruitful, with a minimum decrease in thefluorescence signal
during titration, implying that no binding occurs in the major groove (Figure S12). These results indicate that the aryl pendent complexes also bind to the minor groove of DNA and both complexes are stronger binders than3.
1O
2 Generation. The quantum yields for 1O2 generation
(ΦΔ) by the ruthenium complexes were measured from the
reaction of1O
2with DPBF, a highly efficient1O2scavenger.52,53
The consumption of DPBF in an ethanol solution was monitored by its emission intensity decrease at 460 nm. As shown in Figure 8, plots of ln(It/I0) as a function of the
irradiation time were linear for all photosensitizers tested (I0
andItare thefluorescence intensities of DPBF before and after
irradiation, respectively). For comparative purposes, we
measured ΦΔ of the classic intercalator 3 under the same
conditions. The 1O
2 generation quantum yield of the
photosensitizers investigated was determined according to eq 3:52
κ
κ
Φ =Δ Φ
s s (3)
where κ is the slope of first-order plots, κs is related to the
standard sensitizer (4), and Φs is its 1O
2quantum yield. The
values of ΦΔ was calculated using the linear regression data
from Figure 8and eq 2, employing 4 as the standard (ΦΔ =
0.84).16
The 1O
2 quantum yields were 0.96 for 2 and 0.66 for 1,
which were much higher than the value observed for3(0.29). Thus, the pendant moieties, especially anth, provided an efficient channel to generate1O2via excitation at 405 nm (blue
LED). This result implied potential applications in 1O
2
-generation processes, such as photocleavage of DNA. The better result shown for2was assigned to the fact that its excited state is almost dominated by the triplet state of anth, as discussed before. The excitation in the1MLCT band of2also
populated the triplet excited state of anth, which, in turn, serves as an energy reservoir extending the relaxation time for the
3MLCT state,52,54
but also being more external allows easier
oxygen bimolecular interaction. This enhancement on 1O
2
production was similar to that reported14 for the complex
[Ru(dcbpy)2(mbpy-anth)]2+ under the same experimental
conditionsΦΔ= 0.76, where it had remarkably increased 1O 2
production of [Ru(dcbpy)2(mbpy-COOH)]2+.
To evaluate the ability of these complexes to damage DNA, we used a circular DNA, the plasmid pBR322, and monitored thefluorescence response. Because the luminescence signal of
the dppz-based ruthenium complexes increased upon inter-calation as shown before, we could also assume that after irradiation the bound DNA complexes would generate ROS that might cleave the plasmid in solution. After DNA photocleavage, the dppz ligand becomes more exposed to water molecules, and therefore the luminescence signal should decrease with the irradiation time. We reasoned that, by using this approach, it might be possible to demonstrate a Figure 8.DPBF consumption (at 20μmol L−1) as a function of the
irradiation time (blue LED) in an air-equilibrated ethanol solution, with and without ruthenium complexes, as indicated (λex= 409 nm).
Figure 9.Photocleavage of 20μmol L−1(in base pair) pBR322 DNA in the presence of1and2at different concentrations in the dark and after 1 h
of irradiation with LEDs. For all conditions, lane 1 has a linear DNA ladder and lane 2 has only pBR322 DNA, while lanes 3−6 and 7−10 contained the following concentrations of 0.3, 3.0, 7.0, and 15μmol L−1for complexes1and2, respectively. In panel A, samples were kept in the dark, and in
relationship between the ability of the complexes to produce
1O
2and the luminescence signal of the Ru-DNA system upon
irradiation (blue LED,λirr= 463 nm). Accordingly, the complex containing the anthracene moiety presented the largest decrease of luminescence during blue-light irradiation (Figure S13). Therefore, the order of the luminescence decrease was complex2>1>3, which corroborated with the1O
2quantum
yield measured.
Electrophoresis of DNA Photocleavage Products.To verify any DNA damage as a consequence of binding and ROS generation, suggested before by thefluorescence, we performed
agarose gel electrophoresis of the pBR322 DNA under light irradiation (blue LED,λirr= 463 nm; green LED,λirr= 520 nm;
yellow LED, λirr = 592 nm). As one control, we used the
intercalator 3 under the same conditions (Figure S14). The control lanes without any complex showed undamaged supercoiled pBR322 plasmid (form I;Figure 9A−D, lane 2). There was also no distinct cleavage of pBR322 in the presence
of 3 (Figure S11), either in the dark or upon irradiation.
Additionally, complexes1and2incubated in the dark (Figure
9A, lanes 3 and 7) showed no evidence of DNA cleavage.
However, these complexes at higher concentrations showed smeared bands from the forms I and II. These smeared bands can result from the formation of intercalated adducts between DNA and complexes, as reported elsewhere.54,55By contrast,
during light irradiation, both complexes promoted a quite distinct effect on the DNA pattern in the agarose gel, compared
to 3. These data support the expectation that the pendant ligands employed here indeed had a critical role in the DNA damage.
Interestingly, light irradiation with blue and green LED for 1 h showed DNA photocleavage (Figure 9B,C). Unfortunately, irradiation with yellow LED caused only moderate DNA
photocleavage. A possible explanation for efficient DNA
photocleavage promoted by 1 and 2 could be the extension
of DNA−metal complex interaction and/or the higher yield in
ROS production. Both complexes 1 and2 showed enhanced
1O
2production compared to3. The production of1O2assayed
by DPBF (Figure 8) also supported the increased
photo-cleavage activity for1and2.
A mechanistic study was carried out to investigate the possible reactive species causing DNA photodamage, where blue-light irradiation was employed. As shown in Figure 10
(lanes 5 and 10), NaN3had a strong protective effect on the
DNA photocleavage caused by complexes1and2, suggesting
that both complexes cleave DNA mostly by producing1O 2as a
radical product. These data also agree with1O
2detection using
DPBF (Figure 8). Particularly for complex 1, catalase also interfered significantly with photodegradation of the plasmid
DNA (Figure 10, lane 7), indicating that peroxide might have a subtle involvement in the photodamage process as well. These results point to a mechanism involving mainly1O
2,56suggesting
mechanisms of types I and II for complex 1 and type II for complex2.
Altogether, these results and the measurement of 1O
2
generation support the idea that DNA degradation might be mainly mediated by this radical. Interestingly, a correlation graph of1O
2generation versus DNA binding showed that our
new complexes combined these highly suitable properties
(Figure 11), where compound2had the highest1O
2quantum
yield along with the strongest DNA binding.
Antibacterial Activity. Metal-based complexes have been
exploited as a novel scaffold for the development of new
antimicrobial agents.57−60 One promising antimicrobial
strat-egy, also known as photodynamic antimicrobial therapy, has relied on the photogeneration of ROS, where some ruthenium complexes have been used.61This process would cause broader damage on many biomolecules (e.g., DNA), leading to Figure 10.Investigation of ROS using scavengers. Photocleavage of 20μmol L−1(in bp) pBR322 DNA in the presence of1(7μmol L−1),2(7μmol
L−1), and ROS scavengers after 1 h of irradiation with blue LED (463 nm). Lane 1: linear DNA ladder. Lane 2: pBR322 DNA alone. Lane 3:1alone.
Lanes 4−7:1with the following ROS scavengers (at 300 mmol L−1):
D-mannitol, NaN3, SOD (20 u), and catalase (20 u). Lane 8:2alone. Lanes 9−
12:2with the following ROS scavengers (at 300 mmol L−1):
D-mannitol, NaN3, SOD, and catalase.
Figure 11. Correlation of DNA binding and 1O
2 production for
complexes1(logKb= 6.83;ΦΔ= 0.66),2(logKb= 6.78 ;ΦΔ= 0.96),
3(inverted triangle; logKb= 6.74;ΦΔ= 0.29),4(solid circle; logKb=
3 ;ΦΔ= 0.84), [Ru(dcbpy)2(mbpy-naph)]2+(open square; logKb=
3.17 ;ΦΔ= 0.55), and [Ru(dcbpy)2(mbpy-anth)]2+(open circle; log
microbial death. A series of ruthenium-based complexes have been reported to have enhanced antibacterial activity upon light irradiation, which is associated with ROS generation.
We investigated whether our complexes would exhibit any antimicrobial activity either in the dark or upon light
irradiation. The MIC and MBC of complexes 1−3 were
assayed against bacterial populations ofS. aureus,S. epidermidis,
P. aeruginosa, and E. coli, as summarized in Table 3. These bacteria were also chosen as afirst attempt to sample
Gram-positive and Gram-negative bacteria.
In general, the antibacterial effect was stronger when the
compounds were irradiated with a blue LED light for 1 h before the plates were incubated (Table 3). Interestingly, complexes1
and 2 showed reasonably good antimicrobial activity even
without light irradiation, supporting the idea that the pendant ligands might bring additional activity. Maybe their better interaction with DNA and single-stranded structures leads to activity. This is particularly interesting compared to the
unmodified ruthenium complex, where a complete lack of
activity was noticed in the dark. Nonetheless, other ruthenium intercalating complexes showed antimicrobial activity also in the dark.62
In this study, complexes 1−3, when irradiated with blue
LED, showed strong DNA binding and generation of 1O
2
(Figure 7andTable 2). Interestingly, our antibacterial results
suggested a possible association to 1O
2 generation because
complex 1 showed lower values of MIC and MBC than 2,
followed by 3. Moreover, complexes 1 and 2 induced DNA
photocleavage when irradiated with blue LED, but not in the dark (Figures 8 and 9). Altogether, these results support a possible relationship between 1O
2 generation, DNA
degrada-tion, and antibacterial activity.
Beyond this photoactivity, all of the compounds tested were only effective against Gram-positive bacteria. This seems to be a
general trend noticed for many other ruthenium(II) complexes used in antimicrobial assays.63−66
Smith et al.64 showed that only upon light irradiation the complexcis-[Ru(bpy)2(INH)2]2+
exhibited antibacterial activity against the Gram-positive bacterium B. subtilis,, but it was inactive against the Gram-negative bacteriumE. coli. Bolhuis et al. also reported a series of intercalator ruthenium complexes with activity only on Gram-positive bacteria (B. subtilisandS. aureus) but none in Gram-negative (E. coli).62 In contrast to those results, Lei et al.
reported great photoactivity for 3 against the Gram-negative
bacterium E. coli.66 However, in our hands, neither our
complexes nor3showed any measurable antimicrobial activity. This could be, in part, due to differences in the sensitivity of the
E. coli strains used for those investigations (E. coli JM109), which differed from ours.
According to Li et al.,59 the antibacterial activity of their ruthenium complexes can be described as a function of the lipophilicity, charge, and charge separation. The differences in
the structures and compositions of the membranes and cell walls of Gram-positive and Gram-negative bacteria could also explain our results. Indeed, Malik et al.67 reported that 1O
2
could be effective in killing bacteria, but this action is
dependent on a close association with the bacterial membrane. Thus, the outer membrane present in Gram-negative bacteria can constitute an additional barrier that inhibited the antibacterial effect of the ruthenium complexes and prevented
their side products from causing cell death. This could be a reason for the lack of activity in Gram-negative bacteria because our antimicrobial activity is also associated with1O
2generation.
■
CONCLUSIONSOur previous approach of coupling a pendant anthracenyl and naphthyl group onto ruthenium(II) bipyridine complexes showed promising enhancement of DNA damage due to better generation of ROS in comparison to an nonmodified complex.
A low DNA binding of those complexes, however, limited their selectivity and efficiency as DNA targeting agents. On the basis
of these observations, we surmised that a combination of those pendant agents with better DNA binding ruthenium complexes, such as3, could result in a much more efficient photonuclease
agent. Indeed, the incorporation of the organic chromophores naphthalene and anthracene strongly influenced the quantum
yield for 1O
2 production along with the selectivity for DNA
binding. This strategy succeeded in that complexes1and2can bind very well to DNA, including G-quadruplex DNA, and maintain high1O
2generation (Figure 9). The combination of
good quantum yield for1O
2production together with selective
DNA binding is highly sought out as a route to improving the biological activity, including light-triggered gene knockdown (CALI). DNA degradation was promoted even by yellow LED: an important result that supports the potential use of these
complexes as PDT agents. Moreover, complexes 1 and 2
showed promising antibacterial activity on Gram-positive bacteria, following the same order as that of 1O
2 generation
and DNA binding. The antibacterial activity of these
compounds was significantly enhanced with blue LED
irradiation, supporting their potential use as PDT agents.
■
ASSOCIATED CONTENT*
S Supporting InformationThe Supporting Information is available free of charge on the
ACS Publications website at DOI:
10.1021/acs.inorg-chem.7b01108.
1H and COSY 1H NMR, cyclic voltamograms, DFT
molecular orbital energy levels and diagrams, UV−vis Table 3. Antibacterial Activity of Ruthenium(II) Complexes
on Gram-Positive and Gram-Negative Bacteria (Values in
μmol L−1)
Gram-positive Gram-negative
complex irradiationblue LED aureusS. S. epidermidis
P. aeruginosa
E. coli 1 ON MICa,b 6.7 6.7 − −
MBCc 6.7 6.7 − −
OFF MIC 13.3 6.7 − − MBC 13.3 13.3 − − 2 ON MIC 6.4 25.6 − − MBC 6.4 25.6 − − OFF MIC 6.4 102 − − MBC 12.8 102 − − 3 ON MIC 7.9 31.6 − − MBC 7.9 31.6 − −
OFF MIC − − − −
MBC − − − −
aMinimum inhibitory concentration.bMIC and MBC are expressed in
μg mL−1. (−) Activity not detected even at the highest concentration
(complex1, 0.85μmol L−1= 1.00μg mL−1; complex2, 0.82μmol L−1
= 1.00μg mL−1; [Ru(bpy)
2dppz](PF6)2, 1.01 μmol L−1 = 1.00 μg
spectra calculated by TD-DFT, emission spectroscopic data, DNA and oligonucleotide structure binding curves,
photocleavage of DNA monitored by fluorescence and
electrophoresis, and table for selected calculated singlet excited-state transitions for complexes (PDF)
■
AUTHOR INFORMATIONCorresponding Authors *E-mail: [email protected]. *E-mail: [email protected].
ORCID
Rômulo A. Ando: 0000-0002-3872-8094
Eduardo Henrique Silva Sousa:0000-0002-0007-8452
Idalina Maria Moreira de Carvalho:0000-0002-2168-3950 Notes
The authors declare no competingfinancial interest.
■
ACKNOWLEDGMENTSThe authors thank the CENAPAD-UFC for computer facilities, CENAUREN-UFC for the acquisition of NMR spectra, Adolfo I. B. Romo (UFC) for NMR discussion and interpretation, and the Brazilian agencies CAPES, FUNCAP (Grant PRONEX PR2-0101-0030.01.00/15), and CNPq (Grant 303732/2014-8 to L.G.F.L. and Grant 312030/2015-0 to E.H.S.S.).
■
REFERENCES(1) Knoll, J. D.; Turro, C. Control and Utilization of Ruthenium and Rhodium Metal Complex Excited States for Photoactivated Cancer Therapy.Coord. Chem. Rev.2015,282-283, 110−126.
(2) Wachter, E.; Heidary, D. K.; Howerton, B. S.; Parkin, S.; Glazer, E. C. Light-Activated Ruthenium Complexes Photobind DNA and are Cytotoxic in the Photodynamic Therapy Window. Chem. Commun.
2012,48, 9649−9651.
(3) Hartshorn, R. M.; Barton, J. K. Novel Dipyridophenazine Complexes of Ruthenium(II) - Exploring Luminescent Reporters of DNA.J. Am. Chem. Soc.1992,114, 5919−5925.
(4) Lim, M. H.; Song, H.; Olmon, E. D.; Dervan, E. E.; Barton, J. K. Sensitivity of Ru(bpy)(2)dppz(2+) Luminescence to DNA Defects. Inorg. Chem.2009,48, 5392−5397.
(5) Zeglis, B. M.; Pierre, V. C.; Barton, J. K. Metallo-Intercalators and Metallo-Insertors.Chem. Commun.2007, 4565−4579.
(6) Tan, L. F.; Chao, H. DNA-Binding and Photocleavage Studies of Mixed Polypyridyl Ruthenium(II) Complexes with Calf Thymus DNA.Inorg. Chim. Acta2007,360, 2016−2022.
(7) Chen, X.; Gao, F.; Zhou, Z. X.; Yang, W. Y.; Guo, L. T.; Ji, L. N. Effect of Ancillary Ligands on the Topoisomerases II and Tran-scription Inhibition Activity of Polypyridyl Ruthenium(II) Complexes. J. Inorg. Biochem.2010,104, 576−582.
(8) Patel, K. K.; Plummer, E. A.; Darwish, M.; Rodger, A.; Hannon, M. J. Aryl Substituted Ruthenium Bis-Terpyridine Complexes: Intercalation and Groove Binding with DNA. J. Inorg. Biochem.
2002,91, 220−229.
(9) Liu, J. G.; Zhang, Q. L.; Shi, X. F.; Ji, L. N. Interaction of Ru(dmp)(2)(dppz)(2+) and Ru(dmb)(2)(dppz) (2+) with DNA: Effects of the Ancillary Ligands on the DNA-binding behaviors.Inorg. Chem.2001,40, 5045−5050.
(10) Sato, S.; Morita, K.; Nakamura, H. Regulation of Target Protein Knockdown and Labeling Using Ligand-Directed Ru(bpy)(3) Photo-catalyst.Bioconjugate Chem.2015,26, 250−256.
(11) Liu, J. G.; Ye, B. H.; Li, H.; Ji, L. N.; Li, R. H.; Zhou, J. Y. Synthesis, Characterization and DNA-Binding Properties of Novel Dipyridophenazine Complex of Ruthenium(II): Ru(IP)(2)(DPPZ) (2+).J. Inorg. Biochem.1999,73, 117−122.
(12) Lauer, M. H. D.; Drekener, R. L.; Correia, C. R. D.; Gehlen, M. H. Fluorescence from Bisaryl-Substituted Maleimide Derivatives. Photochem. Photobiol. Sci.2014,13, 859−866.
(13) McCafferty, D. G.; Bishop, B. M.; Wall, C. G.; Hughes, S. G.; Mecklenberg, S. L.; Meyer, T. J.; Erickson, B. W. Synthesis of redox derivatives of lysine and their use in solid-phase synthesis of a light-harvesting peptide.Tetrahedron1995,51, 1093−1106.
(14) Abreu, F. D.; Diógenes, I. C. N.; Lopes, L. G. F.; Sousa, E. H.; de Carvalho, I. M. M. Ruthenium(II) Bipyridine Complexes with Pendant Anthracenyl and Naphthyl Moieties: A Strategy for a ROS Generator with DNA Binding Selectivity.Inorg. Chim. Acta2016,439, 92−99.
(15) Liska, P. V. N.; Vlachopoulos, N.; Nazeeruddin, M. K.; Comte, P.; Gratzel, M. cis-Diaquabis(2,2′-bipyridyL4,4′ -dicarboxylate)-Ruthenium(II) Sensitizes Wide Band Gap Oxide Semiconductors very Efficiently over a Broad Spectral Range in the Visible. J. Am. Chem. Soc.1988,110, 3686−3687.
(16) Tanielian, C. W. C.; Wolff, C.; Esch, M. Singlet Oxygen Production in Water: Aggregation and Charge-Transfer Effects.J. Phys. Chem.1996,100, 6555−6560.
(17) Frisch, M. J. T., G, W.; Schlegel, H. B.; Scuseria, G. E.; Robb, M. A.; Cheeseman, J. R.; Scalmani, G.; Barone, V.; Mennucci, B.; Petersson, G. A.; Nakatsuji, H.; Caricato, M.; Li, X.; Hratchian, H. P.; Izmaylov, A. F.; Bloino, J.; Zheng, G.; Sonnenberg, J. L.; Hada, M.; Ehara, M.; Toyota, K.; Fukuda, R.; Hasegawa, J.; Ishida, M.; Nakajima, T.; Honda, Y.; Kitao, O.; Nakai, H.; Vreven, T.; Montgomery, J. A., Jr.; Peralta, J. E.; Ogliaro, F.; Bearpark, M. J.; Heyd, J.; Brothers, E. N.; Kudin, K. N.; Staroverov, V. N.; Kobayashi, R.; Normand, J.; Raghavachari, K.; Rendell, A. P.; Burant, J. C.; Iyengar, S. S.; Tomasi, J.; Cossi, M.; Rega, N.; Millam, N. J.; Klene, M.; Knox, J. E.; Cross, J. B.; Bakken, V.; Adamo, C.; Jaramillo, J.; Gomperts, R.; Stratmann, R. E.; Yazyev, O.; Austin, A. J.; Cammi, R.; Pomelli, C.; Ochterski, J. W.; Martin, R. L.; Morokuma, K.; Zakrzewski, V. G.; Voth, G. A.; Salvador, P.; Dannenberg, J. J.; Dapprich, S.; Daniels, A. D.; Farkas, Ö.; Foresman, J. B.; Ortiz, J. V.; Cioslowski, J.; Fox, D. J. Gaussian 09, revision A.02; Gaussian, Inc.: Wallingford, CT, 2009.
(18) Stephens, P. J.; Devlin, F. J.; Chabalowski, C. F.; Frisch, M. J. Ab-initio Calculation of Vibrational Absorption and Circular-Dichroism Spectra using Density-Functional Force-Fields. J. Phys. Chem.1994,98, 11623−11627.
(19) Becke, A. D. Density-Functional Thermochemistry III. The role of Exact Exchange.J. Chem. Phys.1993,98, 5648−5652.
(20) Lee, C. T.; Yang, W. T.; Parr, R. G. Development of the Colle-Salvetti Correlation-Energy Formula into a Functional of the Electron-Density.Phys. Rev. B: Condens. Matter Mater. Phys.1988,37, 785−789. (21) Tomasi, J.; Mennucci, B.; Cammi, R. Quantum Mechanical Continuum Solvation Models.Chem. Rev.2005,105, 2999−3093.
(22) Lu, T.; Chen, F. W. Multiwfn: A Multifunctional Wavefunction Analyzer.J. Comput. Chem.2012,33, 580−592.
(23) O’Boyle, N. M.; Tenderholt, A. L.; Langner, K. M. cclib: A library for Package-Independent Computational Chemistry Algo-rithms.J. Comput. Chem.2008,29, 839−845.
(24) Mckinley, A. W.; Lincoln, P.; Tuite, E. M. Environmental Effects on the Photophysics of Transition Metal Complexes with Dipyrido-[2,3-a:3′,2′-c]phenazine (dppz) and Related Ligands. Coord. Chem. Rev.2011,255, 2676−2692.
(25) Padilla, R.; Maza, W. A.; Dominijanni, A. J.; Winkel, B. S. J.; Morris, A. J.; Brewer, K. J. Pushing the Limits of Structurally-Diverse Light-Harvesting Ru(II) Metal-Organic Chromophores for Photo-dynamic Therapy.J. Photochem. Photobiol., A2016,322323, 67−75.
(26) Juris, A.; Balzani, V.; Barigelletti, F.; Campagna, S.; Belser, P.; Vonzelewsky, A. Ru(II) Polypyridine Complexes - Photophysics, Photochemistry, Electrochemistry, and Chemi-luminescence. Coord. Chem. Rev.1988,84, 85−277.
(27) Sun, Y.; Lutterman, D. A.; Turro, C. Role of Electronic Structure on DNA Light-Switch Behavior of Ru(II) Intercalators. Inorg. Chem.2008,47, 6427−6434.