www.atmos-chem-phys.net/14/3095/2014/ doi:10.5194/acp-14-3095-2014
© Author(s) 2014. CC Attribution 3.0 License.
Atmospheric
Chemistry
and Physics
The 2011 Nabro eruption, a SO
2
plume height analysis using IASI
measurements
L. Clarisse1, P.-F. Coheur1, N. Theys2, D. Hurtmans1, and C. Clerbaux1,3
1Spectroscopie de l‘Atmosphère, Service de Chimie Quantique et Photophysique, Université Libre de Bruxelles,
Brussels, Belgium
2Belgian Institute for Space Aeronomy, Brussels, Belgium
3UPMC Univ. Paris 6; Université Versailles St.-Quentin; CNRS/INSU, LATMOS-IPSL, Paris, France
Correspondence to:L. Clarisse ([email protected])
Received: 28 October 2013 – Published in Atmos. Chem. Phys. Discuss.: 28 November 2013 Revised: 13 February 2014 – Accepted: 14 February 2014 – Published: 28 March 2014
Abstract.In the wake of the June 2011 Nabro eruption, large
stratospheric plumes were observed by several instruments up to altitudes of 21 km, much higher than initial reported injection heights. It has been debated whether deep convec-tion associated with the Asian Summer Monsoon anticyclone played a vital role in the vertical transport of the plume. Here we present a new and fast SO2height retrieval algorithm for
observations of the Infrared Atmospheric Sounding Interfer-ometer (IASI). A comprehensive validation with forward tra-jectories and coincident CALIOP measurements is presented which indicates an accuracy better than 2 km for plumes be-low 20 km and SO2columns up to the 1 DU level. We use this
new product to analyse the Nabro eruption. Our findings in-dicate an initial plume located mainly between 15 and 17 km for which the lower parts underwent in succession rapid de-scent and uplift, within the Asian Monsoon anticyclone cir-culation, up to the stable thermal tropopause between 16 and 18 km, from where it slowly ascended further into the strato-sphere. Evidence is presented that emissions in the first week of the eruption also contributed to the stratospheric sulfur in-put. This includes a second eruption between 15 and 17 km on the 16th and continuous emissions in the mid-troposphere of which some were also entrained and lifted within the anti-cyclonic circulation.
1 Introduction
Nabro is a volcano located in the Afar Depression in Er-itrea, near the Ethiopian border at 13.37◦N, 41.70◦E with a summit elevation of 2218 m a.s.l. The volcano was clas-sified as inactive, with no known eruption in the past 10 000 yr (Bojanowski, 2011) until it started erupting vio-lently on 12 June 2011. The SEVIRI instrument on board the Meteosat-9 platform was the first to observe the vol-canic plume around 20:30 UTC (Pavolonis, 2012). This ini-tial plume was observed later by many other satellite in-struments and was found to be very rich in water vapour and sulphur dioxide (SO2) but relatively poor in mineral ash
(Clarisse et al., 2012). Nabro kept on erupting almost contin-uously for one month to follow (SACS, 2013), but with de-creasing intensity, both in terms of injection height and SO2
flux (Theys et al., 2013).
In the first phase of the eruption, the main transport pat-tern of emitted SO2followed the strong anticyclonic
circula-tion over the Middle East and Asia associated with the Asian summer monsoon at that time of year, indicative of upper tropospheric–lower stratospheric (UTLS) heights (Clarisse et al., 2012; Sawamura et al., 2012; Bourassa et al., 2012; Bergman et al., 2012). At these heights a major atmospheric sink for SO2 is oxidation, leading to the formation of
2012). Other instruments that witnessed this process in-clude the CALIOP/CALIPSO lidar (Sawamura et al., 2012; Bourassa et al., 2012; Vernier et al., 2013), a network of ground-based lidars (Sawamura et al., 2012; Uchino et al., 2012) and a CCD camera (Mateshvili et al., 2013). In the first month after the eruption stratospheric aerosols were mainly observed over Asia and the Middle East; by day 60 they cov-ered the whole Northern Hemisphere. Reported aerosol alti-tudes from these instruments are between 15 and 21 km.
Sulfate aerosols in the stratosphere have a residence time of the order of months to years and can have important im-pacts on local and global climate. The most important direct effect is scattering of solar radiation, which leads to cool-ing of surface temperatures (e.g. Stenchikov et al., 1998; Robock, 2000). A more indirect effect includes the impact of sulphate aerosols on precipitation, in particular due to weak-ening of the Asian and African summer monsoons (Trenberth and Dai, 2007; Robock et al., 2007). Since the year 2000, the background stratospheric aerosol load has increased sub-stantially (Hofmann et al., 2009), yielding a negative forcing of−0.1 W m−2and partially offsetting the radiative forcing of greenhouse gases (Solomon et al., 2011). This increase is likely due to a series of small to medium sized volcanic eruptions injecting SO2in the lower stratosphere at tropical
latitudes (Vernier et al., 2011a, b). To understand present day climate and how it might change, it is therefore vital to iden-tify and quaniden-tify (potential) injection and transport patterns of SO2and sulphate aerosol in the stratosphere. Of particular
interest are tropical volcanic eruptions, which have poten-tially the largest impact on the climate.
The recent eruption of Nabro constitutes a fascinating case study in this perspective, especially as it is debated whether the volcanic plume was directly injected in the stratosphere or whether it was brought to these altitudes by (convective) transport. We refer to the original report (Bourassa et al., 2012) and comments (Fromm et al., 2013; Vernier et al., 2013; Bourassa et al., 2013) for a full account and only summarise the main points here. Bourassa et al. (2012) ar-gue that the Asian Monsoon is responsible for the rela-tively rapid ascent of the tropospheric Nabro plume in the stratosphere. They adopt tropospheric injection heights (10– 13 km) based on a report of the Toulouse VAAC, a CALIOP image on 16 June and consistency of the observed transport pattern with NCEP winds at these heights. Measurements us-ing the OSIRIS and CALIOP sounder reveal stratospheric aerosols building up above the Asian Monsoon region, and residing there for a long time before spreading to the rest of the Northern Hemisphere. The anticyclonic circulation of the Asian summer monsoon is known to trap air masses within the UTLS. On its eastern side it contains a deep con-vective region, which can transport tropospheric air to the (lower) stratosphere and confine it within (Li et al., 2005; Randel and Park, 2006; Park et al., 2007, 2008, 2009; Randel et al., 2010). Calipso’s overpasses on 1 July over this region show aerosol layers mainly between 16–19 km and over high
altitude convective clouds located between 12–16 km. These facts together with the satellite observations allow Bourassa et al. (2012) to reach their conclusion on the role of the Asian Monsoon in the vertical transport of the Nabro plume. In re-sponse to this study Fromm et al. (2013) and Vernier et al. (2013) assert that the initial eruptive plume was injected di-rectly into the stratosphere. One piece of evidence comes from brightness temperature imagery of the early plume showing temperatures around the cold point tropopause and evidence of overshooting in the stratosphere. Fromm et al. (2013) also show observations from the Microwave Limb sounder (MLS), including a SO2layer at 19 km one day
af-ter the eruption and several stratospheric enhancements afaf-ter that. They also point out the existence of a CALIOP observed aerosol layer at 18.5 km on 16 June which can be traced back to the Nabro eruption. Vernier et al. (2013) present a compre-hensive CALIOP analysis. A cumulative plot of aerosol top heights in the Middle East and Asia in the first week after the eruption reveals that a large part of the Nabro plume at-tained heights between 15 and 19 km, above or near the local tropopause. Bourassa et al. (2013) rebut most of these argu-ments and provide additional evidence supporting the con-clusions of their original study. Their strongest arguments are based on MLS SO2 measurements in the early plume.
Although these exhibit stratospheric SO2enhancements, the
majority of the SO2load in these profiles is found in the
tro-posphere. Further down the transport path on 18 June SO2
enhancements are found in the stratosphere without coinci-dent tropospheric enhancements, which provides further sup-porting evidence of uplift.
The analysis of Bourassa et al. (2012, 2013) does provide pieces of evidence for entrainment and uplift of the Nabro plume by the Asian Monsoon. On the other hand, the analy-ses of Fromm et al. (2013) and Vernier et al. (2013) do seem to indicate that at least part of the initial plume reached the UTLS. To prove or disprove the Asian Monsoon scenario and reconcile the different observations, analysis should quantita-tively take into account the relative weight of the different in-jection heights, and ideally should also focus on observations of the actual uplift. Another important point not addressed by the aforementioned studies is that Nabro injected consider-able amounts of high altitude SO2for at least 4 days (Theys
et al., 2013) after the start of the eruption. Their role on the observed stratospheric loadings needs to be investigated.
For this particular eruption, limb or lidar measurements suffer from a lack of spatial resolution. In addition, no CALIOP data was available for the first two days of the eruption. Recently, the potential of the Infrared Atmospheric Sounding Interferometer (IASI) (Clerbaux et al., 2009) on-board Metop-A to retrieve vertically resolved SO2 clouds
resolution. The goal of this paper is threefold: (i) to present a new unconstrained and fast SO2height retrieval algorithm,
(ii) to validate this new algorithm using CALIOP measure-ments, (iii) to study the injection height of the Nabro eruption and the role of the Asian Monsoon on the plume transport. In the next section, we detail the new algorithm, discuss how it differs from other algorithms and highlight its relevance for near-real time applications. In Sect. 3, SO2retrieved heights
are presented for the Nabro eruption plume, accompanied by a comprehensive validation using CALIOP measurements. In the final section we discuss the results in light of the contro-versy, and present our conclusions.
2 SO2height retrievals
Recently a very sensitive trace gas detection method was in-troduced for high spectral infrared measurements (Walker et al., 2011, 2012). Consider a spectral retrieval of a trace gas total columnxˆ of the form (we assume that the background target columnsxare negligible)
ˆ
x=(KTS−1K)−1KTS−1(y−y¯), (1)
withythe observed spectrum,y¯a background spectrum and Kthe derivative with respect to the target species. This is the maximum likelihood solution corresponding to the forward modely=y¯+Kx+ǫand with Gaussian instrumental noise ǫ characterised by a covariance matrixS (Rodgers, 2000).
Here linearity is assumed as well as exact knowledge of all atmospheric parameters affecting the spectrum in the spec-tral range under consideration. In reality this knowledge is not available, and other unknown quantities (such as the sur-face temperature and water vapour for SO2retrievals) need
to be taken into consideration. However, instead of retrieving these parameters, they can also be considered as permanent unknowns and incorporated in a generalised noise covariance matrix. In the linear case, such a solution is equivalent to the one obtained by simultaneously retrieving all interfer-ing unknowns (von Clarmann et al., 2001; Rodgers, 2000). For species which are rarely observed in IASI spectra, con-structing such a generalised noise covariance and associated background spectrum is easy, as it can be simply constructed from a random sample of spectra uncontaminated by the tar-get species. This is the essence of the Walker et al. (2011, 2012) method. Despite its relative simplicity, test cases have revealed that it is about an order of magnitude more sensitive than previously used detection methods. The conditions of the retrieval, namely constant JacobiansKand linearity are usually not satisfied. The quantityxˆ is therefore an apparent column which should be interpreted as a qualitative estimate of the column. For these reasons it is convenient to normalise this apparent column as
Z=K
TS−1(
y−y¯)
√
KTS−1K . (2)
ThisZnumber is unitless and has a mean of zero and a stan-dard deviation of one on uncontaminated spectra (Walker et al., 2011; Clarisse et al., 2013). It represents the number of standard deviations away from the average and the larger its value, the more likely it corresponds to an enhancement of the target species (Walker et al., 2012).
The real strength of the detection method stems from be-ing able to use a large spectral range and a covariance matrix which characterises IASI measurements better than any tra-ditional forward model could do. The SO2retrieval method
presented in Carboni et al. (2012) uses a related approach to retrieve SO2columns and plume heights. It differs from the
detection method in three ways. First, the covariance matrix is built from spectral residuals between observed spectra and spectra simulated by a forward model fed with the best pos-sible knowledge of the local temperature and humidity pro-files. Secondly, the maximum likelihood retrieval is replaced by an iterative Levenberg–Marquard retrieval with variable Jacobians. Here the SO2column is assumed to be confined
to a narrow altitude band and the Jacobians are then calcu-lated with respect to the column and the height of this band. The third difference is the use of a priori information and a covariance matrix which constrains the retrieval. Retrievals performed in this way, then yield quantitative estimates of the column amounts and heights, as opposed to the apparent columns discussed above. The use of a generalised covari-ance matrix still preserves some of the advantages of the de-tection method, in particular enhanced sensitivity and being able to fully take into account the limitations of the forward model.
Here we propose a hybrid method to retrieve SO2plume
heights. Let us define aZfunction
Z(h)=K
T
hS−1(y−y¯)
q
KThS−1K
h
, (3)
withKhthe Jacobian with respect to the SO2partial column
at an altitudeh. When an observed spectrum contains a de-tectable amount of SO2, thisZ function should attain
val-ues significantly larger than 1. The JacobiansKhcontain the
SO2signature that can be expected at an altitudeh, and the
Zfunction should therefore peak ath. Another way of see-ing this is that Eq. (3) is a covariance weighted normalised projection (Clarisse et al., 2013) of the observed spectrum onto a SO2signature relevant to the different heights. When
Z reaches its maximum there is maximal overlap between the observed spectrum and the SO2signature at that altitude.
Simply calculatingZ(h)for different altitudeshand finding the maximum thus gives a viable and fast way of estimating SO2plume altitude. Example Jacobians in the range 1300–
Fig. 1.(Left) Jacobians with respect to a SO2layer at different
al-titudes. They have been normalised and offset for display purposes. (Right) TheZfunction acting on different observed IASI spectra of Nabro. The values have been normalised to ease comparison.
band. This is reflected in theZ(h)profiles shown on the right. At low altitudes, these peak sharply, and become broader as the altitude increases.
To test the theoretical accuracy of this method for differ-ent altitudes, 10 000 forward simulations of 5 DU SO2clouds
between 1 and 30 km were carried out. To make the simula-tion as realistic as possible, spectral noise was added to these spectra. This noise was generated from the multivariate nor-mal distribution with the mean bias and covariance matrix used for the quantitative SO2column retrievals (see end of
this section). Calculating spectra in this way is a realistic way of simulating real observed spectra because biases in the for-ward model are removed, and because instrumental noise is added. However, note that the atmospheric parameters used in the simulation are the same as the ones which were used to construct the Jacobians. Using this method we hence obtain upper bounds on the accuracy of the algorithm.
The results are summarised in Fig. 2. As expected from the
Z(h)profiles shown in Fig. 1, the best accuracy is achieved between 5 and 15 km with error bars below 500 m. Below 3 km the tropical atmosphere is almost opaque in the spec-tral range of interest due to water vapour, and the algorithm therefore loses its accuracy drastically (a dryer atmosphere would allow to penetrate lower down). Above 18 km, the er-ror bar is almost constant at around 1.5 km. At these altitudes, the water vapour content in the atmosphere is low, and the fact that such a good sensitivity is achieved is related to pres-sure and temperature dependence of the SO2lines (Clerbaux
et al., 2008). Although hard to see with the naked eye on apodized IASI spectrum, the simulation demonstrates that al-titude information is contained in the spectrum even in the stratosphere.
Another appealing aspect of the algorithm is the perfor-mance on scenes with overlaying meteorological clouds. Cloudy scenes are at no stage in the algorithm treated
Fig. 2.Theoretical height retrieval error biases and standard
devi-ations constructed from a simulation of 10 000 IASI spectra with SO2altitudes between 1 and 30 km.
separately. Hence, it could be argued that as water in the gas and in the liquid phase have a similar broad band extinction across the infrared spectral region that these will have an im-portant effect. However, as we will show later, clouds seem to have little effect on the retrieved altitudes of this hybrid method, as long as they are not completely masking the SO2
layer below. The reason is that while the broad extinction of clouds and water vapour is present in the Jacobians, these also exhibit the sharp spectral lines of water vapour in the gas phase, which are not found in clouds.
This hybrid method has the benefit of relying on the for-ward model just for its Jacobians. These can be precalculated once and the remaining calculations then become trivial. In other words, this method is suitable for near real time appli-cations and can be implemented in operational centres with minimal computational resources. It would for instance be a good candidate for implementation in the SACS project (Brenot et al., 2013), dedicated to timely warning of vol-canic plumes. Another benefit is that the algorithm uses no a-priori information or constraints on its retrieval. Especially for smaller loadings, there is always the possibility of a con-strained height retrieval algorithm to get stuck in a local minimum near its a priori. It also has some disadvantages, the main one is probably its performance for heavily satu-rated plumes. In this case, the Jacobians that are calculated in the neighbourhood of small loadings are no longer repre-sentative. Fortunately, saturation occurs only in very young plumes, and even in these cases, altitudes can be estimated from the plume edges, away from saturation.
(Coheur et al., 2005) using average atmospheric conditions representative for 10◦×20◦latitude/longitude boxes in the Northern Hemisphere in June 2011. Average water vapour and temperature profiles were calculated in each box from the Eumetsat IASI L2 data of several days in June 2011. In each case, Jacobians were generated representative for plumes between 1 and 30 km in steps of 1 km, with a 1 km thick layer of 5 DU of SO2. For each specific observation,
local Jacobians were then obtained using a bilinear interpo-lation of the four closest grid boxes. For operational appli-cations Jacobians would need to be precalculated for such boxes and different time-periods of the year. For the con-struction of the global mean spectrumy¯ and the global er-ror covariance matrixS we used one million random IASI spectra selected from all periods of the year from around the globe. Spectra with observable SO2features were filtered out
recursively (analogously as was done in Clarisse et al., 2013). Below we also calculated column retrievals for selected days. These were obtained using an iterative optimal estima-tion fit, very similar to the one presented in Carboni et al. (2012) as explained above. Atmospheric water and tempera-ture profiles were taken from the collocated Eumetsat IASI L2 data. As we retrieve altitude independently, the fit is one-dimensional with only the magnitude of the SO2column that
needs adjusting. For this retrieval a different mean spectrum and covariance matrix are needed, ones that are built up from spectral residuals (see above). Here we used 15 000 forward simulations, over randomly chosen locations and times of the year. Again no distinction is made between cloudy and cloud-free scenes as the algorithm is largely robust for the presence of clouds (Carboni et al., 2012).
3 Results for Nabro
3.1 The first day
The first IASI observations of the plume were made on the morning of 13 June. Unfortunately, close to the equator there is an observational gap between different orbits which cov-ers a large part of the plume. Therefore, and also because of saturation issues, we focus on the evening orbit of the 13th. SO2height retrievals are shown in Fig. 3. Displayed altitudes
reach from 4 km close to the volcano to 17 km furthest down-wind.
Central to the discussion on the Nabro injection height is the question whether it is situated above or below the tropopause. Quite a bit of the disagreement regarding Nabro stems from the use of different definitions of a stratospheric plume. Some in terms of altitude, some in pressure, some in terms of potential temperatures and some as a combination of these. It is difficult to assign fixed thresholds on any of these, as the tropopause is highly variable with latitude. Answer-ing the question on a stratospheric injection from transported plumes is therefore very complicated, and in our opinion only
25 30 35 40 8
10 12 14 16 18 20 22 24 26 28
Retr. Alt. (km)4 6 8 10 12 14 16 18 20 22
25 30 35 40 8
10 12 14 16 18 20 22 24 26 28
Altitude (km)15.5 16 16.5 17 17.5 18 18.5
25 30 35 40 8
10 12 14 16 18 20 22 24 26 28
Temperature (K)180 185 190 195 200 205 210
Fig. 3.(Left) IASI retrieved SO2altitudes on 13 June (evening
over-pass). (Middle) Altitude of the tropopause on 14 June (derived from Eumetsat IASI L2 data). (Right) Temperature at the tropopause on 14 June (derived from Eumetsat IASI L2 data).
data from the young plume should be used to study the injec-tion height.
Here we adopt as definition of the tropopause, the first altitude level above 4 km which has a lapse rate below 0.1 K km−1. In the tropics this corresponds to the cold point tropopause, while for higher latitudes it is close to the defini-tion adopted by the World Meteorological Society (see also Birner, 2010). Figure 3 depicts the IASI level 2 (IASI L2) de-rived tropopause altitudes and temperatures for the 14th (the data on the 13th gave unreasonable low altitudes coincident the volcanic plume, pointing to a problem with the level 2 data due to the effect of the plume on the retrieval algorithm). In the relevant region the tropopause is at 17±0.5 km and 195±3 K. This altitude range matches our plume height max-imum. The brightness temperature imagery shown in Fromm et al. (2013) and Vernier et al. (2013) indicate a tempera-ture around 195 K also for a large part of the plume. Finally SO2MLS data shown in Bourassa et al. (2013) also show the
largest enhancements of SO2around 17 km. These pieces of
information together strongly indicate that the early Nabro plume was injected mostly at altitudes between 15 and 17 km with at least part near the thermal tropopause at 17 km. The tropopause acts as a natural barrier for vertical transport, so it is not surprising to find our measured maximums at this al-titude. Note that the radiosonde temperature profile shown in Bourassa et al. (2013) has the tropopause at 18.1 km, but was located on the other side of the Red Sea, where the IASI L2 also indicates a slightly higher altitude. The imagery shown in Fromm et al. (2013); Vernier et al. (2013) reveals a small part of the plume being overshot in the stratosphere. The pre-sented IASI retrievals did not capture this, possibly because of our specific treatment of saturated levels. IASI mass re-trievals for this day indicate a mass not larger than 400 kT for plumes above 10 km.
3.2 The second day
20 30 40 50 60 70 5
10 15 20 25 30 35 40 45
14 June 2011, AM
20 30 40 50 60 70 5
10 15 20 25 30 35 40 45
14 June 2011, PM
Retr. Alt. (km)
4 6 8 10 12 14 16 18 20 22
Fig. 4.IASI SO2altitude retrievals for 14 June for the morning (left)
and evening (right) overpass.
distinguished: (i) a part below 13 km south of 20◦ latitude (ii) a higher altitude part at 17–18 km and mostly on the western (AM) and northwestern (PM) side of the plume (iii) the middle part of the plume around 15–16 km and finally (iv) the part furthest downwind of the plume at altitudes 13–14 km (PM only). For 14 June, brightness temperature imagery cannot be used as these are only indicative for al-titudes for opaque plumes. Also for that day, there are no CALIOP measurements available. We therefore resort to for-ward trajectory modelling to compare the altitude retrievals with, even though caution has to be exercised in drawing con-clusion from such data alone. An analysis using ECMWF data and Flexpart revealed for instance the difficulty in simu-lating transport for the first 15 h of the eruption (Theys et al., 2013). On top of that, using different windfield datasets can yield differences in the simulated trajectories. Here we sim-ulated forward runs using the GDAS dataset with HYSPLIT (Draxler and Rolph, 2013) as shown in Fig. 5. These trajec-tories are compatible with transport towards East Asia for altitudes in the range 12–18 km, towards the west/southwest with altitudes 5–11 km and towards the south at even lower altitudes. These overall patterns are well captured in the IASI SO2height retrievals. In addition, a closer look at the
differ-ent parts of the observed plume and changing altitude of the forward trajectory (changing colour along transport in Fig. 5) reveals that the trajectories match the retrieved SO2transport
features. This is straightforward to see for the low (i) and the high (ii) part. Note that the latter reaches altitude up to 18 km in the AM overpass (for the PM this part of the plume is cut off by the satellite orbit). This small part of the plume coincides with an observed CALIOP feature around 18.5 km on 15/16 June as shown in Bourassa et al. (2012) and recog-nised as such in Fromm et al. (2013) (see also Fig. 6). This confirms that there was overshooting in the stratosphere of a part of the plume. Part (iii) and (iv) between 13 and 16 km correspond well with the transported trajectories at 16 and 17 km. These plume segments, presumably originating at 16– 17 km according to the IASI 13 PM retrieval, therefore seem
20 30 40 50 60 70 80 90 100 0
5 10 15 20 25 30 35 40 45
19 km
18 km 17 km
16 km 15 km 14 km
13 km 12 km
Altitude (km) 4 6 8 10 12 14 16 18 20 22
Fig. 5. HYSPLIT trajectories of an instantaneous injection from
Nabro at 22:00 UTC on 12 June 2011 with injection heights ranging from 3–19 km for a period of 5 days. The colours of the trajectories indicate the forecasted altitude, rather than the injected altitude.
to descent considerably in the course of 48 h. For these, the IASI height retrievals are again fully consistent in space and time with the HYSPLIT trajectories. IASI mass retrievals for this day indicate a mass not larger than 600 kT for plumes above 10 km, and about 200 kT below.
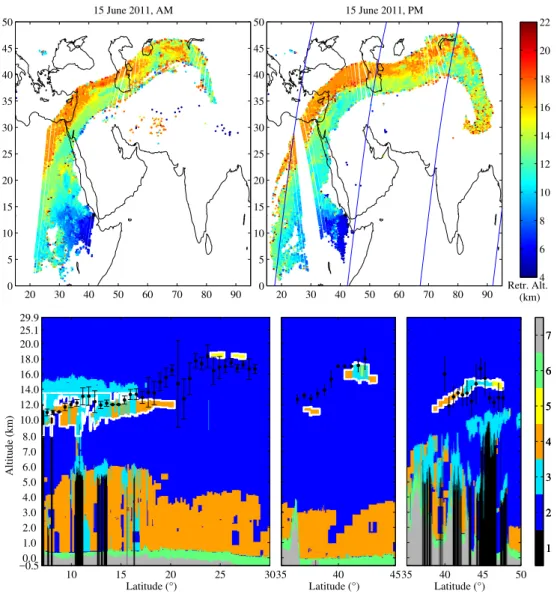
3.3 The first week
IASI plume height retrievals and coincident CALIOP mea-surements for 15–19 June 2011 are presented in Figs. 5–9. We first discuss and interpret the IASI retrievals, for which the following observations can be made:
– Nabro released SO2almost without interruption in the
first week, but with large variations in magnitude and altitude. Plumes emitted below 10 km travelled con-sistently south/southwest at a moderate speed. These plumes could be followed up to maximum a week, but not longer, consistent with the short lifetime of SO2 at low altitude. The total emitted SO2 mass for
plumes below 10 km is considerable, a selected mass retrieval for the 15th alone gives a lower bound of around 800 kT.
20 30 40 50 60 70 80 90 0
5 10 15 20 25 30 35 40 45 50
15 June 2011, AM
20 30 40 50 60 70 80 90 0
5 10 15 20 25 30 35 40 45 50
15 June 2011, PM
Retr. Alt. (km)
4 6 8 10 12 14 16 18 20 22
1 2 3 4 5 6 7
Latitude (°)
Altitude (km)
10 15 20 25 30
29.9 25.1 20.0 18.0 16.0 14.0 12.0 10.0 8.0 7.0 6.0 5.0 4.0 3.0 2.0 1.0 0.0 −0.5
1 2 3 4 5 6 7
Latitude (°)
35 40 45
1 2 3 4 5 6 7
Latitude (°) 35 40 45 50
Fig. 6.IASI SO2height retrievals are presented on top from 4 to 22 km; blue lines indicate CALIPSO ground tracks within 5 h of the plume.
In the bottom panels, the CALIOP the Level 2 product, “Vertical Feature Mask” is shown for the CALIPSO curtains corresponding to the ground tracks shown above, from left to right. Colours are numbered 1 to 7 indicated in the colour bar and stand for: no signal (1), clean air (2), cloud (3), aerosol (4), stratospheric feature (5), surface (6) and subsurface (7). Features which are likely to correspond to sulfate aerosols originating from Nabro are contoured in white on the CALIOP maps. Coincident IASI altitude retrievals are superimposed on these CALIOP maps as black dots, with a standard deviation representing the spread in retrieved altitudes around the overpass.
the rest of the volcanic emissions in the first week. For the 15th the total SO2mass adds up to around 650 kT
for the plumes above 10 km.
– The parts of the plumes which reached Eastern Asia are mostly confined within the Asian monsoon anti-cyclone, sending the plume back westwards. These resulting western moving plumes are predominantly situated around the tropopause at 17 km. This is just above the top of the highest clouds observed in co-incident CALIOP measurements (best seen on 17– 19 June). The sequence of height retrievals from the 15th to the 18th, provides evidence for rapid uplift of the mid-tropospheric plumes at 12–15 km up to
the tropopause (even though partial washout of these plumes cannot be excluded). This seems valid for the parts that underwent descent after being initially in-jected at the tropopause, but also for those parts that were injected at lower altitude. No such rapid uplift is observed for those filaments already at the tropopause before entering Eastern Asia. It is not possible to esti-mate the total amount of sulfur that eventually ended up around the tropopause using IASI measurements alone, given the nature of this dynamic Nabro plume with continuous new injections of SO2and variable
10 20 30 40 50 60 70 80 90 100 110 0
10 20 30 40 50
16 June 2011, AM
10 20 30 40 50 60 70 80 90 100 110
0 10 20 30 40 50
16 June 2011, PM
Retr. Alt. (km)
4 6 8 10 12 14 16 18 20 22
1 2 3 4 5 6 7
Latitude (°)
Altitude (km)
5 10 15 20 25 30 35 29.9
25.1 20.0 18.0 16.0 14.0 12.0 10.0 8.0 7.0 6.0 5.0 4.0 3.0 2.0 1.0 0.0 −0.5
1 2 3 4 5 6 7
Latitude (°)
30 40 50
1 2 3 4 5 6 7
Latitude (°) 30 35 40 45
1 2 3 4 5 6 7
Latitude (°)
Altitude (km)
10 20 30 40 50
29.9 25.1 20.0 18.0 16.0 14.0 12.0 10.0 8.0 7.0 6.0 5.0 4.0 3.0 2.0 1.0 0.0 −0.5
1 2 3 4 5 6 7
Latitude (°)
30 40 50
1 2 3 4 5 6 7
Latitude (°)
30 40 50
10 20 30 40 50 60 70 80 90 100 110 120 0
10 20 30 40 50
17 June 2011, AM
10 20 30 40 50 60 70 80 90 100 110 120
0 10 20 30 40 50
17 June 2011, PM
Retr. Alt. (km)
4 6 8 10 12 14 16 18 20 22
1 2 3 4 5 6 7
Latitude (°)
Altitude (km)
10 20 30 29.9
25.1 20.0 18.0 16.0 14.0 12.0 10.0 8.0 7.0 6.0 5.0 4.0 3.0 2.0 1.0 0.0 −0.5
1 2 3 4 5 6 7
Latitude (°) 30 35 40 45
1 2 3 4 5 6 7
Latitude (°) 25 30 35 40 45
1 2 3 4 5 6 7
Latitude (°) 20 30 40
1 2 3 4 5 6 7
Latitude (°)
Altitude (km)
10 20 30 40 29.9
25.1 20.0 18.0 16.0 14.0 12.0 10.0 8.0 7.0 6.0 5.0 4.0 3.0 2.0 1.0 0.0 −0.5
1 2 3 4 5 6 7
Latitude (°) 35 40 45 50
1 2 3 4 5 6 7
Latitude (°)
20 30 40
1 2 3 4 5 6 7
Latitude (°) 20 30 40 50
0 20 40 60 80 100 120 140 0
10 20 30 40 50
18 June 2011, AM
0 20 40 60 80 100 120 140
0 10 20 30 40 50
18 June 2011, PM
Retr. Alt. (km)
4 6 8 10 12 14 16 18 20 22
1 2 3 4 5 6 7
Latitude (°)
Altitude (km)
0 5 10 15 29.9
25.1 20.0 18.0 16.0 14.0 12.0 10.0 8.0 7.0 6.0 5.0 4.0 3.0 2.0 1.0 0.0 −0.5
1 2 3 4 5 6 7
Latitude (°) 0 20 40
1 2 3 4 5 6 7
Latitude (°) 20 30 40 50
1 2 3 4 5 6 7
Latitude (°) 20 30 40
1 2 3 4 5 6 7
Latitude (°) 20 30 40 50
1 2 3 4 5 6 7
Latitude (°)
Altitude (km)
0 10 20 30 29.9
25.1 20.0 18.0 16.0 14.0 12.0 10.0 8.0 7.0 6.0 5.0 4.0 3.0 2.0 1.0 0.0 −0.5
1 2 3 4 5 6 7
Latitude (°)
0 50
1 2 3 4 5 6 7
Latitude (°) 20 30 40
1 2 3 4 5 6 7
Latitude (°) 20 30 40
1 2 3 4 5 6 7
Latitude (°) 10 20 30 40 50
0 20 40 60 80 100 120 140 160 0
10 20 30 40 50
19 June 2011, AM
0 20 40 60 80 100 120 140 160
0 10 20 30 40 50
19 June 2011, PM
Retr. Alt. (km)
4 6 8 10 12 14 16 18 20 22
1 2 3 4 5 6 7
Latitude (°)
Altitude (km)
0 10 20 30 29.9
25.1 20.0 18.0 16.0 14.0 12.0 10.0 8.0 7.0 6.0 5.0 4.0 3.0 2.0 1.0 0.0 −0.5
1 2 3 4 5 6 7
Latitude (°) 0 20 40
1 2 3 4 5 6 7
Latitude (°) 20 40
1 2 3 4 5 6 7
Latitude (°) 20 40
1 2 3 4 5 6 7
Latitude (°) 20 30 40
1 2 3 4 5 6 7
Latitude (°)
Altitude (km)
10 20 30 40 29.9
25.1 20.0 18.0 16.0 14.0 12.0 10.0 8.0 7.0 6.0 5.0 4.0 3.0 2.0 1.0 0.0 −0.5
1 2 3 4 5 6 7
Latitude (°) 20 30 40 50
1 2 3 4 5 6 7
Latitude (°) 20 30 40
1 2 3 4 5 6 7
Latitude (°) 20 30 40
1 2 3 4 5 6 7
Latitude (°) 20 25 30 35
– Part of the plume over Eastern Asia is transported first to the north, but later these filaments do turn to the east and over the Western Pacific. From here, one part is entrained in the anticyclone, whilst the other part travels further over the Pacific. This moderate leak-ing out of the Asian Monsoon circulation is a constant pattern observed for all observations after the 19 of June (not shown here). There is also a complemen-tary but weaker transport out from the west side of the Anticyclone over Central Africa. These two trans-port pathways are the two main escape routes from the anticyclone circulation, and while they are slow, they seem responsible for the spreading of the Nabro plume over the whole Northern Hemisphere (Bourassa et al., 2012).
– From the 17th onwards, the smaller Iranian anticy-clone centred over the Zagros Mountains and the Per-sian Gulf (Zarrin et al., 2011) entrains most of the Nabro plume around 10–13 km, preventing it from be-ing transported further eastwards. No uplift of this part of the plume is observed.
– On the 17th, AM overpass, a marked segment on the western side of the 10–14 km altitude plume over Africa attains altitudes between 15–17 km. In subse-quent overpasses this segment covers the whole north-ern edge of that plume. These observed altitudes are confirmed with coincident CALIPSO overpasses (see below) and are also compatible with its subsequent transport trajectory which tears away from the lower altitude plume on the 18th. Uplift on this side of the monsoon anticyclone seems unlikely, so that this part of the plume was likely emitted at such high altitudes. It can probably be traced back to the small part of the plume around 15–16 km detected on the 16th PM over Sudan (not covered completely by the IASI over-pass, and also possibly masked by SO2signals from
overlapping plume below). On the 19th this filament mixes with the rest of the Nabro plume located at the tropopause over Eastern Asia, further contributing to the total amount of sulfur which reached such alti-tudes.
Looking at the different IASI images of retrieved altitudes and the trajectory analysis presented before, it is apparent that the presented product is particularly self consistent, i.e. homogeneous in time and space, and almost unaffected by other atmospheric parameters (water vapour, clouds) or to-pography. The IASI height retrievals seem almost unaffected by the strength of the SO2signal as long as it is detectable
with confidence (Z value above 5). This can best be seen from the plume edges which are on the same altitude level as neighbouring pixels towards the centre of the plume. It is also evident from the retrievals on the 19th, which shows an aged plume with most columns below the 1–5 DU level. This
is unexpected as a larger signal naturally increases the signal-to-noise ratio and information content. SO2height retrievals
from the OMI instrument for instance become only reliable for columns above 20–30 DU (Yang et al., 2010; Nowlan et al., 2011).
For an absolute comparison, we present in Figs. 5–9 co-incident CALIOP measurements underneath the IASI re-trievals. While these instruments measure different things, sulfate aerosol is expected to travel alongside SO2as it is
oxi-dized from it. Here we chose to plot the CALIOP vertical fea-ture mask product, which is a level 2 product (Winker et al., 2009) that identifies and classifies observed features. It is useful to distinguish clouds from other aerosols, and makes it easier to identify volcanic plumes than from the level 1 data. Careful manual analysis of the level 1 does however point to occasional misclassification. In addition, the feature masks sometimes misses thinner filaments which could be identi-fied from the level 1 (especially in hindsight, when compar-ing with the IASI product). For illustration purposes, white contours have be drawn around features which likely corre-spond to the Nabro plume. In case of doubt, this was done with the aid of an analysis of the depolarization ratios, which are expected to be very low for sulfate aerosols (Vernier et al., 2013). For the comparison, IASI retrieved mean and stan-dard deviations of the altitudes in a 0.5◦ radius along the CALIPSO overpass have been used. One should however be wary that the observations are never totally coincident be-cause of the timelapse in the overpass of the two instruments (IASI first, then CALIOP about 3 h later), which can cause a large difference in the observed altitude.
Despite these limitations, altitude discrepancies between observed IASI retrieved SO2 altitude and CALIOP aerosol
measurements are for the most part, less than 2 km. It is re-markably good for plumes in the range 16–18 km, which are more often than not captured within a 1 km error bar. The largest discrepancies seems to be for plumes around 8–9 km, which are in about half of the cases put at altitudes around 10–11 km. But even for these, it is striking how well the gradient within the plumes are captured (for instance on the 18 June 3rd PM overpass). Almost no coincident plumes low 7 km were found in the analysis of CALIOP data, be-cause of the limited coverage of CALIOP coupled with the smaller sizes of the plumes. And even in those cases where there was a good overpass, interference of other lower tropo-spheric aerosol (e.g. desert dust) made identification of vol-canic aerosol impossible in the CALIOP data. As mentioned before however, the plumes at lower altitude are almost cer-tainly identified correctly based on their transport pathway and shorter lifetime. The CALIOP data reveals that the per-formance of the algorithm for plumes located below meteo-rological clouds, is not any worse than in cloud free scenes.
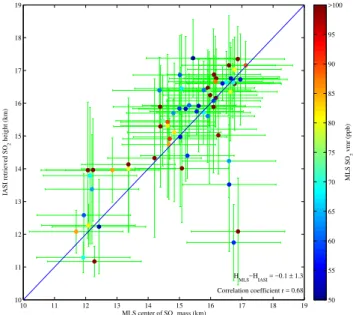
Another independent validation of the IASI measurements can be obtained from coincident MLS measurements of SO2.
10 11 12 13 14 15 16 17 18 19 10
11 12 13 14 15 16 17 18 19
MLS center of SO
2 mass (km)
IASI retrieved SO
2
height (km)
H
MLS−HIASI = −0.1 ± 1.3
Correlation coefficient r = 0.68
MLS SO
2
vmr (ppb)
50 55 60 65 70 75 80 85 90 95 >100
Fig. 11.Comparison of MLS centre of SO2mass with coincident
IASI SO2height retrievals in a 200 km radius around the MLS
mea-surements. The MLS errorbar was taken fixed at±1.5 km, the IASI errorbar depicts the standard deviation of the coincident IASI mea-surements. MLS data is from the v3.3 EOS MLS Level2 which was downloaded from the NASA Goddard Space Flight Center, Data and Information Services Center (http://disc.gsfc.nasa.gov/).
both retrievals were separated in the day and night over-pass and all IASI measurements within a 200 km radius of the MLS measurement where used. Only measurements with a volume mixing ratio above 50 ppb were used for MLS. Given the measurement uncertainties of both products, the plot reveals a good match between both instruments, with a mean bias of−0.1 km, a standard deviation of 1.3 km and a correlation coefficient of 0.68.
3.4 The aging plume
The transport of the high altitude Nabro plume follows the Asian monsoon anticyclone for many weeks, with the ma-jority of the plume invariably located between 16 and 18 km, both from IASI and CALIOP. An example is shown in Fig. 12 for 30 June 2011. The agreement between the two instru-ments is not as good as it is during the early days of the plume, especially in the parts where the aged higher altitude plume overlays fresher lower altitude plumes. Here the IASI algorithm often (and naturally) retrieves the lower plume, as this one has the larger concentrations of SO2; whereas
CALIOP is more sensitive to the aerosols in the aged plume. Overall this figure provides strong evidence that the Nabro plume was located around the tropical tropopause for at least two weeks after the initial eruption.
Around 30 June, SO2 maximums are around the 1 DU
level, and altitude retrievals gradually becomes more diffi-cult and noisy. To get a better view on longer term plume
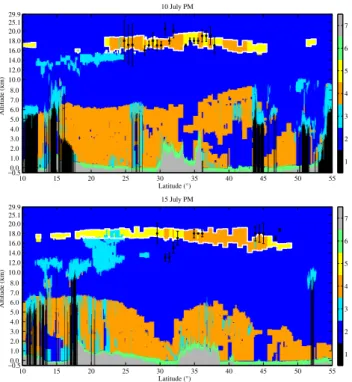
movement, a time series of the relative frequency of detected IASI SO2altitude is shown in Fig. 13 for 14 June to 15 July.
The most striking feature in this plot is the apparent gradual uplift of the plume mostly situated at 17 km to altitudes of 18–19 km. Two CALIPSO overpasses on the 10 and 15 July over the Middle East, which is the region where SO2is
de-tected for the longest period of time, are shown in Fig. 14. These confirm that compared to 30 June the plume has risen slightly, with a mean altitude around 18 km (and a spread mostly within 17–19 km) for the 15th. This gradual uplift above the tropopause is fully consistent with the uplift ob-served by OSIRIS (Fig. 2 in Bourassa et al., 2012). The co-incident IASI retrievals are also shown on Fig. 14. Instead of the mean, we show for these aged plumes the mode (the most frequent retrieved altitude) within a 0.5◦ radius of the CALIPSO overpass. This mode is more representative of the large scale aged plume and less affected by noise, whereas the mean underestimates the prevalent altitude due to the presence of anomalous low altitude retrievals. Even for these month-old plumes with sub-dobson level SO2columns, the
altitudes retrieved in this way are within the ±2 km uncer-tainty.
4 Conclusions
In this paper we have presented a new algorithm for IASI SO2plume altitude retrievals. Trajectory analysis and
coin-cident CALIOP and MLS measurements reveal an agreement predominantly within 2 km for plumes up to the 1 DU level. Given IASI’s global bi-daily coverage and the attractive com-putational properties of the algorithm, this opens perspec-tives for a large number of applications including near real time uses (e.g. hazard mitigation) and for off-line analysis (e.g. study of 3-D circulation patterns).
With respect to the Nabro eruption, we have presented evi-dence that the initial plume was injected at altitudes between 15 and 17 km. A smaller part was injected higher up reach-ing 18.5 km accordreach-ing to CALIOP measurements. Within the Asian Monsoon anticyclone, this initial plume was seen to undergo a partial descent on the western side of the anti-cyclone. Eventually the initial plume ascended to thermal tropopause around 16–18 km over Eastern Asia. Apart from the initial eruption, the continuous and large emissions of SO2 above 10 km up until at least 16 June also likely
con-tributed to the total stratospheric sulfur injection (including a smaller plume in the upper troposphere on the 16th). These emissions were entrained either by the Asian monsoon or the Iranian anticyclone. In the first case they joined the ini-tial injection plume through ascent on the eastern side of the Asian monsoon. The Iranian anticyclone became important after the 16th, and parts of the plume caught up in it did not reach higher altitudes.
0 20 40 60 80 100 120 140 0
10 20 30 40 50
30 June 2011, AM
0 20 40 60 80 100 120 140
0 10 20 30 40 50
30 June 2011, PM
Retr. Alt. (km)
4 6 8 10 12 14 16 18 20 22
1 2 3 4 5 6 7
Latitude (°)
Altitude (km)
0 50
29.9 25.1 20.0 18.0 16.0 14.0 12.0 10.0 8.0 7.0 6.0 5.0 4.0 3.0 2.0 1.0 0.0 −0.5
1 2 3 4 5 6 7
Latitude (°)
0 50
1 2 3 4 5 6 7
Latitude (°)
0 50
1 2 3 4 5 6 7
Latitude (°)
0 50
1 2 3 4 5 6 7
Latitude (°)
0 20 40
1 2 3 4 5 6 7
Latitude (°)
Altitude (km)
20 30 40 29.9
25.1 20.0 18.0 16.0 14.0 12.0 10.0 8.0 7.0 6.0 5.0 4.0 3.0 2.0 1.0 0.0 −0.5
1 2 3 4 5 6 7
Latitude (°) 10 20 30 40
1 2 3 4 5 6 7
Latitude (°) 20 40
1 2 3 4 5 6 7
Latitude (°) 10 20 30 40
1 2 3 4 5 6 7
Latitude (°) 20 30 40
Day in June/July AM and PM
14AM 14PM 15AM 15PM 16AM 16PM 17AM 17PM 18AM 18PM 19AM 19PM 20AM 20PM 21AM 21PM 22AM 22PM 23PM 24AM 24PM 25AM 25PM 30AM 30PM 05AM 05PM 10AM 10PM 15AM 15PM
Altitude (km)
4 6 8 10 12 14 16 18 20 22
Freq (%)0 5 10 15 20 25
Fig. 13.Frequency of the IASI retrieved SO2plume height altitude
as a function of time for 14 June to 15 July 2011.
1 2 3 4 5 6 7
Latitude (°)
Altitude (km)
10 July PM
10 15 20 25 30 35 40 45 50 55
29.9 25.1 20.0 18.0 16.0 14.0 12.0 10.0 8.0 7.0 6.0 5.0 4.0 3.0 2.0 1.0 0.0 −0.5
1 2 3 4 5 6 7
Latitude (°)
Altitude (km)
15 July PM
10 15 20 25 30 35 40 45 50 55
29.9 25.1 20.0 18.0 16.0 14.0 12.0 10.0 8.0 7.0 6.0 5.0 4.0 3.0 2.0 1.0 0.0 −0.5
Fig. 14.CALIOP measurements for 10 and 15 July (evening
over-pass) over the Middle East and coincident IASI retrievals (see text).
not address the exact mechanism of the observed rapid de-scent/ascent of the plume. A recent study suggests that quasi-isentropic flow is enough to explain most of the transport of the Nabro plume (Fairlie et al., 2013). The IASI-observed vertical transport is consistent with isentropic levels slop-ing downwards towards higher latitude (see e.g. Fig. 3 in Uchino et al., 2012), but a more quantitative approach would be needed to determine whether it explains it completely.
Observed transport into the lower stratosphere was much slower. The vertical resolution of the IASI instrument cou-pled with the relative short lifetime of SO2prevents us from
presenting conclusions on the location or mechanism of this stratospheric transport, but based on our presented timeseries and OSIRIS averaged profiles (Bourassa et al., 2012) we es-timate this ascent to be of the order of 1 km in two weeks.
Acknowledgements. IASI has been developed and built under the responsibility of the Centre National d’Etudes Spatiales (CNES, France). It is flown onboard the Metop satellites as part of the EUMETSAT Polar System. The IASI L1 data are received through the EUMETCast near real time data distribution service. CALIOP data were obtained from the NASA Langley Research Center Atmospheric Science Data Center. L. Clarisse and P.-F. Coheur are respectively Postdoctoral Researcher (Chargé de Recherches) and Research Associate (Chercheur Qualifié) with F.R.S.-FNRS. C. Clerbaux is grateful to CNES for scientific collaboration and financial support. The research in Belgium was funded by the F.R.S.-FNRS, the Belgian State Federal Office for Scientific, Technical and Cultural Affairs and the European Space Agency (ESA-Prodex arrangements and the Support to Aviation Control Service (SACS2) project). We would like to thank the two reviewers for their comments and corrections. L. Clarisse thanks Steve Tait for discussions on eruptive injection heights and Mike Fromm for feedback on this manuscript.
Edited by: T. von Clarmann
References
Bergman, J. W., Jensen, E. J., Pfister, L., and Yang, Q.: Seasonal dif-ferences of vertical-transport efficiency in the tropical tropopause layer: On the interplay between tropical deep convection, large-scale vertical ascent, and horizontal circulations, J. Geophys. Res.-Atmos., 117, D05302, doi:10.1029/2011JD016992, 2012. Birner, T.: Residual circulation and tropopause structure, J. Atmos.
Sci., 67, 2582–2600, doi:10.1175/2010JAS3287.1, 2010. Bojanowski, A.: Volcano mix-up, Nature Geoscience, 4, p. 495,
doi:10.1038/ngeo1222, 2011.
Bourassa, A., Robock, A., Randel, W., Deshler, T., Rieger, L., Lloyd, N., Llewellyn, E. J., and Degenstein, D.: Large Volcanic Aerosol Load in the Stratosphere Linked to Asian Monsoon Transport, Science, 337, 78–81, doi:10.1126/science.1219371, 2012.
Bourassa, A., Robock, A., Randel, W., Deshler, T., Rieger, L., Lloyd, N., Llewellyn, E. J., and Degenstein, D.: Response to Comments on “Large Volcanic Aerosol Load in the Stratosphere Linked to Asian Monsoon Transport”, Science, 339, p. 647, doi:10.1126/science.1227961, 2013.
Brenot, H., Theys, N., Clarisse, L., van Geffen, J., van Gent, J., Van Roozendael, M., van der A, R., Hurtmans, D., Coheur, P.-F., Cler-baux, C., Valks, P., Hedelt, P., Prata, F., Rasson, O., Sievers, K., and Zehner, C.: Support to Aviation Control Service (SACS): an online service for near real-time satellite monitoring of volcanic plumes, Nat. Hazards Earth Syst. Sci. Discuss., 1, 5935–6000, doi:10.5194/nhessd-1-5935-2013, 2013.
Carboni, E., Grainger, R., Walker, J., Dudhia, A., and Siddans, R.: A new scheme for sulphur dioxide retrieval from IASI measurements: application to the Eyjafjallajökull eruption of April and May 2010, Atmos. Chem. Phys., 12, 11417–11434, doi:10.5194/acp-12-11417-2012, 2012.
Clarisse, L., Coheur, P.-F., Prata, F., Hadji-Lazaro, J., Hurtmans, D., and Clerbaux, C.: A unified approach to infrared aerosol remote sensing and type specification, Atmos. Chem. Phys., 13, 2195– 2221, doi:10.5194/acp-13-2195-2013, 2013.
Clerbaux, C., Coheur, P.-F., Clarisse, L., Hadji-Lazaro, J., Hurt-mans, D., Turquety, S., Bowman, K., Worden, H., and Carn, S.: Measurements of SO2profiles in volcanic plumes from the
NASA Tropospheric Emission Spectrometer (TES), Geophys. Res. Lett., 35, L22807, doi:10.1029/2008GL035566, 2008. Clerbaux, C., Boynard, A., Clarisse, L., George, M., Hadji-Lazaro,
J., Herbin, H., Hurtmans, D., Pommier, M., Razavi, A., Turquety, S., Wespes, C., and Coheur, P.-F.: Monitoring of atmospheric composition using the thermal infrared IASI/MetOp sounder, At-mos. Chem. Phys., 9, 6041–6054, doi:10.5194/acp-9-6041-2009, 2009.
Coheur, P.-F., Barret, B., Turquety, S., Hurtmans, D., Hadji-Lazaro, J., and Clerbaux, C.: Retrieval and characterisation of ozone ver-tical profiles from a thermal infrared nadir sounder, J. Geophys. Res., 110, D24303, doi:10.1029/2005JD005845, 2005.
Draxler, R. and Rolph, G.: HYSPLIT (HYbrid Single-Particle Lagrangian Integrated Trajectory) Model access via NOAA ARL READY Website, available at: http://www.arl.noaa.gov/ HYSPLIT.php (last access date: 27 March 2014), 2013. Fairlie, T. D., Vernier, J.-P., Natarajan, M., and Bedka, K. M.:
Dis-persion of the Nabro volcanic plume and its relation to the Asian summer monsoon, Atmos. Chem. Phys. Discuss., 13, 33177– 33205, doi:10.5194/acpd-13-33177-2013, 2013.
Fromm, M., Nedoluha, G., and Charvát, Z.: Comment on “Large Volcanic Aerosol Load in the Stratosphere Linked to Asian Monsoon Transport”, Science, 339, p. 647, doi:10.1126/science.1228605, 2013.
Hofmann, D., Barnes, J., O’Neill, M., Trudeau, M., and Neely, R.: Increase in background stratospheric aerosol observed with li-dar at Mauna Loa Observatory and Boulder, Colorado, Geophys. Res. Lett., 36, L15808, doi:10.1029/2009GL039008, 2009. Li, Q., Jiang, J. H., Wu, D. L., Read, W. G., Livesey, N. J., Waters,
J. W., Zhang, Y., Wang, B., Filipiak, M. J., Davis, C. P., Turquety, S., Wu, S., Park, R. J., Yantosca, R. M., and Jacob, D. J.: Convec-tive outflow of South Asian pollution: A global CTM simulation compared with EOS MLS observations, Geophys. Res. Lett., 32, L14826, doi:10.1029/2005GL022762, 2005.
Mateshvili, N., Fussen, D., Mateshvili, G., Mateshvili, I., Vanhelle-mont, F., Kyrölä, E., Tukiainen, S., Kujanpää, J., Bingen, C., Robert, C., Tétard, C., and Dekemper, E.: Nabro volcano aerosol in the stratosphere over Georgia, South Caucasus from ground-based spectrometry of twilight sky brightness, Atmos. Meas. Tech., 6, 2563–2576, doi:10.5194/amt-6-2563-2013, 2013. Nowlan, C. R., Liu, X., Chance, K., Cai, Z., Kurosu, T. P., Lee, C.,
and Martin, R. V.: Retrievals of sulfur dioxide from the Global Ozone Monitoring Experiment 2 (GOME-2) using an optimal es-timation approach: Algorithm and initial validation, J. Geophys. Res., 116, D18301, doi:10.1029/2011JD015808, 2011.
Park, M., Randel, W. J., Gettelman, A., Massie, S. T., and Jiang, J. H.: Transport above the Asian summer monsoon anticyclone inferred from Aura Microwave Limb Sounder tracers, J. Geo-phys. Res., 112, D16309, doi:10.1029/2006JD008294, 2007. Park, M., Randel, W. J., Emmons, L. K., Bernath, P. F., Walker,
K. A., and Boone, C. D.: Chemical isolation in the Asian monsoon anticyclone observed in Atmospheric Chemistry
Ex-periment (ACE-FTS) data, Atmos. Chem. Phys., 8, 757–764, doi:10.5194/acp-8-757-2008, 2008.
Park, M., Randel, W. J., Emmons, L. K., and Livesey, N. J.: Transport pathways of carbon monoxide in the Asian sum-mer monsoon diagnosed from Model of Ozone and Re-lated Tracers (MOZART), J. Geophys. Res., 114, D08303, doi:10.1029/2008JD010621, 2009.
Pavolonis, M.: Development of a GOES-R Automated Vol-canic Cloud Alert System, in: 2012 NOAA Satellite Sci-ence Week, available at: http://www.goes-r.gov/downloads/ 2012-Science-Week/pres/wed/pavolonis_volcanic-alerts.pdf, 2012.
Randel, W. J. and Park, M.: Deep convective influence on the Asian summer monsoon anticyclone and associated tracer variability observed with Atmospheric Infrared Sounder (AIRS), J. Geo-phys. Res., 111, D12314, doi:10.1029/2005JD006490, 2006. Randel, W. J., Park, M., Emmons, L., Kinnison, D., Bernath, P.,
Walker, K. A., Boone, C., and Pumphrey, H.: Asian Monsoon Transport of Pollution to the Stratosphere, Science, 328, 611– 613, doi:10.1126/science.1182274, 2010.
Robock, A.: Volcanic eruptions and climate., Rev. Geophys., 38, 191–219, doi:10.1029/1998RG000054, 2000.
Robock, A., Oman, L., and Stenchikov, G.: Regional climate re-sponses to geoengineering with tropical and Arctic SO2
injec-tions, J. Geophys., 113, L15702, doi:10.1029/2007GL030524, 2007.
Rodgers, C.: Inverse methods for atmospheric sounding: theory and practice, series on atmospheric, oceanic and planetary physics, World Scientific, 2000.
SACS: Support to Aviation Control Service, available at: http://sacs. aeronomie.be/ (last access date: 27 March 2014), 2013. Sawamura, P., Vernier, J., Barnes, J., Berkoff, T., Welton, E.,
Alados-Arboledas, L., Navas-Guzmán, F., Pappalardo, G. A., Mona, L., Madonna, F., Lange, D., Sicard, M., Godin-Beekmann, S., Payen, G., Wang, Z., Hu, S., Tripathi, S., Cordoba-Jabonero, C., and Hoff, R.: Stratospheric AOD after the 2011 erup-tion of Nabro volcano measured by lidars over the Northern Hemisphere, Environ. Res. Lett., 7, 034013, doi:10.1088/1748-9326/7/3/034013, 2012.
Solomon, S., Daniel, J. S., III, R. R. N., Vernier, J.-P., Dutton, E. G., and Thomason, L. W.: The Persistently Variable “Background” Stratospheric Aerosol Layer and Global Climate Change, Sci-ence, 333, 866–870, doi:10.1126/science.1206027, 2011. Stenchikov, G. L., Kirchner, I., Robock, A., Graf, H.-F., Antuna,
J. C., Grainger, R. G., Lambert, A., and Thomason, L.: Radiative forcing from the 1991 Mount Pinatubo volcanic eruption, J. Geo-phys. Res., 103, 13837–13857, doi:10.1029/98JD00693, 1998. Theys, N., Campion, R., Clarisse, L., Brenot, H., van Gent, J., Dils,
B., Corradini, S., Merucci, L., Coheur, P.-F., Van Roozendael, M., Hurtmans, D., Clerbaux, C., Tait, S., and Ferrucci, F.: Vol-canic SO2fluxes derived from satellite data: a survey using OMI, GOME-2, IASI and MODIS, Atmos. Chem. Phys., 13, 5945– 5968, doi:10.5194/acp-13-5945-2013, 2013.
Trenberth, K. and Dai, A.: Effects of Mount Pinatubo volcanic erup-tion on the hydrological cycle as an analog of geoengineering, Geophys. Res. Lett, 34, L15702, doi:10.1029/2007GL030524, 2007.
T., and Yokota, T.: On recent (2008–2012) stratospheric aerosols observed by lidar over Japan, Atmos. Chem. Phys., 12, 11975– 11984, doi:10.5194/acp-12-11975-2012, 2012.
Vernier, J.-P., Pommereau, J.-P., Thomason, L. W., Pelon, J., Gar-nier, A., Deshler, T., Jumelet, J., and Nielsen, J. K.: Overshoot-ing of clean tropospheric air in the tropical lower stratosphere as seen by the CALIPSO lidar, Atmos. Chem. Phys., 11, 9683– 9696, doi:10.5194/acp-11-9683-2011, 2011a.
Vernier, J.-P., Thomason, L. W., Pommereau, J.-P., Bourassa, A., Pelon, J., Garnier, A., Hauchecorne, A., Blanot, L., Trepte, C., Degenstein, D., and Vargas, F.: Major influence of trop-ical volcanic eruptions on the stratospheric aerosol layer during the last decade, Geophys. Res. Lett., 38, L12807, doi:10.1029/2011GL047563, 2011b.
Vernier, J.-P., Thomason, L. W., Fairlie, T. D., Minnis, P., Palikonda, R., and Bedka, K. M.: Comment on “Large Volcanic Aerosol Load in the Stratosphere Linked to Asian Monsoon Transport”, Science, 339, p. 647, doi:10.1126/science.1227817, 2013. von Clarmann, T., Grabowski, U., and Kiefer, M.: On the role
of non-random errors in inverse problems in radiative trans-fer and other applications, J. Quant. Spectrosc. Ra., 71, 39–46, doi:10.1016/S0022-4073(01)00010-3, 2001.
Walker, J. C., Dudhia, A., and Carboni, E.: An effective method for the detection of trace species demonstrated using the MetOp Infrared Atmospheric Sounding Interferometer, Atmos. Meas. Tech., 4, 1567–1580, doi:10.5194/amt-4-1567-2011, 2011.
Walker, J. C., Carboni, E., Dudhia, A., and Grainger, R. G.: Im-proved detection of sulphur dioxide in volcanic plumes using satellite-based hyperspectral infrared measurements: Applica-tion to the Eyjafjallajökull 2010 erupApplica-tion, J. Geophys. Res, 117, D00U16, doi:10.1029/2011JD016810, 2012.
Winker, D. M., Vaughan, M. A., Omar, A., Hu, Y., Pow-ell, K. A., Liu, Z., Hunt, W. H., and Young, S. A.: Overview of the CALIPSO Mission and CALIOP Data Pro-cessing Algorithms, J. Atmos. Ocean. Tech., 26, 2310–2323, doi:10.1175/2009JTECHA1281.1, 2009.
Yang, K., Liu, X., Bhartia, P. K., Krotkov, N. A., Carn, S. A., Hughes, E. J., Krueger, A. J., Spurr, R. J. D., and Trahan, S. G.: Direct retrieval of sulfur dioxide amount and altitude from space-borne hyperspectral UV measurements: Theory and application, J. Geophys. Res., 115, D00L09, doi:10.1029/2010JD013982, 2010.