D. Taylor et alii, Frattura ed Integrità Strutturale, 10 (2009) 12-20; DOI: 10.3221/IGF-ESIS.10.02
12
The theory of critical distances applied to problems in fracture and
fatigue of bone
David Taylor, Saeid Kasiri, Emma Brazel
Engineering School, Trinity College, Dublin 2, Ireland [email protected]
ABSTRACT. The theory of critical distances (TCD) has been applied to predict notch-based fracture and fatigue in a wide range of materials and components. The present paper describes a series of projects in which we applied this approach to human bone. Using experimental data from the literature, combined with finite element analysis, we showed that the TCD was able to predict the effect of notches and holes on the strength of bone failing in brittle fracture due to monotonic loading, in different loading regimes. Bone also displays short crack effects, leading to R-curve data for both fracture toughness and fatigue crack propagation thresholds; we showed that the TCD could predict this data. This analysis raised a number of questions for discussion, such as the significance of the L value itself in this and other materials. Finally, we applied the TCD to a practical problem in orthopaedic surgery: the management of bone defects, showing that predictions could be made which would enable surgeons to decide on whether a bone graft material would be needed to repair a defect, and to specify what mechanical properties this material should have.
KEYWORDS.Bone; Fracture; Fatigue; Critical Distance.
INTRODUCTION
he critical distance approach is now well established as a method for the prediction of fatigue and fracture, and is being used extensively both in research and in engineering design. A recent book [1] describes the approach in detail. It is applicable for predicting failure in bodies containing notches or other stress concentrations, in situations where the mechanism of failure is one involving cracking. It has been employed by many workers for the solution of problems which can be described as essentially linear-elastic, i.e. problems in which any non-linear material behaviour (due to plasticity or damage) is localised in a small process zone: in this respect it has been used to predict brittle fracture and fatigue in all types of materials: metals, polymers, ceramics and composites. The history of this type of use goes back more than fifty years: more recent work has shown that the approach can also be applied to problems involving more extensive plasticity, such as low and medium-cycle fatigue and the static fracture of tough metallic materials.
D.Taylor et alii, Frattura ed Integrità Strutturale, 10 (2009) 12-20; DOI: 10.3221/IGF-ESIS.10.02
13
of short cracks. Following the success of this work, we then applied the approach to some problems of clinical significance. One example of this type of work is described: the surgical management of bone defects.
THE THEORY OF CRITICAL DISTANCES: A BRIEF INTRODUCTION
hat follows is a very brief introduction to the TCD: further details are available in [1] and in many other recent publications. The TCD recognises the fact that, in order to predict failure arising from a stress concentration feature such as a notch, it is not sufficient to know the stress and strain at the notch surface, at the maximum stress point, often known as the “hot spot”. Rather, it is essential to have information about the stress field in the vicinity of the notch, because fracture processes that involve crack initiation and propagation are strongly influenced by aspects of the stress field in this region, such as the gradient of stress or, to put it another way, the absolute volume of material which is experiencing high stress. This recognises the fact that cracking-type failures require, in general, a solution of the type which is now generally referred to as a “non-local approach”, characterised by a physical mechanism of failure involving a process zone in the vicinity of the crack tip in which failure, deformation and damage processes occur. A variety of methods, more or less complex, have been devised to make predictions using stress and strain information in this critical region.
In our most strict definition of the TCD, it consists of a group of methods which have the following two features in common. Firstly, the use of a linear, elastic material model for the stress analysis. Secondly, the use of a material parameter which has the units of length, known as the critical distance, L. The value of L cannot be known a priori; it can only be found by processing data from samples containing stress concentrations, tested to failure in the particular failure mode of interest. It is taken to represent a critical dimension in the material over which relevant failure processes occur. For example, in many cases it is found to be related to critical microstructural parameters such as grain size, which are known to control the material’s strength and toughness: this relationship will be discussed further below.
Having stated this strict definition, it is important to point out that exceptions do occur, in which the TCD is used in cases where these conditions are violated. For example it may be appropriate to use a non-linear material model, and we have indeed done so ourselves as will be discussed below. Also, some realisations of the theory make use of a value of L which is not a material constant [4, 5], though these will not be considered in the present paper.
We can define two different types of TCD methods. In the first type, predictions are made using information about the stress field, specifically the stress as a function of distance from the hot spot, on a line (known as the focus path) along which crack growth is expected to occur. The simplest example of this approach is the so-called Point Method, which uses only the stress at a given point, located a distance L/2 from the hot spot. Failure is predicted to occur if the stress at this point exceeds a critical value. A variant of this approach is the Line Method, in which the stress parameter is the average stress along the line, over a distance from zero to 2L from the hot spot. Area and volume averages have also been used, though these more complex methods do not seem to confer any more accuracy than the simple point and line methods. The second type of TCD method involves a modification of fracture mechanics, whereby the critical distance appears as the length of an imaginary crack located at the notch, or, alternatively, as the magnitude of finite crack growth increments [6]. Once such a modification is accepted, normal linear-elastic fracture mechanics approaches can be used. In what follows we will use approaches of the first type, i.e. stress-based methods, making use of finite element analysis (FEA) to obtain the appropriate stress fields.
INITIAL VALIDATION: NOTCH FRACTURE DATA
e obtained from the published literature three extensive sets of data on the effect of notches on brittle fracture in bone. All three involved tests in which monotonically-increasing loads were applied until failure occurred. One publication [7] was concerned with the effect of notch length for sharp notches machined in bone samples, whilst the other two [8, 9] reported the results of tests conducted on whole bones, loaded in bending and torsion respectively, containing circular holes of various sizes. We found that the TCD was able to predict all this data. Fig.1 shows an example: the effect of hole size on failure load for bones loaded in torsion. Further details can be found in a recent publication [10]. At this point it may be worth pointing out that the TCD can be used with any type of applied loading, including multiaxial load cases, though an appropriate multiaxial failure criterion should be used. In the present study our criterion was simply the maximum principal stress: we have reported the use of other multiaxial criteria to predict fatigue and fracture in various materials, in an extensive series of previous publications (e.g. [11-13] ).
W
D. Taylor et alii, Frattura ed Integrità Strutturale, 10 (2009) 12-20; DOI: 10.3221/IGF-ESIS.10.02
14
Note in particular from Fig. 1 that the TCD was able to predict the fact that small holes (hole diameter = 0.1 x bone diameter) have no effect on strength, a very useful finding for clinicians and one that was not predicted by other approaches. In the TCD approach this finding arises because if a notch is very small, the critical distance (being constant) becomes effectively much larger than the hole, so the stress at the critical point is similar to the nominal applied stress: effectively the hole has become “invisible” as far as this approach is concerned. A particularly encouraging aspect of this validation exercise was the fact that the appropriate value of the critical distance was found to be almost constant across the three sets of data. It is well known that other mechanical properties of bone, such as stiffness and strength, vary considerably, so we had expected that L would also vary, but this seems not to be the case: a value of 0.32-0.38mm was able to give good predictions throughout.
Figure 1: The effect of hole diameter (normalized by bone diameter) on fracture torque (normalized by fracture torque for bones containing no hole), for whole bones tested in torsion, containing single transcortical
holes of various diameters. Predictions using the TCD and two other theories.
The same situation arises in fibre composite materials, which are also known to have only a small range of L values [14]. In those materials, strength and toughness are roughly proportional to each other over quite a wide range of values, so that an increase in strength (for example by increasing the proportion of fibres) confers a similar proportional increase in toughness. An equation can be derived which links three material constants used in the TCD: L, Kc and the critical stress
for failure o, as follows:
2
1
o c
K
L
(1)Since L is related to the ratio of strength to toughness, it stays constant if these two properties change in a proportionate manner.
The critical stress parameter defining failure in bone, o, was found to be slightly larger than the material’s tensile strength,
u as measured from tests conducted on plain, unnotched samples. We found that accurate predictions could be made
using a critical stress of Tu where T had a constant of value 1.33. This finding is in line with our investigations of other
materials, in which the value of T has been found to take values close to 1.0 for brittle ceramics and composites [15], in the range 1.4-3 for polymers [1] and values typically greater than 3 for metals [16]. A precise interpretation of the meaning of the T parameter is still unclear. In considering the significance of this value it is worth noting the link between the three parameters of toughness, strength and L, as shown in equation 1 above. If two of these constants are known, the third can be calculated, which implies that only two of these three constants are of fundamental significance. In my personal opinion, the two fundamental parameters are L and Kc. The value of o differs from that of u, in my view, because of
D.Taylor et alii, Frattura ed Integrità Strutturale, 10 (2009) 12-20; DOI: 10.3221/IGF-ESIS.10.02
15
conducted a different analysis of bone, to predict indentation fracture, for which a non-linear material model was needed, we found that T=1 [13].
SHORT CRACK BEHAVIOUR IN FATIGUE AND BRITTLE FRACTURE
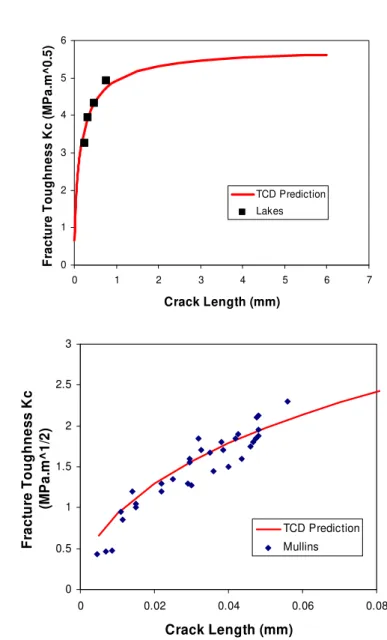
t is well known than short cracks often display behaviour which does not conform to linear elastic fracture mechanics. For example, the values of toughness (Kc) and fatigue threshold (Kth) for short cracks are often smaller
than the material-constant values measured from long cracks. Data in which the measured Kc (or Kth) is plotted as a
function of crack length are known as resistance curves, or R-curves. Figs 2 and 3 show R-curve data for bone, for brittle fracture and fatigue respectively, along with predictions using the TCD. In this case the analysis can be made very easily using the Line Method, because predictions for the case of a small crack (length a) in an infinite body can be expressed using the following simple equation:
L
a
a
K
K
c ca
(2)Figure 2: Two sets of data showing the variation of measured fracture toughness as a function of crack length for bone along with TCD predictions. For more details see [17].
0 1 2 3 4 5 6
0 1 2 3 4 5 6 7
Crack Length (mm)
F ra c tur e Toug hne s s K c ( M P a .m ^ 0 .5 ) TCD Prediction Lakes 0 0.5 1 1.5 2 2.5 3
0 0.02 0.04 0.06 0.08
Crack Length (mm)
D. Taylor et alii, Frattura ed Integrità Strutturale, 10 (2009) 12-20; DOI: 10.3221/IGF-ESIS.10.02
16
Figure 3: Threshold stress intensity range for fatigue crack growth in bone, defined at a crack growth rate of 3-6 x 10⁻⁸m/cycle; for details see [17].
As can be seen from the figures, the predictions are very satisfactory for both types of failure, even including data for very small crack lengths obtained using nanoindentation experiments [18]. It should be remarked that currently there is considerable controversy in the literature about the validity of measuring toughness using indentation, a technique which has been used for brittle material for many years but which is now being seriously questioned. The interested reader may wish to refer to recent letters in the Journal of Biomechanics arising from the publication by Mullins et al [18]. Currently, indentation is one of the few options available for estimating the toughness of materials at very small length scales, a subject which is of increasing interest given the advent of micro and nano scale materials and devices.
The data in Figs 2 and 3 here all refer to crack growth in the transverse direction: bone is highly anisotropic so further work is needed to explore fracture properties in different directions. In making these predictions we used the same value for L as previously obtained from the predictions of notch fracture behaviour. This implies that L takes the same value in fatigue as in brittle fracture in this material, at least for cracking in the transverse direction. We have previously found significant differences between L values for fatigue and brittle fracture in metallic materials, but similar values for a polymer, PMMA. In the present case the fatigue data available are relatively sparse, so further validation is needed before this conclusion can be stated with confidence.
It is perhaps worth considering at this stage why bone has this particular value of L. As noted above, L values for many materials are often related to the size of microstructural features which control fracture behaviour. Bone has a hierarchical structure, displaying features at a range of size scales, especially nanometres (the thickness of reinforcing crystals of hydroxyapatite), microns (the thickness of lamellae consisting of crystals and collagen fibres in a composite structure) and hundreds of microns (the size and spacing of structural units known as osteons). A number of mechanisms operating at the hundred-micron scale have been identified, notably uncracked ligaments bridging the crack faces [19] and the role of the osteon boundary in crack arrest (O'Brien et al., 2005), in a manner similar to the grain boundary in metals. Figs 4 and 5 show examples of these mechanisms. Ritchie and co-workers have investigated these mechanisms in some detail and have laid particular emphasis on the role of uncracked ligaments. They showed a definite relationship between the rising R-curve for a given crack and the increasing number of uncracked ligaments observed as the crack extended [20]. In our studies on high-cycle fatigue in bone we have placed emphasis on the role of the osteon boundary, showing that the great majority of fatigue cracks become non-propagating when they reach the first boundary and developing relationships between crack length, growth rate and the proximity of this boundary [21, 22].
All of these various observations imply that L takes a value equal to a few hundred microns because this corresponds to the size scale on which important toughening mechanisms operate in this material. In fact, this turns out to be the case for many different materials. Fig.6 shows the value of L for various different classes of materials, plotted against the relevant structural parameter d. In some cases there are very clear and demonstrable relationships between L and d: for example we showed that L takes values very close to d in steels failing by brittle cleavage fracture at low temperatures [23]. In other cases the relationship is less clear but for most materials it seems that L falls between d and 10d in magnitude. There are, however, some important exceptions: for example amorphous polymers such as PMMA have no microstructure as such, and yet have L values of the order of 0.1mm. This coincides with the typical size of crazes in the material.
0 0.2 0.4 0.6 0.8 1 1.2
0 0.5 1 1.5 2 2.5 3
Crack Length (mm)
S
tr
ess
In
ten
si
ty R
an
g
e
(
M
P
a.
m
^
1/
2)
D.Taylor et alii, Frattura ed Integrità Strutturale, 10 (2009) 12-20; DOI: 10.3221/IGF-ESIS.10.02
17
It is perhaps not surprising that there should be a relationship between L and d, since in most materials the microstructure plays a strong role in determining properties related to crack growth, such as toughness and fatigue behaviour. Thus, knowing a value of L for a particular material may shed light on the physical mechanism of failure and may give hints about how changing microstructural parameters could affect performance.
(a) (b)
Figure 4: Two SEM images showing cracks in bone which display bridges consisting of uncracked ligaments across the crack faces. Photo (a) from tests conducted in our laboratories by Stewart Mahoney; photo (b) from [19].
Figure 5: Image taken using optical fluorescence microscopy of a transverse section of bone, showing a crack (C), of length approximately 100m, whose left-hand tip has stopped growing on reaching
the boundary of an osteon (O). From [21].
Figure 6: Values of L and d in various classes of materials.
C
ri
ti
c
a
l
D
is
ta
n
c
e
,
L
Microst ruct ure Size, d
1nm 1m 1m m 1m
1nm m 1m m
1m
L=d L=10
d
Met als, brit t le fract ure
Met als, fat igue
Am orphous Poly m er s
Ceram ics
Nanom at erials? Fibre Com posit es
Concret es
D. Taylor et alii, Frattura ed Integrità Strutturale, 10 (2009) 12-20; DOI: 10.3221/IGF-ESIS.10.02
18
PRACTICAL APPLICATIONS: THE MANAGEMENT OF BONE DEFECTS
great advantage of the TCD is that it can be applied very easily to practical problems; in this respect the stress-based methods are particularly attractive because they can be used in any situation where a stress analysis can be conducted using FEA or similar numerical techniques.
Stress concentrations frequently arise in bone as a result of disease or clinical intervention. Surgeons use the terminology “bone defect” to refer to any hole which occurs in a bone, i.e. any part of the bone cortex or internal cancellous structure which is missing. Defects occur for various reasons, for example they may also arise following a complex fracture: when the broken parts of a bone are reassembled there may be some pieces missing. Also, holes may be deliberately drilled to take samples for biopsy or for the fixation of fracture plates which may be later removed. One method for the replacement of the anterior cruciate ligament in the knee involves taking a piece of bone from the patella of the other knee, often leaving a square hole with sharp corners. In a previous study we showed that the impact energy of this patella was significantly reduced by the presence of the hole, and that the situation could be considerably improved by cutting a hole with round corners [24]. This is a good example of how a concept which is very obvious to the mechanical engineer can have immediate benefits in the field of medicine.
If the hole is considered to confer significant risk of failure, the surgeon may fill it using a bone graft material. Various types of materials are used, including the patient’s own bone (taken from some other site and ground into a powder) and various artificial materials. Over a period of time, the patient’s own natural healing processes will cause the hole to be filled with new, living bone, so the bone graft material is intended only as a temporary substitute, required to last for a few months at the most. Artificial bone graft materials are designed to provide a scaffold for the rapid ingrowth of bone, and recently there has been much interest in the use of tissue engineering techniques for the development of these materials. Scaffolds have been made from a wide variety of materials, including porous metals, ceramics and hydrogels. There is great interest in the use of resorbable materials which can gradually dissolve, aiding the development of new bone, but current versions of these materials are relatively weak, increasing the risk of fracture in the critical period just after surgery. A major problem is the lack of a predictive model to aid surgeons in deciding what to do about a given defect, whether to use a bone graft material and, if so, what the properties of that material should be. Such a predictive model, presented in the form of a computer simulation of the defective bone, could greatly aid in the planning of surgical operations. As an initial step towards developing such a tool, we carried out some simple simulations of the behaviour of bone defects. Fig 7 shows the geometry used for the finite element model: the bone is envisaged as a simple tube, containing a defect: we modelled square and circular holes of various sizes. A complete description of the methodology and results can be found in a recent publication [25]. In brief, we used a damage mechanics approach to predict the increase of fatigue damage due to cyclic loading in normal daily activities. The TCD was incorporated by performing all the damage calculations at the critical point, i.e. a distance L/2 from the hole, rather than at the hot spot. The capacity of bone to repair itself was included in the model as a constant, negative damage rate, following earlier work [26]. The use of different bone graft materials was modelled by filling the hole with a material of given Young’s modulus, Eo. Bone ingrowth was included in
the simulation by allowing the Young’s modulus of the graft material to gradually increase over time, from Eo to a value
typical for normal cortical bone (17GPa).
Fig. 7 shows an example of the results of the simulation. If repair and ingrowth are not modelled, damage increases rapidly. Incorporating ingrowth causes damage to level out to a plateau value, and the additional incorporation of repair allows the damage to return to normal levels after peaking. The value of the peak is of course the critical one: provided this is less than unity we predict that no failure will occur.As Fig.8 shows, there is a very strong effect arising from the value of Eo, the stiffness of the bone graft material. This occurs because the stress concentrating effect of the hole is
greatly reduced, even when the material in the hole has much less stiffness than the surrounding bone. This analysis enabled us to make a specification for a safe value of Eo,as a function of hole size as shown in Fig.8. Obviously the result
also depends on the shape of the hole, and on the assumed daily loading, i.e. the activity level of the person. These predictions show that small holes (in this case less than 5mm diameter) do not need to be filled in with graft material: this finding is in agreement with the current practice of surgeons who regard such small holes as innocuous. Larger holes do require filling, but here we predict that the material needed can have an Eo value which is considerably smaller than that of
normal bone: this finding is original and potentially of great value to researchers and manufacturers who are developing new types of bone graft materials.
This work is very preliminary in nature, but has the potential to be developed to a greater level of sophistication, for example incorporating the changing behaviour of resorbable materials and the effect of different postoperative activity levels, such as walking with the support of a crutch or cane or carrying out more strenuous exercise.
D.Taylor et alii, Frattura ed Integrità Strutturale, 10 (2009) 12-20; DOI: 10.3221/IGF-ESIS.10.02
19 Figure 7: The geometry used to study defects of various shapes and sizes in a typical long bone – the focus path is
the line on which TCD calculations are carried out. Typical predictions showing the effect on damage evolution of including ingrowth of bone into the defect, and bone repair processes.
(a) (b)
Figure 8: (a) Variation of peak damage amount with Young’s modulus of the bone graft material; (b) Specification for the safe value of Eo (i.e. the value above which failure will not occur) as a function of hole size.
CONCLUDING REMARKS
his work has shown that the TCD can be used to study fracture and fatigue problems in bone. Classic problems which the TCD has been able to solve in other materials, such as notch-initiated fracture and fatigue and the short crack problem, have been successfully addressed in this material. Even though bone shows large variations in its mechanical properties, it seems that L remains approximately constant, of the order of 0.3-0.4mm, which is very convenient when making predictions. This value reflects the role of osteons and other microstructural features in impeding crack growth and thus controlling toughness and fatigue. Current work has been limited to cases where crack growth occurs across the bone, i.e. in the transverse direction: longitudinal crack growth requires separate study. We have also limited ourselves to cortical bone: the failure of spongy, cancellous bone is also of great interest and merits further attention. The TCD can be employed as part of a practical software tool to aid orthopaedic surgeons in the planning of operations and of post-operative treatments.
ACKNOWLEDGEMENTS
e are grateful to the Higher Education Authority of Ireland for provision of funding for part of the work described above, which was conducted in collaboration with the Institute of Technology, Sligo, Ireland.
T
D. Taylor et alii, Frattura ed Integrità Strutturale, 10 (2009) 12-20; DOI: 10.3221/IGF-ESIS.10.02
20
REFERENCE LIST
[1] D. Taylor, The Theory of Critical Distances: A New Perspective in Fracture Mechanics. Elsevier, Oxford, UK (2007). [2] J. M. Whitney, R.J. Nuismer, Journal of Composite Materials, 8 (1974) 253.
[3] P. Cornetti, N. Pugno, D. Taylor, Proceedings of the 11th International Conference on Fracture ESIS, Turin, Italy
(2005) 73.
[4] P. Cornetti, N. Pugno, A. Carpinteri, D. Taylor, Engineering Fracture Mechanics, 73 (2006) 2021. [5] D. Leguillon, European Journal of Mechanics A/Solids, 21 (2002) 61.
[6] D. Taylor, P. Cornetti, N. Pugno, Engineering Fracture Mechanics, 72 (2005) 1021. [7] W. Bonfield, P.K. Datta, Journal of Biomechanics, 9 (1976) 131.
[8] R.J. McBroom, E.J. Cheal, W.C. Hayes, Journal of Orthopaedic Research, 6 (1988) 369. [9] J.A. Hipp, B.C. Edgerton, K.N. An, W.C. Hayes, Journal of Biomechanics, 23 (1990) 1261. [10] S. Kasiri, D. Taylor, Journal of Biomechanics 41 (2008) 603-609.
[11] L. Susmel, Fatigue and Fracture of Engineering Materials and Structures, 27 (2004) 391. [12] F. Pessot, L. Susmel, D. Taylor, in Crack Paths Conference Parma, Italy (2006).
[13] S. Kasiri, G. Reilly, D. Taylor, WIT Transactions on Biomedicine and Health, 12 (2007) 113. [14] J. Awerbuch, M. S. Madhukar, Journal of Reinforced Plastics and Composites, 4 (1985) 3. [15] D. Taylor, Engineering Fracture Mechanics, 71 (2004) 2407.
[16] D. Taylor, Structural Integrity and Durability, 1 (2006) 145.
[17] D. Taylor, S. Kasiri, in Proc ASME Summer Bioengineering Conference ASME, USA (2008). [18] L. P. Mullins, M. S. Bruzzi, P. E. McHugh, Journal of Biomechanics, 40 (2007) 3285.
[19] Nalla,R.K., Kinney,J.H., and Ritchie,R.O. (2003) Mechanistic fracture criteria for the failure of human cortical bone. Nature Materials 2, 164-168.
[20] R. K. Nalla, J. S. lken, J. H. Kinney, R. O. Ritchie, Journal of Biomechanics, 38 (2005) 1517. [21] F. J. O'Brien, D. Taylor, T.C. Lee, Journal of Orthopaedic Research, 23 (2005) 475.
[22] D. Taylor, F. O'Brien, T. C. Lee, Meccanica, 37 (2002) 397.
[23] D. Taylor, Microstructural parameters in the theory of critical distances (2008).
[24] K. Moholkar, D. Taylor, M. O'Reagan, G. Fenelon, Journal of Bone and Joint Surgery, 84A (2002) 1782.
[25] E. Brazel, D. Taylor, Predicting the Structural Integrity of Bone Defects Repaired Using Bone Graft Materials; Computer Methods in Biomechanics and Biomedical Engineering, in press.

![Figure 3: Threshold stress intensity range for fatigue crack growth in bone, defined at a crack growth rate of 3-6 x 10 -8 m/cycle; for details see [17]](https://thumb-eu.123doks.com/thumbv2/123dok_br/18318042.349473/5.892.243.635.165.417/figure-threshold-intensity-fatigue-growth-defined-growth-details.webp)


