SOFTWARE TOOL FOR A COMPARATIVE ANALYSIS OF
ROMANIAN FISCALITY WITH OTHER COUNTRY IN EUROPEAN
UNION
Logica BANICA1, Daniela PIRVU2, Alina HAGIU3 1
Faculty of Economics, University of Pitesti, [email protected] 2Faculty of Economics, University of Pitesti, [email protected] 3
Faculty of Economics, University of Pitesti, alinahagiu @yahoo.com
Abstract: The corporation activity represents a factor of major interest for the economies of all the States due to the economic and social effects that it generates. The conditions of tax nature have an influence on corporations’ investment localization decisions and capital flows so that the policy of each sate in the field of corporative income tax payment must constitute the object of a very careful analysis. Thus, the companies choose to carry out their activity in the countries where they can obtain the biggest net profit after carrying out their specific operations. Reducing taxation rates of the corporate incomes in various member states of the European Union, as an effect of the tax competition, represents the compliance with an international trend, being only to a small extent the result of the government will. In the European Union, Romania has one of the lowest income tax rates as compared to other member states. Starting with 2005, the income tax rate that applies to the taxable profit is of 16%.
Analysis of economic and financial performances of subsidiaries of transnational companies active in Romania, considered as representative for their fields of activity, allowed us to formulate judgments about the prospects of investment in the Romanian economy produced by firms with trans-borders business.
An information system can have a major impact on corporate strategy and organizational success. The involvement of managers and decision makers in all aspects of information systems is a major factor for organizational success, including higher profits and lower costs. Some of the benefits business organizations seek to achieve through information systems include: better safety, competitive advantage, fewer errors, greater accuracy, higher quality products, improved communications, increased efficiency and productivity, more efficient administration, superior financial and managerial decision making.
Keywords: Tax rates, transnational companies, price indexes, information system.
JEL Classification Codes: G32, H25, C88, D80
1. TAXATION IN EUROPEAN UNION
For the European Union’s states, the fiscal policy represents one of the most important tools that the governments use to influence the national economies.
The existence of different national tax systems represents, however, the source of many problems
:
- Weakening budgetary revenue, through income loss associated with tax competition;
- Trend of increasing inequality of tax systems, through the preferential treatment of mobile tax bases;
- Risk of double taxation.
Lately, many experts and politicians were in favor of achieving a coherent and centralized policy at the European Union level, known as „tax harmonization”.
This concept involves achieving an orderly and coherent tax system at EU level, although without its components (national tax systems) to be identical. In terms of tax parameters, harmonization may refer to four aspects: the type of tax, the tax rates, the taxation basis and the administration of taxes.
Our work refers only to direct tax1 component, which is considered nominal tax, having an amount and payment terms specifically set, being more equitable and preferable to indirect taxes reflected on goods and services.
The communautaireacquis in the field of direct taxation mainly concerns income tax and tax on capital, and less tax on individuals. European Community Treaty does not expressly specify the need for direct tax alignment, and under the principle of subsidiarity, member states are free to adopt necessary regulations in the area. As far as direct taxation affect the free movement of goods, services, people and capital, Member States must ensure the functioning of a national taxation system which to respect the right of establishment of individuals or companies in accordance with Articles 94 and 308 of the Treaty .
The structure of tax revenue varies from one EU country to another. The main direct tax legislative settlements are in the area of profit tax. However, introducing a flat profit tax at EU level would be a controversial event and would likely face serious opposition from many Member States.
Yet, the EU Commission proposal for a single basis for taxable profit at EU level, still leaving national governments the freedom to determine its own share of profit tax, is pragmatic and reasonable. These simplify the profit taxation of companies operating in the EU, without harming competition or restrict the freedom of national governments to set tax rate they consider appropriate.
Romania joined the European Union with the lowest personal income tax (16%, while the European average was of 38.7%), but also with the lowest GDP share of budget revenues - 28.6 %, including social contributions.
Regarding profit tax, Romania ranks six, in the top of European countries with the lowest rate (16%), in the context of a European average of 23.59%, the lowest rate being registered in Bulgaria and Cyprus (10%), while in the opposite is Malta with a 35% share2.
Forward is presented the percentage size of tax revenue in the GDP, at the end of 20083:
1
Tulai C., Serbu S. – Fiscalitatea comparată i armonizări fiscale, Editura Casa Cărţii de tiinţă, Cluj-Napoca, 2005, p.173
2
Raportul Directoratului CE pentru Taxe i Uniune Vamală, 2006 3
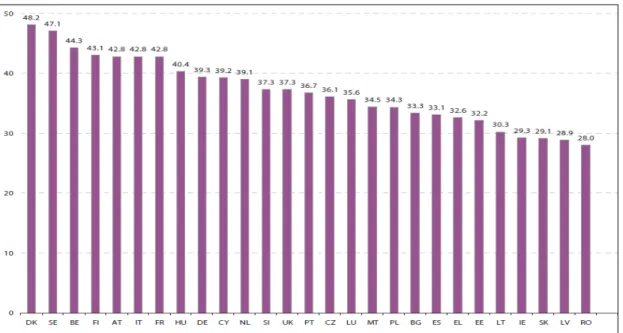
Figure no 1. The percentage size of tax revenue in the GDP, at the end of 2008, in the European Union Member States
Source: „Taxation Trends in the European Union”, European Commission, 2010
As can be seen from Figure 1, in the EU Member States there is a diverse representation of tax revenue in GDP, so in Denmark 48.7% of GDP transforms in tax revenue, while in Romania only 29.4%, our country being last in the European Union from this point of view. The result regarding the taxation perception is contrasting; therefore it is considered that in Romania the tax burden is very high.
This data shows that, although there is a common tax strategy at EU level, the way Member States choose to achieve their objectives is different, they having the right to fiscal sovereignty.
From 1995 to 2009, almost all EU Member States cut their top rate, with only three keeping it unchanged (Malta, Austria and the United Kingdom) and one (Portugal) increasing it slightly. Even taking into account the subsequent 0.4 average rate increase in 2010, all in all, the EU-27 average has gone down by 9.9 percentage points since 1995, accelerating after 2000.
The post-2000 acceleration is most noticeable in the Central and Eastern European countries, with the biggest cuts having taken place in four countries that adopted flat rate systems, Bulgaria (– 30.0 percentage points), the Czech Republic (– 17.0), Romania (– 24.0) and Slovakia (– 23.0); the acceleration was, however, visible also in the old EU Member States.
One should nevertheless note that the increase in the average in 2010 is due to sizeable hikes in a small number of countries, while the overwhelming majority of Member States, including several that have been amongst the strongest hit by the crisis, have kept their top PIT rate constant.
lower-income households also has the advantage that a greater proportion of the tax break is spent immediately, supporting demand.4
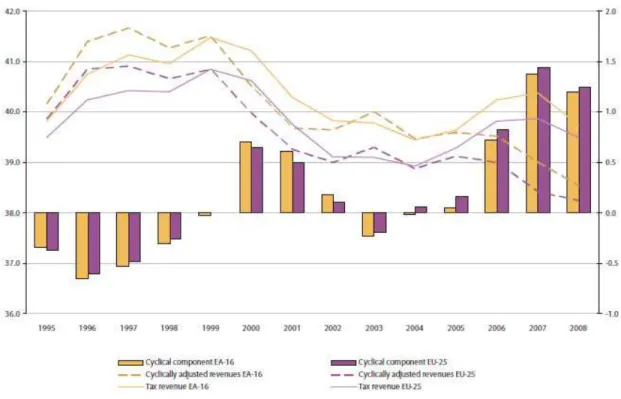
Figure no. 2 Cyclically adjusted tax revenues 1995-2008, in % of GDP
Source: „Taxation Trends in the European Union”, European Commission, 2010
Figure no 2. displays tax revenues and cyclically adjusted tax revenues (both GDP-weighted) in % of GDP for the EA-16 and EU-25 on the left hand scale of the graph. The right hand scale of the graph shows the GDP-weighted cyclical components in % of GDP for the EA-16 and the EU-25 respectively.
As displayed in the bars of the graph, the cyclical component of tax revenues was not very pronounced in the period under investigation. The cyclical component only exceeded one percent of GDP at the end of the period in 2007 and 2008, when actual GDP was considerably above its potential, translating into a high positive output gap. This generally low cyclical component just reflects the rather limited reaction of tax revenues to economic activity, as the tax revenue sensitivity is 0.42 for the Euro area and 0.39 for the EU-25 respectively. In general, the development of the cyclical component for the Euro area and the EU-25 are very similar.
The distribution of the overall tax burden by economic function has undergone some important changes since 2000, and the pattern is rather mixed across Member States.
Strikingly, on an overall EU basis, taxes on capital as a percentage of GDP have not changed since 2000. However, this is not only masking the developments in the meantime, but also the development in individual Member States. While almost all Member States (exceptions Hungary, Malta and Sweden) cut top corporate tax rates, some such as Malta and Cyprus envisaged a considerable increase in capital taxes. Compared to 2000 the contribution
4
of labor and consumption taxes has slightly declined; labor taxes have indeed significantly increased only in seven Member States, while in 12 others they contributed in a non-negligible way to reducing overall taxation. Despite significant changes in many Member States, consumption taxes as % of GDP are, on average, only slightly below their 2000 levels. The biggest increase in consumption taxes are envisaged in New Member States, where adjustments to EU requirements in these fields, such as minimum tax rate on energy products, still had to be made.
Figure no.3 Relative contribution of taxes on labour, capital and consumption to the change in the total tax-to-GDP ratio, by country 2000-2008, in % of GDP
Source: „Taxation Trends in the European Union”, European Commission, 2010
The three main implicit tax rates are here juxtaposed to highlight four main facts: 1. implicit tax rates on labor remain well above those for capital and consumption; 2. after a declining trend, labor taxation stabilized from 2004 onwards;
3. effective taxation of capital was on the increase till 2007; this was the case despite considerable cuts in the top corporate tax rates, most likely indicating a base broadening;
4. since 2001 consumption taxation has been trending upwards slowly, before falling slightly in 2008.
2. THE ANALYZE OF THE TAXATION LEVEL EVOLUTION IN ROMANIA
Fiscal policy measures promoted by the tax authorities from our country, during 2001-2008, along with other factors, among which the quality of state tax claims management and the degree of voluntary tax compliance, as well as the pressure they exercised has influenced the level and structure of tax revenue.
The overall tax-to-GDP ratio of Romania is at 28.0 % in 2008, nine percentage points lower than the EU-27 average (37.0 %). The levels of taxation in Romania is the lowest in the EU and markedly lower than in neighboring Bulgaria (33.3 %) and Hungary (40.4 %).
social contributions accounts for 33.3 % (EU-27 30.2 %) and direct taxes only for 24.0 % (EU-27 32.4 %).
Because of this structure, the share of VAT on total tax (including social contributions) revenue in 2008 (28.2 %) was the third highest in the Union. The low level of direct taxes is mainly due to low personal income taxes (merely 3.4 % of GDP), amounting to around 42 % of the EU-27 average.
The share of central government revenue forms more than half of the total (62.9 %), while local government revenues are marginal, consisting of only 3.2 %. The revenue shares received by the social security funds account for 32.9 %, almost four percentage points above the EU-27 average. In per cent of GDP, however, the revenues of the social security funds are 1.5 percentage points below the EU average.
In table 1 is presented the evolution of gross domestic product and of tax revenues of Romania, as well as the level of taxation in the 2000-2009 period.
Table no.1 The taxation level evolution in Romania, during the period: 2000-2009
Year GDP(mill. lei) Fiscal revenues (mill. lei)
General level of taxation (%)
2000 80377,3 11439,4 14,23
2001 116768,7 13727,7 11,76
2002 151475,1 16775,3 11,07
2003 190335,4 23602,3 12,40
2004 238791,4 30252,7 12,67
2005 287186,3 34531,2 12,02
2006 342400 37900,2 11,07
2007 404700 44824,2 11,08
2008 503958,7 60475 12
2009 491273,7 14716,1 -
Source: www.insse.ro
In the considered period, the level of general taxation, calculated by taking into account all taxes, fees and contributions received by central and local public authorities, registered, except 2003, 2004, 2005, a continuing downward trend, from 14.23 % in 2000 to 10.8% in 2008. Overall, the level of general taxation in the analyzed period, decreased by 3.15 percentage points.
Given that, after 2000, gross domestic product began to grow from year to year in real terms, decreasing trend level of taxation can be assessed as a result of the general trend of fiscal relaxation manifested in recent years5.
5
14,23
11,76 11,07
12,4 12,67 12,02
11,07 11,08 12 0 100000 200000 300000 400000 500000 600000
1 2 3 4 5 6 7 8 9 10
0 2 4 6 8 10 12 14 16
GDP(mill. lei) Fiscal revenues (mill. lei) General level of taxation (%)
Figure no. 4 The evolution of taxation level in Romania (2000-2008)
Source: www.insse.ro
For a complete image of the way of tax burden distribution in our country are presented below the percentage of the main categories of tax revenue in total tax revenue and in the gross domestic product, during 2000-2009.
Table no. 2 The structure of Romania tax revenues (direct taxes) (2000-2009)
Source: www.insse.ro
Within tax revenue, indirect taxes, while declining, have a share higher than the direct ones. Given that direct taxes are characterized by high sensitivity to economic fluctuations, the increasing of indirect taxes share in total public revenues shows that when the economy does not work, because of economic and social bottlenecks, the most reliable source of
Year Fiscal revenues (mill. lei) Direct taxes (mill. lei) Profit tax (mill. lei) Wage tax (mill.
lei)
Income tax (mill. lei)
The percentage of direct tax in tax
revenues (%)
2000 11439.4 3147.2 1992.7 162.9 2437.4 27.51%
2001 13727.7 4114.6 2199.1 40 3647.9 29.97%
2002 16775.3 4185.2 2997.9 30 4132.3 24.95%
2003 23602.3 5019.3 4368.1 25 5326.9 21.27%
2004 30252.7 7585.4 6441.6 16.7 7103.7 25.07%
2005 34531.2 8962.5 6495.3 74.8 6670.3 25.95%
2006 37900.2 14122.4 7905.5 14.5 9739.3 37.26%
2007 44824.2 15491.4 10528.9 48.8 13828.8 34.56%
2008 54427,5 18563,2 13039,9 15,5 18398,3 34,10%
income remains tax consumption, especially since this is the only way the revenues created in the underground economy can be taxed6.
The distribution of tax burdens in our country is also reflected by the evolution of the proportions in which the main tax categories participates in the formation of public revenues.
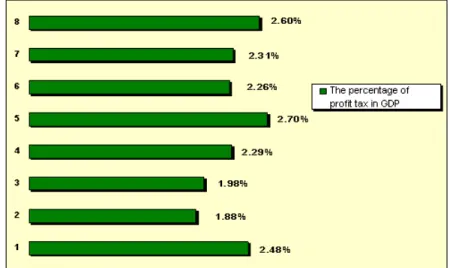
Figure no. 5 The evolution of the profit tax in Romania’s GDP (2000-2007)
Source: www.insse.ro
Profit taxes represent around 2.6% of GDP. The evolution of corporate tax revenue is closely linked to regulatory changes and to the evolution of the overall economy, and can be attributed to the reduction since 2000 of the tax rate from 38% to 25% and subsequently to 16 %.
Amid a low corporate income tax and having the advantage of EU membership, Romania has become an important destination for foreign direct investment in recent years.
Foreign direct investment (FDI) is generally attracted by several factors such as: market size and its potential development, factor costs, especially labor cost, but also human capital (education and skills), trade openness, infrastructure reform, price liberalization, fiscal policy, institutional development, technological absorption capacity etc. The importance of one or other factor, changes in time. For instance, during the first years of transition in the Central and Eastern Europe countries, political stability and macroeconomic stabilization, including institutional development, were premises of interest for foreign investors (Masso and other, 2007).
Considering the many benefits generated by transnational companies locating in an economy is very important the attraction of FDI in all fields. In recent years, Romania has managed to attract a significant volume of FDI but which were located mainly in certain areas. Economic and financial performance analysis of subsidiaries of Orange transnational company working in EU can be particularly useful in the prediction of future locations of FDI.
This analysis was made on the base of the information available at the National Trade Register Office for all subsidiaries, during the 2005-2009.
To obtain the necessarily processed information we designed an information system in the Microsoft Access environment (Barbu and Bănică, 2008), flexible and easy to use, thanks to a friendly graphical interface.
6
3. THE PRESENTATION OF THE SOFTWARE TOOL AND ITS APPLICATION ON ORANGE COMPANY
The corporation activity represents a factor of major interest for the economies of all the States due to the economic and social effects that it generates: creating new places of work, increasing work productivity, increasing product competitiveness, multiplying the income sources which all lead to the increase of the budget revenues. Under the conditions of the economic globalization, multinational companies have the possibility to find the best production premises, according to the conditions that the respective markets provide. The conditions of tax nature have an influence on corporations’ investment localization decisions and capital flows so that the policy of each State in the field of corporative income tax payment must constitute the object of a very careful analysis. Thus, the companies choose to carry out their activity in the countries where they can obtain the biggest net profit (after the tax payment) after carrying out their specific operations7.
In this context, we designed an information system that we will call hereinafter Evaluation System of the EU Taxation over the subsidiaries of the transnational companies-SAF”, which aims at establishing the influence of the profits tax rate over the financial results of the UE subsidiaries of a multinational firm. In order to implement the software application, several subsidiaries have been chosen in member states that had (or not) registered profit over the last years.
The comparative analysis of the influence of the tax system over the companies that hold a foreign capital represents a very useful economic tool, both for the potential investors, and for the transnational companies that wish to extend their activity or to redirect themselves toward other areas or other states, more attractive, that grant bigger facilities.
Orange is the key brand of France Telecom Company, one of the leading telecommunications operators worldwide, the main telecommunication company in France, the third largest in Europe and one of the largest in the world. Currently it has about 180,000 employees, 192.7 million customers worldwide and revenues of € 53.5 billion.
Orange is the third mobile operator and second provider of broadband services in Europe, and under the brand Orange Business Services is a world leader in providing telecommunications services to multinational companies.
Orange Telecommunication GMBH Austria is an Austrian mobile network operator. It started its business in 1998 as owner of the third GSM license of the country, and the first provider operating in the GSM 1800 band. Since 2004, Orange (previously known as ONE) successfully applied for a UMTS-License and offers since 2005 also UMTS Services. ONE's logo was a blue circle. It was rebranded Orange on 22 September 2008.
Orange Business Italy SPA started its activity on June 10, 1992 as a subsidiary of Global mobile operator Orange SA, the mobile division of France Telecom.
Orange Romania is the largest GSM operator in Romania. Orange Romania is the Romanian subsidiary of the global mobile operator Orange SA, the mobile division of France Telecom, which holds 96.8% of the stake. Until November 2007, Orange has invested about 1.4 billion Euros since it’s entering on the Romanian market. By April 2002, Orange operated under the Dialogue brand. In February 2006, Orange Romania had over 7 million customers, giving it a market share of 56.95%. With population coverage of 96.6%, Orange Romania
7
offers each person the possibility to choose between flexible subscriptions plans that can be customized, and PrePay.
Orange is in direct competition with Vodafone for the 13.7 million mobile users in Romania. Other major competitors in the mobile market in Romania are: Cosmote Romania, Zapp Mobile (CDMA) and RCS & RDS.
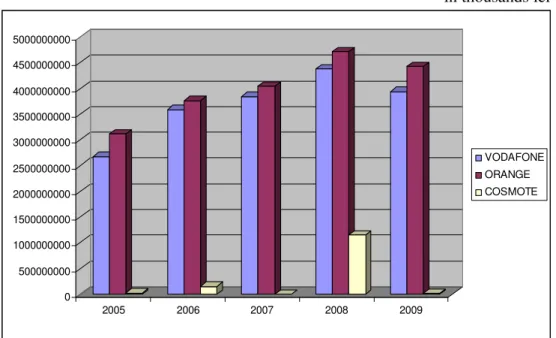
To highlight the place it holds the Orange Company on the national telecommunications market, we made graphs showing the evolution of the key indicators: turnover, gross profit, net profit and number of employees (during 2005-2009) compared with the level of the same indicators to rivals.
Turnover is an indicator that measures the results at the macroeconomic level, representing the volume of revenues from its own activity in a period of time, collections made at market price.
-in thousands lei-
0 500000000 1000000000 1500000000 2000000000 2500000000 3000000000 3500000000 4000000000 4500000000 5000000000
2005 2006 2007 2008 2009
VODAFONE
ORANGE
COSMOTE
Figure no. 6 The evolution of the turnover in the period 2005 - 2009
Source: www.insse.ro
During the analyzed period the evolution of turnover followed a rising trend, the Orange company being market leader in this segment, so that if in 2005 recorded a indicator value of 3.117.581.646 thousands lei, in 2009 we can talk about a 4.425.242.036 thousands lei value, that is 1.51 times more.
Regarding this chapter also, Orange is market leader, gross profit evolution being a cyclic one, as seen from the chart, so in 2006 it shows a growth of 1.39 times of the indicator value, compared to 2005.
-in thousands lei-
-500000000 0 500000000 1000000000 1500000000 2000000000
2005 2006 2007 2008 2009
VODAFONE
ORANGE
COSMOTE
Figure no. 7 The evolution of the Gross Profit during the period 2005 – 2009 * Note: the dates from Cosmote weren’t available for 2009
Source: www.insse.ro
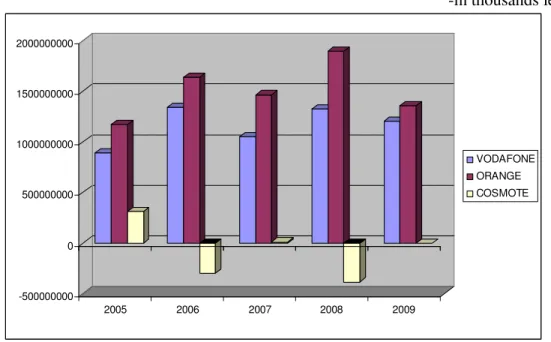
In the considered period, net profit, calculated as the difference between gross profits earned by an economic entity and related income tax, is highlighted in Figure no.8:
-in thousands lei-
-400000000 -200000000 0 200000000 400000000 600000000 800000000 1000000000 1200000000 1400000000 1600000000 1800000000
2005 2006 2007 2008 2009
VODAFONE ORANGE COSMOTE
Figure no. 8 The evolution of net profit in the period: 2005 - 2009
As is shown in the chart, Orange registered an increase of the net profit, reaching the maximum value of this indicator in 2008, 1.611.787.768 thousand lei, i.e. 1.128.555.797 thousand lei, ranking first. In 2009,Orange net profit decreased to 1.146.846.734 thousand lei. The comparative analyze use as input data the information reported by the xxx subsidiaries of Orange Corporation in the period 2005-2009. Economic and financial performances of subsidiaries of transnational company Orange were analyzed using the following indicators: the total number of employees, the average level of turnover, the average level of rates of return, the average level of net profit share in total expenditure.
The system’s architecturecomprises 5 subsystems, described briefly, as follows:
• S1 – the subsystem” The comparative analysis of the evolution of the Gross Profit in the subsidiaries of the Orange Corporation (in USD) “.
• S2 – the subsystem “The analyze of the profits tax, according to the legislation
of the analyzed countries”.
The analyze is calculated based on Net profits and Total expenses, using the formula:
PN_expenditure: [Net profit]/[Total expenses]*100
• S3 - the subsystem “The comparison of the Turnover evolution for the
subsidiaries involved”.
• S4 – the subsystem “The comparison of the total number of Employees
evolution for the subsidiaries involved”.
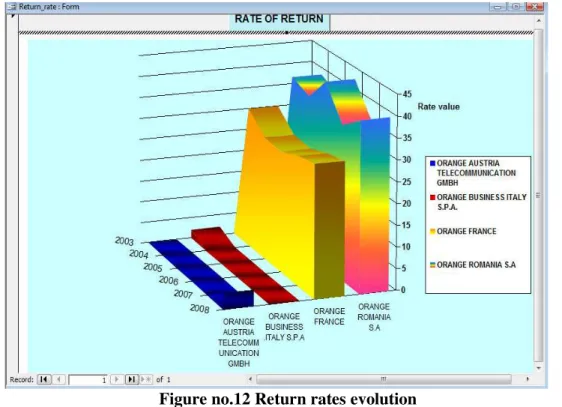
• S5 – the subsystem „Calculation and evolution of the Return rate for the subsidiaries involved”
This reflects the results of firm’s activity, emphasizing the level of efficiency of its financial effort, named “The evolution of return rates”:
rate of return is calculated by comparing the values of gross profit to turnover using the following formula:
Return Rate: [Profit before tax]/ [Annual turnover]*100 (2)
is made the comparative analysis based on the report and chart of the return rates evolution during 2003-2008.
S1 Subsystem – “Comparative analysis of gross profit evolution” indicates a general increase of the gross profit to the subsidiary from France and Romania. Probably, the statistic data that are to be published in 2010 will record a considerable decrease of the gross profit level, because of the world’s economy crisis, which also affected the investments in France and Romania.
S2 subsystem - “The profits tax analysis“, shown in figure no. 10, reflects the indicators evolution at the Orange company’s four subsidiaries, once again, France holding the leading position in this chapter.
Figure no. 10 Net profit evolution reported to total expenditure
S4 subsystem - “The comparative analysis of the total number of employees evolution for the Orange subsidiaries”, highlights the need for staff to achieve the objectives, the higher value of the indicator, as shown in the form of presentation, is registered by the subsidiary of France, the opposite being the subsidiary of Italy.
Figure no. 11 Total employee evolution
Figure no.12 Return rates evolution
The information system has been practically implemented in the Microsoft Access environment and it is easy to use, thanks to a friendly graphical interface.
4. CONCLUSIONS
Under the circumstances in which the capital flows freely and the taxation level is different depending upon each country, multinational companies can use a full range of tax optimization strategies (profits transfer in the areas having a low taxation level or set-up of financial departments in tax heavens for investments financing purposes by crediting lines within the group) which shall generate incomes losses in the countries having a high tax level and disadvantages to small and medium enterprises participating in the competition on the same market.
By comparing the different tax systems when they decide how to place their productive investments, multinational companies shall prefer countries offering the most advantageous tax conditions.
The SAF Software reconsiders the approach manner of a business in a different country, based on specific data, statistically linked and processed.
Achieving a system of analysis and monitoring the taxation system influence upon the foreign investments is a challenge for any transnational company.
The created software, Analysis system of taxation in the European Union – SAF, is destined to both potential investors and transnational companies that want to expand their activity or to shift to other areas or states, more attractive, which grants greater facilities.
REFERENCES
1. European Commission (2001), “Tax policy in the European Union Priorities for the years ahead”, Brussels, COM(2001)260 final.
2. European Commission (2001), “Towards an Internal Market without tax obstacles: A strategy for providing companies with a consolidated corporate tax base for their EU-wide activities”, COM (2001) 582 final.
3. European Commission (2007), “Implementing the Community Programme for improved growth and employment and the enhanced competitiveness of EU business: Further Progress during 2006 and next steps towards a proposal on the Common Consolidated Corporate Tax Base (CCCTB)”, COM(2007) 223 final.
4. Copenhagen Economics (2004), Economic effects of tax cooperation in an enlarged European Union. Study prepared for the European Commission, October 2004, p. 49-50
5. Common consolidated corporate tax base working group (CCCTB WG), CCCTB: possible elements of the sharing mechanism, Brussels, 13 November 2007
6. Devereux, M. P., Loretz, S., Increased efficiency through consolidation and formula apportionment in the European Union?, Oxford University, Centre for Business Taxation, Working Paper no. 12, 2008
7. Devereux, M. P., Loretz, S., The effects of EU formula apportionment on corporate tax revenues, Oxford University, Centre for Business Taxation, Working Paper no. 6, 2007
8. Matei Gh., Pirvu D., Principles and rules for defining of common consolidated tax base in the European Union, Finance - Challenges of the Future, 2010, vol. 1, issue 11, pages 101-107
9. Brøchner Jens, Jensen Jesper, Svensson Patrik, Sørensen Peter Birch, The dilemmas of tax coordination in the enlarged European Union, CESIFO Working Paper no. 1859, 2006, p. 26
10.Fuest, C., Hemmelgarn, T., Ramb, F., How would formula apportionment in the EU affect the distribution and the size of the corporate tax base? An analysis based on German multinationals, Deutsche Bundesbank, Discussion Paper, Series 1: Economic Studies, no. 20, 2006, p. 19-20
11.Bettendorf, L., van der Horst, A., de Mooij, R., Vrijburg, H., Corporate Tax Consolidation and Enhanced Cooperation in the European Union, ?, Oxford University, Centre for Business Taxation, Working Paper no. 1, 2010, p. 17
12.National Trade Register Office of Romania, Stats. Companies with foreign capital participation
13.Ministry of Public Finance of Romania, database on businesses and public institutions - identification data, tax information, balances.