Atmos. Chem. Phys., 9, 635–665, 2009 www.atmos-chem-phys.net/9/635/2009/
© Author(s) 2009. This work is distributed under the Creative Commons Attribution 3.0 License.
Atmospheric
Chemistry
and Physics
Gas phase precursors to anthropogenic secondary organic aerosol:
detailed observations of 1,3,5-trimethylbenzene photooxidation
K. P. Wyche1, P. S. Monks1, A. M. Ellis1, R. L. Cordell1, A. E. Parker1, C. Whyte1, A. Metzger2, J. Dommen2, J. Duplissy2, A. S. H. Prevot2, U. Baltensperger2, A. R. Rickard3, and F. Wulfert4
1Atmospheric Chemistry, Department of Chemistry, University of Leicester, Leicester, LE1 7RH, UK 2Laboratory of Atmospheric Chemistry, Paul Scherrer Institut, 5232, Villigen, Switzerland
3National Centre for Atmospheric Science, University of Leeds, Leeds, LS2 9JT, UK
4Division of Food Sciences, University of Nottingham, Sutton Bonington Campus, Loughborough, LE12 5RD, UK Received: 15 April 2008 – Published in Atmos. Chem. Phys. Discuss.: 13 June 2008
Revised: 1 December 2008 – Accepted: 1 December 2008 – Published: 27 January 2009
Abstract. A series of photooxidation experiments were conducted in an atmospheric simulation chamber in order to investigate the oxidation mechanism and secondary or-ganic aerosol (SOA) formation potential of the model an-thropogenic gas phase precursor, 1,3,5-trimethylbenzene. Alongside specific aerosol measurements, comprehensive gas phase measurements, primarily by Chemical Ionisa-tion ReacIonisa-tion Time-of-Flight Mass Spectrometry (CIR-TOF-MS), were carried out to provide detailed insight into the composition and behaviour of the organic components of the gas phase matrix during SOA formation. An array of gas phase organic compounds was measured during the ox-idation process, including several previously unmeasured primary bicyclic compounds possessing various functional groups. Analysis of results obtained during this study im-plies that these peroxide bicyclic species along with a series of ring opening products and organic acids contribute to SOA growth. The effect of varying the VOC/NOx ratio on SOA formation was explored, as was the effect of acid seeding. It was found that low NOxconditions favour more rapid aerosol formation and a higher aerosol yield, a result that implies a role for organic peroxides in the nucleation process and SOA growth.
1 Introduction
Secondary organic aerosol (SOA) is formed in the atmo-sphere from the oxidation products of certain biogenic
Correspondence to:P. S. Monks (p.s.monks@le.ac.uk)
and anthropogenic volatile organic compounds (VOCs) (Finlayson-Pitts and Pitts Jr., 2000). One important class of such compounds known to be precursors to SOA are aromatic hydrocarbons (Stern et al., 1987; Odum et al., 1997). Possessing complex and extensive atmospheric re-action pathways, aromatic VOCs (AVOCs) have the abil-ity to yield a wide array of secondary oxygenated and ni-trated volatile, semi-volatile and non-volatile organic prod-ucts which contain a multitude of different functional groups (e.g. Atkinson, 2000; Hamilton et al., 2003; Johnson et al., 2005; Sax et al., 2005; Bloss et al., 2005b).
Released principally from automobile exhaust emissions, industrial scale combustion and the evaporation of fuels and solvents (Friedrich and Obermeier, 1999), AVOCs make up as much as 40% of the total mass of anthropogenic hydrocar-bon emissions in the city environment (Smith et al., 1999). On the global scale total aromatic emissions are of the or-der 15.8 Tg y−1(Tsigaridis and Kanakidou, 2003), which ac-counts for∼15 % of the annual anthropogenic non-methane hydrocarbon (NMHC) budget (Bloss et al., 2005a). As well as constituting precursors to SOA production, AVOCs gener-ally have high photochemical ozone creation potentials and hence contribute significantly towards tropospheric ozone pollution (Calvert et al., 2002; Derwent et al., 2003, 2007a, 2007b).
The existence of SOA in the atmosphere (and particulate matter in general) has an array of well documented conse-quences (e.g. Czoschke et al., 2003; Kanakidou et al., 2005; IPCC, 2007 and references therein). In brief, such negative effects range from visibility impairment on the local scale to climate change, with SOA being capable of perturbing the Earth’s radiative budget via both direct and indirect mecha-nisms. Additionally, fine airborne particles have been shown to exert numerous detrimental effects on human health, par-ticularly in vulnerable members of the population (Grosjean, 1992).
As highlighted in recent reviews (e.g. Seinfeld and Pankow, 2003; Kanakidou et al., 2005; Holmes, 2007), de-spite its crucial impact upon the Earth-atmosphere system, there currently remains a certain lack of understanding re-garding the physical and chemical properties of SOA, its chemical composition and crucially the atmospheric pro-cesses by which it is formed.
Over the last decade much research and many state of the art techniques have been applied to the critical problem of determining SOA chemical composition, with off-line GC-MS analysis of filter samples often providing the foundation. However, such studies have supplied limited molecular level classification, with generally no more than 30% of the total SOA mass being identified (e.g. Forstner et al., 1997; Klein-dienst et al., 1999; Cocker III et al., 2001; Hamilton et al., 2003; Edney et al., 2005; Surratt et al., 2006).
A series of recent discoveries have allowed significant advancement to be made in our understanding of SOA composition and the role of relatively low molecular mass species in aerosol growth. It has been proposed that be-tween 20 and 50% of SOA mass could be comprised of large multi-functional macromolecular compounds known as “humic-like substances” (HULIS) (Havers et al., 1998), which would go undetected using standard GC-MS tech-niques. Research has suggested that such compounds are secondary in nature, being formed by heterogeneous poly-merisation/oligomerisation reactions in the aerosol. For ex-ample, Jang and Kamens (Jang and Kamens, 2001) wit-nessed an increase in SOA yield when various gas phase aldehyde compounds were injected into a synthetic air matrix impregnated with acidic seed particles. The authors attribute the increase in SOA mass to heterogeneous hydration and polymerisation reactions of low molecular mass aldehydes following their transfer from the gas phase. Their findings also indicated that hemiacetal/acetal formation is also an im-portant contributing pathway to increased SOA yields when alcohols were also present.
Numerous investigations have since confirmed the exis-tence of polymeric/oligomeric compounds in various SOA systems of both anthropogenic (Gross et al., 2006) and bio-genic (Surratt et al., 2006) origin, both in simulation cham-ber studies (Baltensperger et al., 2005) and in the “real” at-mosphere (Kalberer et al., 2006), with molecular masses as large as 1600 Da (Gao et al., 2004). One such study by
Kalberer et al. (2004) demonstrated that as much as 50% of the SOA mass formed during the photooxidation of 1,3,5-trimethylbenzene was composed of polymers (Kalberer et al., 2004). The authors proposed that the polymers, which were detected with masses as high as 1000 Da, were formed primarily through acetal polymerisation involving the known trimethylbenzene photooxidation product methyl glyoxal in the presence of water.
With a large portion of current research into SOA forma-tion geared towards investigaforma-tion of the aerosol phase, there exists a distinct lack of detailed understanding of the con-comitant gas phase organic components of the system. In-deed limited work has been conducted to help illuminate the actual mechanisms of SOA formation from the view point of the gas phase. Recently, research has shown that the SOA forming capacity of aromatic systems is strongly related to the gas phase [NOx], with greater SOA yields obtained un-der low NOx conditions (Izumi et al., 1988; Stroud et al., 2004; Song et al., 2005; Ng et al., 2007). Conclusions drawn from such work infer an important role for gas phase organic peroxides in initiating the formation of SOA (Johnson et al., 2004), but no direct evidence is available to support this.
In the present study we begin to address these issues by presenting findings from a series of comprehensive photoox-idation experiments conducted in an atmospheric simula-tion chamber. The main aim of the study was to monitor, in detail and with good temporal resolution, the complex array of gaseous organic oxidation products derived from known SOA precursors, and in doing so elucidate underly-ing degradation mechanisms and identify potential species contributing to incipient aerosol formation and growth. In this instance the common, but less well studied anthro-pogenic AVOC, 1,3,5-trimethylbenzene (TMB) was chosen as a model anthropogenic SOA precursor. The effect of vari-ation of the initial VOC/NOx ratio on SOA formation was explored, as was the potential role of acid-catalysed hetero-geneous chemistry. As well as presenting information that provides new insight into the mechanisms of SOA forming intermediates and potential SOA forming species, this work presents the first measurements of a set of previously unde-tected high mass oxygen-bridged bicyclic compounds, which are formed during aromatic oxidation.
K. P. Wyche et al.: Secondary organic aerosol formation from 1,3,5-trimethylbenzene photooxidation 637
2 Experimental
2.1 The Paul Scherrer Institut aerosol chamber
Experiments were carried out at the Paul Scherrer Institut aerosol chamber facility (Ch.). The chamber comprises a single-lined collapsible bag constructed from DuPont fluori-nated ethylene propylene (FEP) film, with a wall thickness of 125µm and a volume of 27 m3(3×3×3 m3). The chamber surface area to volume ratio (2 m−1) is relatively small when compared to most environment chambers, allowing wall ef-fects to be minimized. The chamber bag is held by a large metal frame inside a temperature-controlled wooden hous-ing, which was maintained at 20◦C (±1◦C) during all ex-periments. Four 4 kW xenon arc lamps, deployed at various points inside the housing were employed to simulate the so-lar spectrum (Paulsen et al., 2005).
The chamber sample gas comprised purified ambient air, which was produced by a clean air generator (AADCO In-struments Inc., USA). Chamber humidification was facili-tated by bubbling the bulk matrix gas through a heated glass vessel containing high purity deionized water (15 M) prior to the injection of other compounds. The chamber humidity was typically near 50% during each experiment.
Delivery of the VOC SOA precursor to the chamber took place via syringe injection of the liquid compound into a heated injector port, which facilitated compound volatilisa-tion before entry into the bag. A period of 30 min was al-lowed for mixing to create a homogeneous sample matrix before any measurements were made. The chamber does not employ fan assisted mixing.
In order to remove any potential organic impurities from the chamber and hence to eliminate unwanted artefacts from the data (in the form of SOA formed from species other than the TMB), the chamber bag was scrubbed with ozone (2– 7 ppmV) for 5 h, before being flushed thoroughly with puri-fied ambient air for approximately 30 h prior to each experi-ment.
On-line measurements of chamber nitric oxide (NO) and NOxconcentrations were made throughout each experiment using a Monitor Labs 9841A NOx analyser (for NOx con-centrations: 50–2000 ppbV) and a Thermo Environmental Instruments 42C trace level NOx photolytic converter (for NOx concentrations: 0–200 ppbV). Ozone measurements were also conducted in real-time using an ozone analyser (Environics model S300). The aerosol phase was moni-tored using two TSI (3025 and 3022A) condensation particle counters (CPC, size range: particle diameter (Dp) ≥3 nm) and a Sampling Mobility Particle Sizer (SMPS, size range: 15≤Dp≤690 nm), providing information on the total num-ber density of particles in the chamnum-ber along with particle geometric mean diameter and aerosol volume concentration (see Dommen et al., 2006 for further instrument details).
2.2 Experiment design
In order to explore the effect of NOx on the TMB-SOA system, experiments were conducted with various initial VOC/NOxratios. For the first part of the study, chamber ex-periments were conducted with high concentrations of VOC (>500 ppbV) and NOx(>250 ppbV). For these “high NOx” experiments nitric oxide and nitrogen dioxide (NO2) gases (Air Liquide, Ch., grade N6.0) were added to the chamber via an inlet injection system prior to introduction of the VOC. Experiments with initial VOC/NOx ratios of approximately 2:1, 2:1 (with NO only) and 1:2 were carried out during the high NOxpart of the study.
As well as conducting high NOx chamber experiments with input of all gases to the chamber before initiation of the photochemistry, two “low NOx” concentration experi-ments were conducted in order to simulate more realistic at-mospheric conditions. In these experiments a constant low level source of nitrous acid (HONO) was used to supply NO to the system in place of NO and NO2gases. HONO was pro-duced by reaction of a sodium nitrite solution with sulphuric acid in a flow system. A nitrogen carrier gas was passed through the mixture continuously in order to purge nitrous acid vapour out and into the chamber bag (Taira and Yukio, 1990). This process provided a constant HONO mixing ratio of roughly 10 ppbV throughout each low NOx experiment. Consequently, the low concentration experiments had high initial VOC/NOxratios of∼16:1. In order to provide a brief exploration into the effect of an inorganic seed, for experi-ment 7 (see below), 400 pptV sulphur dioxide (SO2) gas was added to the chamber. Table 1 lists the specific starting con-ditions used for each experiment.
2.3 VOC/OVOC measurement with chemical ionisation re-action time-of-flight mass spectrometry
Table 1.Summary of the major gas phase parameters for experiments 1–7 along with specific CIR-TOF-MS conditions employed for VOC monitoring.
Exp. Initial [VOC]/ Initial [NO]/ Initial [NO2]/ VOC/NOx Relative Exp. Peak [OH]2/ Average CIR-MS
No. ppbV ppbV ppbV Ratio humidity/ duration1/ pptV [OH]2/ conditions3
% mins. pptV (E/N)/Td
1 560 129 141 2.07 52 539 0.06 0.04 120/170
2 1180 535 0 2.21 49 521 0.04 0.02 120/170
3 143 134 129 0.54 48 596 0.08 0.06 140/140
4 554 135 129 2.10 52 521 0.04 0.02 120/150
5 151 Continuous HONO input4 ∼15.10 62 488 0.06 0.05 90/150
6 597 135 130 2.25 53 462 0.04 0.03 90/190
7 166 Continuous HONO input4 ∼16.60 50 549 0.08 0.06 90/190
1Experiment duration taken from the time that chamber lights were switched on 2Estimated peak and experiment average [OH] inferred from TMB measurement 3E/Nconditions of the centre reaction cell/ECC ramping region
4HONO injected continuously throughout experiment, chamber concentration∼10 ppbV
spectrometer equipped with a wide bore reflectron array. In the current study proton transfer was used as the means of ionization and the proton donor was the hydronium ion (H3O+) (Lindinger et al., 1993). In order to generate the primary reagent ions, water vapour was delivered to the ion source by bubbling a high purity nitrogen carrier gas (Air Liquid, Ch, grade 7.0) through a glass vessel containing ultra-pure deionized water (15 M) at a rate of 30–52 sccm. Sample air from the PSI aerosol chamber was delivered to the CIR-TOF-MS at a rate of 200–275 sccm via an insulated 2 m long Teflon line and a PTFE critical orifice. Both the sample line and critical orifice were heated to 40◦C (±1◦C) in order to limit wall losses. For brief intervals during certain experi-ments a particle filter was placed in the sample line to verify that all measured signals were due to gas phase species. The combined reagent and sample gas flows led to drift cell op-erating pressures in the range 6–9 mbar. A positive potential difference was applied across the drift cell to guide the ions into the mass spectrometer. The drift cell electric field (and therefore internal energy) was varied for certain experiments in order to enhance sensitivity to certain VOCs (see Table 1). The potential difference between the final two electrodes of the cell was varied to facilitate collision-induced dissociation of the ionised sample and hence to allow controlled removal of unwanted water cluster ions, i.e. MH+.(H2O)n(where M represents the target VOC andnis≥1). The experiment spe-cific drift cellE/Nratios (whereEis the electric field and Nis the gas number density) are provided in Table 1.
As stated earlier, an important feature of time-of-flight mass spectrometry is the ability to achieve a much higher mass resolution than alternative techniques, notably quadrupole mass spectrometry. The mass resolution attained in the current study was in the region of 0.01 Da, which has proved useful in confirming the assignment of several high mass peaks.
The sum of hydro and organic peroxy radicals (i.e.
P
(HO2+6iRiO2)) present in the chamber was also mea-sured during low NOx experiments using a dual channel Peroxy Radical Chemical Amplifier (PERCA). The PERCA deployed during this work was similar to that described in Green et al. (2006), but with inlet systems as per Monks et al. (1998).
2.4 Calibration
A wide array of compounds was detected using the CIR-TOF-MS and it was therefore impractical to carry out in-dependent calibrations for all measured species. Conse-quently, where no calibration standard was available for a given compound the calibration factor determined for a structurally similar surrogate was utilised (see supplemen-tary material http://www.atmos-chem-phys.net/9/635/2009/ acp-9-635-2009-supplement.pdf, Table A1). If no appro-priate surrogate could be found, measurements are reported in terms of instrument signal (i.e. normalised ion counts per second (ncps) see Sect. 3.7). VOC yields quoted in the fol-lowing discussion therefore act only as a guide for those compounds where surrogates have been employed. Table A1 provides comprehensive details of all VOC calibrations em-ployed in the current study. Considering all instrument and calibration associated uncertainties (Wyche et al., 2007), the overall CIR-TOF-MS measurement errors lay within the range 2.9–27.6% (see Table A1).
K. P. Wyche et al.: Secondary organic aerosol formation from 1,3,5-trimethylbenzene photooxidation 639
0 200 400 600 0
100 200 300 400
0 200 400 600
0 200 400 600 0
50 100 150 200 250
[1,
3
,5 TMB]
/
ppbV
0 50 100 150 200
Time / Minutes
0 200 400
[N
O
], [N
O
2], [O
3
] /
ppbV
0 150 300 450 600
600 800 1000 1200
0 200 400 600 0
50 100 150
0 50 100 150 200
NO
O3
TMB
TMB
O3
NO2
NO
TMB
O3
NO2
NO
TMB
O3
NO2
NO
(a)
(b)
(c)
(d)
NO2
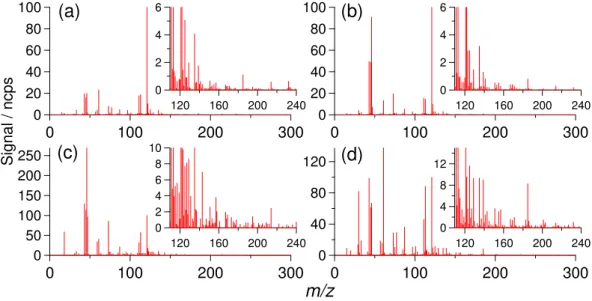
Fig. 1. Temporal evolution of the major gas phase components of the 1,3,5-TMB photooxidation system during (a) experiment 6 (VOC/NOx∼2:1),(b)experiment 2 (VOC/NOx∼2:1, NO only),(c)experiment 3 (VOC/NOx∼1:2) and(d)experiment 7 (VOC/NOx∼17:1).
In each plot the left ordinate axis gives the concentration of the inorganic components (NO, NO2and O3) while the right axis gives the
con-centration of TMB. For (a) and (d) the chamber lights were switched off for the “dark phase” at 460 and 550 min, respectively, followed by NO injection (see text for details).
uncertainties this gives an estimated peroxy radical uncer-tainty of 42% (Fleming et al., 2006a, 2006b).
3 Results and discussion
The chamber conditions in this work can be broadly di-vided into two groups, high NOx and low NOx. In the high NOx experiments the initial NOx concentration was >250 ppbV, whereas low NOx conditions corresponded to NOxat≤5 ppbV. The results from the high and low NOx ex-periments are reported separately in the following sections. Comparisons of gas and aerosol phase measurements carried out under different VOC/NOxregimes are utilised during the present study to help elucidate the underlying SOA formation mechanisms.
3.1 Chamber inorganic species and the SOA precursor un-der high NOxconditions
Figure 1a–d displays the temporal evolution of the major in-organic gas phase components of the chamber system and the 1,3,5-trimethylbenzene precursor in several different ex-periments (listed in Table 1). In all instances the experiment start time is taken from the point at which chamber lights were switched on and hence the photochemistry initiated. On
average the duration of each experiment was of the order of 8–10 h.
The majority of experiments (experiments 1–4 and 6; see Table 1) were carried out under high NOxconditions. Dur-ing these experiments the initial VOC/NOxratio was varied between 0.54 and 2.25. Figure 1a summarises the findings for experiment 6. Experiment 6 constitutes a typical exam-ple of a high NOxexperiment with VOC/NOx∼2:1; hence it is used as focus for discussion. The experiment essentially begins with the production of ground state atomic oxygen, which originates from the photolysis of NO2. This results in the subsequent production of ozone, photolysis of which in the presence of water, yields OH. OH can also be generated in smog chambers from HONO photolysis. HONO is gen-erally produced in all such systems following wall reactions involving NO2 (e.g. Metzger et al., 2008a). Following its production, OH reacts readily with TMB to generate a com-plex array of oxidation products, including organic peroxy radicals (RO2), hydroperoxy radicals (HO2) and oxygenated and nitrated VOCs (Calvert et al., 2002).
The oxidation profiles for TMB during all high NOx exper-iments exhibited similar behaviour, with a short initial con-centration plateau corresponding to the time required to ini-tiate the OH chemistry, followed by a peak in oxidation rate
decay. For each high NOx experiment a plot of ln[TMB] vs. time is approximately linear, with no distinct change in rate with accumulation of ozone. This result verifies that as expected 1,3,5-TMB does not react appreciably with O3. Consequently, with NO3 oxidation of TMB negligible un-der the experimental chamber conditions employed, the ma-jor chemical loss of TMB would have resulted solely from its reaction with OH. An estimation of [OH] can therefore be inferred from the rate of decay of TMB recorded by CIR-TOF-MS. For experiments with an initial VOC/NOx ra-tio of∼2:1, peak OH concentrations were∼0.04 pptV and experiment average concentrations were∼0.03 pptV (using kOH+1,3,5T MB=(5.67±1.13)×10−11cm3molecules−1s−1 at T=298 K; Calvert et al., 2002).
With the production of both HO2and RO2 radicals, NO became oxidised to NO2, leading to the concentration peak seen in Fig. 1a–c. Due to the presence of the VOC (and hence RO2), the NO/NO2 partitioning was such that there was a positive deviation from the photostationary state result-ing in net initial ozone production (Monks, 2005). As noted in other chamber studies (e.g. Bloss et al., 2005a; Dommen et al., 2006), the peak in [NO2] and the initial accumulation of O3roughly coincide with the observed maximum rate of loss of the VOC and the peak in [OH]. Eventually, NO2was removed from the gas phase through the production of nitric acid (HNO3), reactions on the chamber walls and incorpo-ration into organic nitrates and the aerosol phase (Monks, 2005). As NO2 chemistry constitutes the sole route to O3 formation within the chamber, the removal of NOxfrom the system was followed by a fall in the concentration of O3. At the conclusion of experiment 6,∼70% of the VOC precursor had been consumed and the concentrations of NO and NO2 had fallen to negligible levels (Fig. 1a).
In order to evaluate the chemical mechanisms underlying the TMB photooxidation system, at the conclusion of certain experiments the chamber lights were switched off and the total chamber ozone was titrated from the system with the addition of excess NO to the gas phase matrix. The effect of this “dark phase” on the VOC chemistry will be discussed below in Sect. 3.9, however, it should be noted at this point that the NO addition, O3titration and resultant NO2 produc-tion can be seen in Fig. 1a and d for experiments 6 and 7 (high and low NOx, respectively).
For experiment 2 (VOC/NOx∼2:1) shown in Fig. 1b, ini-tial NOxwas introduced solely in the form of NO and start-ing concentrations were set to two times those of other high NOx experiments with VOC/NOx∼2:1. To initiate the oxi-dation process in this instance, HONO and NO2had first to be liberated from the illuminated chamber walls following known heterogeneous chemical mechanisms (Stroud et al., 2004; Metzger et al., 2008a).
Experiment 3 involved a reversal of the VOC/NOx ratio to a value of roughly 1:2, but still with high starting concen-trations. As can be seen in Fig. 1c the NOx, O3and TMB components of the system exhibited similar profiles to those
observed during the other high NOxexperiments, but with a number of key exceptions. When the VOC/NOxratio was decreased to∼0.5, the rate of decay of TMB appeared en-hanced, suggesting higher levels of oxidant. In this instance inferred OH radical levels were on average∼0.06 pptV (peak
∼0.08 pptV), i.e. twice as high as levels observed in the other high NOxexperiments. This finding is most likely a result of balancing of the OH/HO2ratio in the hydroxyl radical cycle, where a relatively higher proportion of NO (with respect to that of the VOC) will force a shift towards OH in the cham-ber HOx balance. The impact of an elevated OH density is reflected in the amount of VOC consumed by the conclusion of the experiment, i.e. after 600 min less than 10% of the initial TMB remained. In addition to this, a lower RO2/NOx ratio will slow the cycling of NO to NO2 and hence delay subsequent O3 production. This effect can be seen in the data presented in Fig. 1c, where a significant delay is evident in the times at which NO2and O3reached their respective peaks, and at which NO reached negligible concentrations (when compared to experiments with VOC/NOx∼2:1).
3.2 Chamber inorganic species and the SOA precursor un-der low NOxconditions
The second component of the chamber study comprised two low NOx experiments, experiments 5 and 7, during which [NOx] was kept below∼5 ppbV. In the case of experiment 7, SO2 gas was added to the chamber in order to generate sulfuric acid (H2SO4)seed particles.
As discussed in Sect. 2.2, during the low NOxexperiments the chamber was supplied with a continuous source of NO (from HONO) at a rate greater than the sum of its removal pathways. Consequently, the chamber remained in a state of net ozone production throughout the experiment and there-fore no distinct peak and fall was observed in the ozone con-centration profile (see Fig. 1d).
In addition to supplying the chamber with NO, HONO photolysis constituted an additional source of OH. The pho-tolysis rate of nitrous acid (j(HONO)) for the PSI cham-ber has been measured as 2.7×10⁻⁴s−1, which yields an OH production rate (P(OH)) of 2.7 pptV s−1 for a constant HONO value of 10 ppbV. As P(OH) from the photolysis of HONO was several times larger than P(OH) from ozone at any instant during the low NOxexperiments, the level of OH in the chamber was roughly constant. Evidence for this can be seen in Fig. 1d, where the rate of decay of TMB during experiment 7 remained roughly constant during the major-ity of the experiment. Using the rate of oxidation of TMB (as described in Sect. 3.1), the average OH concentrations in the chamber for the two low NOxexperiments 5 and 7 were estimated to be∼0.05 and 0.06 pptV.
K. P. Wyche et al.: Secondary organic aerosol formation from 1,3,5-trimethylbenzene photooxidation 641
Table 2.Summary of the aerosol-pahse parameters for experiments 1-7.
Exp. CPC SMPS Half max. Max. Max. [No.]3/ [NO] @ [NO]→0 Aerosol Aerosol mass SOA No. nuc. T1/ nuc. T2/ [No.] T3/ [No.] T3/ #cm-3 nucleation/ time4/ diameter (time)/ Yield/ mins. mins. mins. mins. ppbV mins. (time)/ µg m−3 %
nm (mins.) (mins.)
1 108 108 183 225 580 16.2 152 387 (357) 47 (465) 1.94 2 145 149 167 228 1099 6.2 152–1695 663 (505) 182 (433) 7.47
3 400 420 543 609 406 1.4 325 155 (618) 2 (621) 0.29
4 188 193 226 256 491 1.2 157 507 (484) 36 (415) 2.29
5 50 58 94 163 407 0.4 6– 462 (513) 38 (502) 6.36
6 184 182 218 257 494 1.4 162 484 (487) 31 (358) 1.79
7 22 28 43 76 2216 0.4 6– 404 (550) 45 (487) 6.21
1Nucleation time obtained using data from CPC (particles of diameter≥3 nm) 2Nucleation time obtained using data from SMPS (particles of diameter≥15 nm) 3Data obtained from SMPS
4Defined as the time at which [NO] reaches 2 ppbV
5NO analyser off line, [NO] dropped below 2 ppbV during this time 6Low NO
xexperiment, [NO]<1 ppbV throughout experiment
Table 3.Quantity of organic precursor consumed and peak inorganic concentrations.
Exp. TMB Peak Peak [O3] Peak [O3]/ Peak [NO2] Peak [NO2]/
No. consumed/ d[TMB]/dt/ time/ ppbV time/mins. ppbV % mins. mins.
1 89.4 130 278 274.1 103 212.7
2 44.3 120 259 365.2 137 446.2
3 91.5 120 600 199.1 188 187.4
4 63.5 110 287 230.8 104 196.4
5 82.2 – 489 43.8 – –
6 62.1 110 284 226.3 110 200.9
7 92.5 – 551 58.9 – –
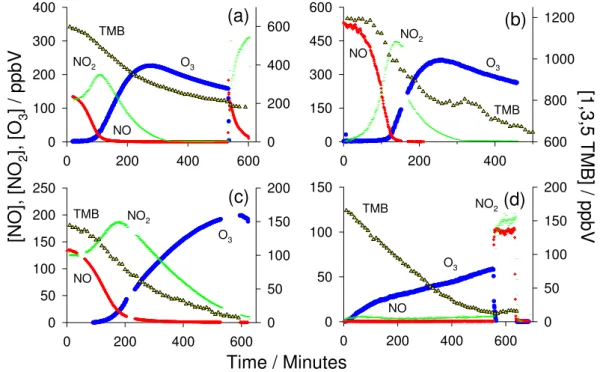
3.3 Chamber aerosol formation under high NOxconditions Figure 2a–d summarises the key aerosol phase parameters for the four variants of the TMB photooxidation study, i.e. the total aerosol number density, total aerosol volume and mean geometric particle diameter.
For experiments 1–6 no seeding was employed in the sim-ulation chamber and hence new aerosol formation occurred via homogeneous nucleation involving certain key semi-and non-volatile oxidation products of the precursor VOC (Se-infeld and Pankow, 2003; Holmes, 2007). The nucleation event observed during experiment 6 (high NOxexperiment, VOC/NOx∼2:1) is clearly evident in Fig. 2a, seen as a dra-matic increase in the total number density of particles in the chamber at ∼185 min. In this study we define nucleation to have occurred once the differential of the particle num-ber density (with respect to time) exceeds a value of one for three consecutive measurements (i.e. when the particle count tends away from the baseline). Nucleation times are given
for the CPC and the SMPS instruments in Table 1. However, as the CPC measures particles closer in size to the nucleating cluster (i.e.∼1.5 nm), it is the CPC derived nucleation times and number densities that are employed during the following analysis and discussion.
Aerosol Volume Total / μ m 3 /cm 3
0 200 400 600
Pa rt ic le Ge om etr ic M e an D iam
eter / nm
0 100 200 300 400 500 0 10 20 30 P a
rticle Number D
ensity / cm
-3 0 100 200 300 400
Time / Minutes
0 200 400
0 200 400 600 800 0 50 100 150 200 250 0 400 800 1200
0 200 400 600
0 100 200 300 400 0 10 20 30 40 50 0 400 800 1200 1600 2000
0 200 400 600 800
0 50 100 150 200 0 1 2 3 0 100 200 300
(a)
(b)
(c)
(d)
ND Vol GMD GMD ND Vol Vol Vol ND GMD GMD NDFig. 2.Temporal evolution of the aerosol number density (ND), geometric mean diameter (GMD) and volume concentration (Vol) within the chamber during(a)experiment 6 (VOC/NOx∼2:1),(b)experiment 2 (VOC/NOx∼2:1, NO only),(c)experiment 3 (VOC/NOx∼1:2) and(d)
experiment 7 (VOC/NOx∼17:1). For (a) and (d) the chamber lights were switched off for the “dark phase” at 460 and 550 min, respectively,
followed by NO injection (see text for details).
Following the analysis performed by Baltensperger and colleagues (Baltensperger et al., 2005), total SOA mass has been determined from the measured SOA volume by as-suming a density of 1.4 g cm−3. In the case of experiment 6, a maximum SOA mass of approximately 31µg m−3was reached. As no wall loss corrections have been applied to the aerosol phase data, this value constitutes a lower limit and should be treated with care. Consequently, a “relative” SOA yield (Y) was calculated according to Eq. (1) (after Odum et al., 1996):
Y= M0
1VOC×100 (1)
In the above expression M0corresponds to the peak mass of SOA produced and1VOC is the amount of the precursor VOC consumed at the peak SOA mass (both expressed in units ofµg m−3). Note, the yields presented have a level of uncertainty associated with them owing to the use of non-wall loss corrected SOA mass. Yields for the three repeat experiments with a VOC/NOxratio∼2:1 (i.e. experiments 1, 4 and 6) were 1.9, 2.3 and 1.8%, respectively.
The temporal behaviour of the measured aerosol parame-ters for experiment 2 (VOC/NOx∼2:1, NO only) was similar to those of experiments 1, 4 and 6. However, as the initial concentration of both TMB and NO was set to twice that of the other high NOx(VOC/NOx∼2:1) experiments, an ap-proximate two-fold increase in the maximum number density of particles was observed (∼1100 particles cm−3in the size range 15–690 nm). Also, particles grew to larger maximum
mean diameters (∼660 nm) and the ultimate experiment SOA yield was roughly four times greater than that of the other high NOxexperiments (1, 4 and 6), at approximately 7.5%. The findings described here for an enhanced level of starting material are consistent with those previously reported (e.g. Paulsen et al., 2005; Gross et al., 2006).
When the starting VOC/NOx ratio was reversed to∼1:2 for experiment 3, SOA formation was significantly delayed, with nucleation occurring around 215 min later than in exper-iment 6. By the conclusion of experexper-iment 3 (∼600 min) the chamber aerosol appeared to still be in a state of growth; no distinct peak in either size or mass had been reached, how-ever, the SOA number density had reached its maximum (see Fig. 2c). Consequently, a relative SOA yield can only be ap-proximated in this instance by taking the aerosol mass pro-duced at the conclusion of the experiment. Although this yield value is not necessarily fully quantitative, it serves as a guide to indicate the level of SOA formed under the con-ditions of experiment 3. With a VOC/NOxratio of∼1:2, an approximate SOA yield of 0.3% was achieved, i.e. roughly an order of magnitude lower than for the larger VOC/NOx ratios. With more than 90% of the precursor VOC consumed by termination of the experiment and with primary and sec-ondary oxidation products having reached their concentra-tion peaks, it may be assumed that further aerosol growth after this point would be minimal.
K. P. Wyche et al.: Secondary organic aerosol formation from 1,3,5-trimethylbenzene photooxidation 643 was witnessed before the nucleation event. For experiments
1, 2, 4 and 6 (VOC/NOx∼2:1) this period lasted for ap-proximately 110, 145, 190 and 185 min, respectively, and for experiment 3 (VOC/NOx∼1:2) was over twice as long at 400 min. Evidence for this incubation period has been re-ported for several other aromatic oxidation systems, includ-ing benzene, toluene,o-xylene andm-xylene in a number of different simulation chambers (Izumi et al., 1988; Johnson et al., 2004, 2005; Song et al., 2005; Ng et al., 2007).
It has been proposed that the existence and duration of the incubation period is directly related to the presence of NO in the gas phase (Johnson et al., 2004, 2005). Results obtained by Johnson et al. (2005) from a gas phase oxidation model coupled to an absorptive aerosol transfer scheme showed that the less volatile organic hydroperoxides, formed from the self-reactions of hydro and organic peroxy radical species (R3 and R4), were significant contributors to SOA mass. Consequently, new particle formation and growth would be closely linked to the ambient levels of NO, which may prefer-entially react with HO2and RO2via reactions (R1) and (R2) in the scheme below, limiting the capacity of the system to form peroxides:
NO+HO2→NO2+OH (R1)
NO+RO2→NO2+RO (R2a)
→RONO2 (R2b)
RO2+RO2→Products (R3)
RO2+HO2→ROOH+O2 (R4)
The RO2+ RO2 self-reaction (R3) will proceed via one of three different pathways, the relative importance of which depends on the structure of the reacting RO2radicals. Gener-ally, the RO2+ RO2reaction will produce either (i) an equiv-alent alkoxy radical pair (RO), (ii) a carbonyl compound and an alcohol, or (iii) an organic peroxide (ROOR). Although re-action (R3) can lead to the formation of low volatility ROOR compounds, it proceeds at a considerably slower rate than reaction (R4), hence ROOH species may be of greater im-portance in SOA formation.
Johnson et al. (2005) proposed that once in the aerosol phase, the organic peroxides are able to take part in hetero-geneous chemistry with certain aldehyde compounds to form peroxyhemiacetals. This thesis supports results from previ-ous studies of variprevi-ous workers demonstrating the importance of heterogeneous chemistry in the aerosol, and in particular acetal and hemiacetal reactions involving carbonyl oxidation products (Jang and Kamens, 2001; Jang et al., 2003).
Following the methods detailed by Ng et al. (2007), an examination of the kinetics involved in reactions (R2)–(R4) enables us to infer the influence of the NO concentration on gas phase organic hydroperoxide formation during the cur-rent experiments. Equation (2) below accounts for reactions
80 60 40 20 0 [R O2
] / p
p tV 120 100 80 60 40 20 0
[NO] / ppbV
0 51510 20 25 30 35 40 45 50 55 60 65 70 75 80 85 90 95 100 105 110 115 120 125 130 135 140 145 150 155 160 165 170 175 180 185 190 195 200 205 210 215 220 225 230 235 240 245 250 255 260 265 270 275 280 285 290 295 300 305 310 315 320 325 330 335 340 345 350 355 360 365 370 375 380 385 50 40 30 20 10 0 Φ
Nucleation Φ = 5 %
80 60 40 20 [R O2 ] / ppt V 0.60 0.55 0.50 0.45 0.40 0.35 0.30
[NO] / ppbV
10
20 30
40
50
60 708090
100 110 120
130150 140 160
170
180 190
200210 220
230 240
250260280300290320310330 270 340 350 360 370 380 390400 410 420
430450490 440480470 460
35 30 25 20 15 10 Φ
Nucleation Φ = 18 %
Φ
(a)
(b)
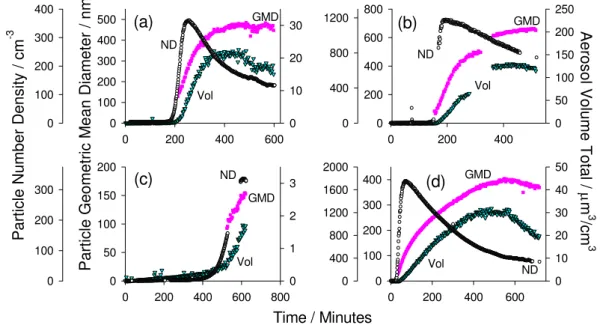
Fig. 3. Theoretical variation in partitioning of RO2 species with
evolving chamber [NO] for(a)high NOxconditions and(b)low
NOxconditions. 8gives the percentage of RO2 species forming
organic hydroperoxides (see Eq. (2) and text for further details). Graph number markers give the time after lights on.
(R2)–(R4) to determine the fraction of RO2(8) that forms hydroperoxides:
8= k4[RO2][HO]2
k4[RO2][HO2] +k3[RO2]2+k2[RO2][NO]
(2) For this simple model the overall rate constantk2has been used to account for the fate of RO2via reaction with NO by both reactions (R2a) and (R2b). Rate constantsk2,k3andk4 taken from MCMv3.1, http://mcm.leeds.ac.uk/MCM.
Figure 3a shows the variation of 8with NO concentra-tion taken from experiment 6, for a series of HO2and RO2 concentrations generated from the chamber box model em-ployed in a companion paper (Rickard et al., 2008). Fig-ure 3a clearly demonstrates that for the self-reaction route involving both hydro and organic peroxy radical species to become significant, either high radical levels are required (i.e. tens of pptV) or the concentration of NO must approach zero. For 8 (hence hydroperoxide formation) to reach as much as 5% in this model, the concentration of NO must fall to∼2 ppbV (with∼40 and 50 pptV HO2and RO2, respec-tively) and for 10%,∼1 ppbV (with ∼50 and 70 pptV HO2 and RO2, respectively). At the point of nucleation during experiment 6, Eq. (2) predicts8=5%.
150
100
50
0
Σ
(HO
2
+ RO
2
) / pptV
400 300
200 100
0
Time / Minutes
40
30
20 10
0
[O
3
] / ppbV
∑
Δ μ
Δ
μ
Δ
Fig. 4.Temporal evolution of the sum of hydro and organic peroxy radicals (i.e.P(HO2+RO2)) recorded by the PERCA during low
NOxexperiment 5 (VOC/NOxratio∼15:1).
170 min (see Table 2). Contrasting these times with those of the nucleation event in each case, we see that SOA formation occurs only as [NO] drops towards zero, adding support to the thesis that peroxide chemistry is involved in SOA forma-tion. However, during experiments 4 and 6 there is a further time delay (of∼30 and 20 min, respectively) before parti-cle formation occurs, implications of which are discussed in Sect. 3.5. The concentrations of NO at nucleation for the high NOxexperiments 1, 2, 4 and 6 were 16.2, 6.2, 1.2, and 1.4 ppbV, respectively. Particle growth during experiment 1 was slower than other repeat experiments, an observation in line with the slightly higher [NO] at the point of SOA forma-tion.
The hypothesis suggesting that the NO concentration in the chamber must reach a minimal value before nucleation can occur is supported by results obtained from varying the VOC/NOx ratio. When the VOC/NOx ratio was changed from 2:1 to 1:2 (experiment 3), a considerably longer time was required for the system chemistry to reduce the [NO] to negligible levels (see Table 2). Correspondingly, a delay was observed in the timing of the nucleation event. In addition to this, nucleation did not occur until approximately a further 75 min after [NO] had reached minimal levels.
3.4 Chamber aerosol formation and peroxy radicals under low NOxconditions
Figure 2 and Table 2 demonstrate the clear difference be-tween the nucleation times of the high and low NOx experi-ments. During the low NOxexperiments a distinctly shorter incubation period was observed before the onset of aerosol formation, i.e.∼50 and 20 min for experiments 5 and 7, re-spectively, compared to an average of∼155 min for the typ-ical high NOx experiments (see Fig. 2d). During the low NOx(constant HONO) experiments the concentration of NO up to the point of nucleation was no greater than∼1 ppbV and an additional radical source was present to supply OH and (therefore HO2) to the matrix. Consequently, it is highly
likely that radical-radical self-reaction routes (R3 and R4) dominated the fate of the RO2species from the start of the ex-periment. It should be noted that the length of the incubation period of each low NOx experiment (i.e. 5 and 7), is com-parable to the length of the time delay between NO falling to negligible concentrations and nucleation during high NOx experiments 4 and 6.
The SOA yields obtained during low NOxexperiments 5 and 7 were 6.4 and 6.2%, respectively, i.e. roughly 3.5 and 22 times larger than those achieved under high NOxconditions of VOC/NOx∼2:1 and 1:2, respectively. It should be noted that in the latter instance (experiment 3, VOC/NOx∼1:2), the experiment was conducted with the same initial TMB con-centration as the low NOx experiments, and thus it is un-likely that enhanced yields under low NOxconditions are an artefact of initial precursor concentration (Ng et al., 2007). Ng et al. (2007) saw roughly 3 and 6 fold increases in SOA yields in the toluene and m-xylene systems, respectively, when moving from high to low NOxconditions, comparable to observations made here.
As discussed earlier, recent reports attribute the production of a greater aerosol yield in low NOx systems to chamber conditions favouring formation of the low volatility perox-ides from reactions (R3) and (R4) (Stern et al., 1987; Jenkin et al., 2003; Johnson et al., 2004; Song et al., 2005; Ng et al., 2007). However as will be discussed below, the condi-tions of low NOxexperiments 5 and 7 also allowed the early production of a variety of other organic oxidation products which may have further contributed to SOA formation and facilitated enhancement of SOA yield.
Elevated NOxconcentrations, such as those employed dur-ing the high NOxexperiments of this study, lead to interfer-ence problems in the inlet chain length chemistry when mea-suring peroxy radical species using the PERCA technique (Green et al., 2006; Parker, 2007). Consequently, peroxy radical data are presented only for experiments conducted under low NOxconditions. Figure 4 displays the temporal evolution of the sum of both hydro and organic peroxy radi-cals during experiment 5, during which a rapid rise in peroxy radical concentration was observed from lights on to a con-centration plateau of∼175 pptV by∼400 min.
K. P. Wyche et al.: Secondary organic aerosol formation from 1,3,5-trimethylbenzene photooxidation 645 of plateau behaviour in radical concentration highlights the
point at which the HO2+RO2loss rate became constant. Using the partitioning theory outlined in Sect. 3.3 (Eq. (2)) along with total peroxy radical and NO measurements, it is possible to demonstrate how peroxide production may pro-ceed within the chamber under low NOx conditions. Fig-ure 3b shows the variation of8with [RO2] and [NO], using measured data and assuming the same [HO2]/[RO2] ratio as produced in the chamber box model of Rickard et al. (2008), i.e. 0.45. With the NO concentrations no greater than 1 ppbV, formation of peroxides within the chamber becomes efficient as soon as the photochemistry is initiated and peroxy radicals are formed (see Figs. 1d and 4). Under low NOxconditions Eq. (2) predicts that partitioning of RO2 to peroxides is as efficient as∼5% after only the first 10 min of experiment, a result that contrasts strongly with findings from the high NOx cases. Furthermore, Eq. (E2) predicts that partition-ing of RO2to peroxides reached roughly 18% by the time of the nucleation event of experiment 5. From the results ob-tained within this work it would appear that8at the point of nucleation exhibits positive correlation with the ultimate SOA yield achieved, i.e. both low NOxexperiments exhib-ited the largest8values as well as presenting the largest SOA yields. These experimental findings further strengthen theo-ries which propose a crucial role for organic hydroperoxides in the SOA formation process, both under chamber condi-tions and potentially under NOxlimited ambient conditions. 3.5 Effect of inorganic seed
A comparison of the two low NOx experiments (5 and 7) in Table 2 shows that particle formation occurred∼30 min earlier when SO2gas was included in the matrix. This re-sult could be due to slightly higher OH levels measured during experiment 7, but is most likely a consequence of H2SO4nucleation, which subsequently supplied a condensa-tion surface for the condensable organic oxidacondensa-tion products (Holmes, 2007). In addition to this, seeding the chamber generated a larger number of particles than in other experi-ments. The peak particle number density during experiment 7 reached roughly 2200 cm−3, compared to only 410 cm−3 during experiment 5 (in the size range 15–690 nm). Due to the larger number of particles produced, the mean geomet-ric aerosol diameter of the seeded SOA was slightly smaller than that produced by homogeneous nucleation, i.e.∼400 compared to∼460 nm.
Various chamber studies have shown that SOA yields generated from a VOC precursor can become enhanced in the presence of an acidic seed (Jang and Kamens, 2001; Czoschke et al., 2003; Jang et al., 2003; Limbeck et al., 2003; Gao et al., 2004; Surratt et al., 2007; Verheggen et al., 2007). Further inspection of Table 2 shows that despite the production of a greater number of particles, the aerosol yield obtained in the presence of H2SO4was no greater than the yield obtained during the companion low NOxhomogeneous
Σ
∑
30
20
10
0
2000 1500
1000 500
0 50 40 30 20 10 0
800 600
400 200
0 120 80 40 0
0.8 0.6 0.4 0.2 0.0
Δ[TMB] / μg m-3
Δ
MSOA
/
μ
g m
-3 [N
O] / ppb
V
[N
O] / p
pbV
Δ
(a)
(b)
Fig. 5. SOA time-dependent growth curves for (a) experiment 6 (high NOx experiment, VOC/NOx∼2:1) and(b) experiment 7
(low NOxexperiment, VOC/NOx∼17:1). 1[TMB]=reacted mass
of TMB following initiation of the oxidation chemistry .
nucleation experiment. However, the SO2concentration em-ployed during experiment 7 was somewhat low (0.4 ppbV compared to>100 ppbV used by other workers, e.g. Edney et al., 2005; Kleindienst et al., 2006; Metzger et al., 2008b); hence it is possible that the resultant [H2SO4] (i.e. a limit of 1.5µg m−3assuming full conversion of SO
2to SO24−) was too low to facilitate the acid seed effect. Therefore, with this in mind and with a lack of repeat seed experiments, the result of “no yield enhancement” for TMB-SOA in the presence of H2SO4is not conclusive, but is in line with findings pre-sented by Ng et al. for two other aromatic systems: toluene andm-xylene (Ng et al., 2007). A more exhaustive study in-vestigating the effect of acid seeding on TMB-SOA has been produced recently by Metzger et al. (2008b).
3.6 Time-dependent SOA growth curves
shorter incubation period than those of the high NOx sys-tems. As an example, Fig. 5b displays the growth curve for experiment 7.
As noted in Sects. 3.3 and 3.4 a time delay was observed between [NO]→ 0 and the nucleation event in high NOx experiments 4 and 6, which was comparable in duration to the incubation period clearly evident in the growth curves of the low NOx experiments (e.g. Fig. 5b). As shown above, the formation of hydroperoxides in the low NOxsystem is likely to be extremely efficient even very early into the ex-periment. Consequently, if organic hydroperoxides are piv-otal in TMB-SOA formation, the incubation period observed under low NOxconditions (and the further time delay under high NOxconditions) could be indicative of the time required for their gas phase concentrations to build to sufficient levels such that their saturation vapour pressure relative to the par-ticle phase is exceeded. It is also possible that the presence of a time delay in certain high NOxexperiments and the in-cubation zone in the absence of NOxare a consequence of the SOA forming species consisting of later stage oxidation products which form further down the oxidation chain, i.e. from further reaction of primary products (including certain peroxides, see discussion in Sect. 3.9). Growth curves dis-playing similar behaviour to those derived from the current study were presented by Song et al. (2005) for them-xylene system.
3.7 The gas phase organic compounds
3.7.1 The 1,3,5-trimethylbenzene atmospheric oxidation mechanism
Before reporting the observations derived from the CIR-TOF-MS measurements, we first outline the likely atmo-spheric oxidation processes of TMB that might lead to SOA formation. Atmospheric oxidation of TMB occurs primar-ily by reaction with the OH radical, and may essentially be separated into two distinct pathways. One pathway is reac-tion via OH addireac-tion to the aromatic ring, which may ulti-mately lead to ring cleavage (pathwayPi), while the other involves hydrogen abstraction from a methyl group (path-wayPii). In general, the more substituted the aromatic ring, the more important the ring fragmentation route (Johnson et al., 2005; Bloss et al., 2005b). A simplified mechanism for the photochemical degradation of TMB, highlighting the most important atmospheric oxidation routes, is displayed in Fig. 6. This scheme has been constructed through an amal-gamation of previous descriptions of the benzene and toluene oxidation systems (Yu et al., 1997; Atkinson, 2000; Bohn, 2001; Calvert et al., 2002; Johnson et al., 2004, 2005), the MCMv3.1 TMB subset (extracted from the MCM website (http://mcm.leeds.ac.uk/MCM), Bloss et al., 2005a, 2005b) and measurements made by CIR-TOF-MS during this study:
(Pi) OH Addition to the aromatic ring. The principal atmospheric oxidation route for TMB involves the addi-tion of OH to the aromatic ring (branching ratio of 0.97 in the MCMv3.1), initially forming an OH-aromatic adduct (a trimethyl hydroxycyclohexadienyl radical; compound B in Fig. 6). In the presence of atmospheric levels of O2 this radical is in equilibrium with its equivalent OH-aromatic-O2adduct (a trimethyl hydroxycyclohexadienyl peroxy rad-ical) (C). The OH-aromatic-O2adduct (C) can either subse-quently decompose to yield HO2and the ring retaining prod-uct 2,4,6-trimethylphenol (D), or most likely will undergo internal rearrangement to generate an O2-bridged trimethyl peroxide bicyclic radical (E) (branching ratio of 0.96 in MCMv3.1). The O2-bridged trimethyl peroxide bicyclic rad-ical (E) can subsequently degrade through various stages of isomerisation, decomposition and scission to form the epoxy-oxy species (H) (path fraction of 0.15 in MCMv3.1). The epoxy-oxy compound can decompose to give a variety of lower molar mass oxygenates (e.g. compounds I and J). However, in the atmosphere the bicyclic peroxide radical (E) will most likely undergo reaction with O2to form the peroxy radical equivalent (K) (path fraction of 0.85 in MCMv3.1). The yields of initial products formed after addition of OH to the aromatic ring of TMB in MCMv3.1 are 0.79, 0.14, and 0.04 for the trimethyl peroxide bicyclic peroxy radical (K), the epoxy-oxy species (H) and 2,4,6-trimethylphenol (D), respectively. Depending on the amount of NOxpresent, the peroxide bicyclic peroxy radical (K) will degrade via a number of intermediary steps to produce a range of O2 -bridged oxygenated and nitrated compounds (compounds L– P). Some of the larger oxygenated and nitrated ring-retaining products, including the multi-functional O2-bridged species shown in Fig. 6, are likely to be sufficiently non-volatile to partition into the organic aerosol phase (Johnson et al., 2004, 2005). Once inside the particle phase, these types of multi-functional compounds can take part in certain association re-actions (Johnson et al., 2005).
Further oxidation and ring opening processes (mainly through the oxy radical (N)) will yield an array of lower molecular mass carbonyl (including methyl glyoxal), un-saturatedγ-dicarbonyl, acid and furanone species, some of which are shown in Fig. 6 (e.g. compounds Q–S). These low molecular mass ring fragmentation products have a tendency to be multi-functional and can be unsaturated, and therefore are generally more reactive than the parent TMB and can be oxidised further through reactions with OH and O3and NO3. A selection of likely, further reaction products are shown in Fig. 6. Some of these products, e.g. 3-methyl maleic anhy-dride (citraconic anhyanhy-dride) (AB) and 3,5-dimethyl-5(2H)-2-furanone (S), can be highly polar and less volatile, and hence may be able to transfer into the organic aerosol phase (Klein-dienst et al., 1999; Johnson et al., 2005).
(Pii) Hydrogen abstraction from a pendant methyl group.
K. P. Wyche et al.: Secondary organic aerosol formation from 1,3,5-trimethylbenzene photooxidation 647
100 80 60 40 20 0
300 200
100 0
100 80 60 40 20 0
300 200
100 0
250 200 150 100 50 0
300 200
100 0
120
80
40
0
300 200
100 0
6
4
2
0
240 200 160 120
6
4
2
0
240 200 160 120
10 8 6 4 2 0
240 200 160 120
12 8 4 0
240 200 160 120
Sign
al /
ncps
m/z
(a)
(c)
(b)
(d)
Fig. 7. Comparison of CIR-MS mass spectra recorded 400 min after lights on for(a)experiment 6 (VOC/NOx∼2:1),(b) experiment 2
(VOC/NOx∼2:1, NO only),(c)experiment 3 (VOC/NOx∼1:2) and(d)experiment 7 (low NOx, VOC/NOx∼17:1). Each mass spectrum
corresponds to data accumulation over a ten-minute period.
the atmosphere, and represents the major ring retaining path-way (other than the formation of 2,4,6-trimethyl phenol as described above). Eventually, following hydrogen abstrac-tion, reaction with O2, and subsequent radical reactions (e.g. with NO, RO2, and HO2), 3,5 dimethyl benzaldehyde (W) is formed with a yield of∼0.03 according to MCMv3.1 (Bloss et al., 2005b).
3.7.2 Measurement of the gas phase organic compounds Figure 7a–d displays the CIR-TOF-MS mass spectra recorded after 400 min of irradiation during experiments 6, 3, 2 and 7, with VOC/NOx ratios of around 2:1, 1:2, 2:1 (NO only) and 17:1, respectively. All of the CIR-TOF-MS data presented within this work have been normalised to 106 primary reagent ion counts (i.e. the sum of the H3O+ and H3O+.(H2O) signals) and have been background sub-tracted. Consequently, all signals stated here are quoted in units of normalised counts per second i.e. ncps (de Gouw et al., 2003). In order to show the relative contributions of the various peaks to the total mass spectra, for Fig. 10a–d the
m/z121 peaks (i.e. 1,3,5-TMB) have each been assigned a nominal value of 100% and all other peaks have been scaled accordingly.
During a typical high NOxchamber experiment (and de-pending on the drift cell conditions employed) around 60 peaks were recorded in the mass spectra betweenm/z0 and 300, with around thirty peaks possessing a mass greater than that of the precursor VOC (m/z 121). In contrast, roughly fifty significant features were recorded during the low NOxexperiments, with around twenty of those possess-ing a mass greater than that of the precursor. It should be
noted, however, that this difference could be attributed to the use of a lower precursor concentration during the low NOx studies where detection limits of the instrument become an issue (see Wyche et al., 2007 for further information regard-ing detection limits). The number of spectral features quoted here includes features present due to fragment ions as well as parent ions, and hence the number of peaks recorded does not necessarily represent the total diversity of organic species in the chamber. For brief periods during certain experiments, the electric field applied across the collision cell in the CIR-TOF-MS drift tube was increased to produce more energetic collisions, and thus to identify and help exclude any possible molecular ion water cluster products (i.e. MH+.(H2O)n).
The major spectral features common to all experiments are listed in Table 4 along with, where possible, a tenta-tive compound assignment. Table 4 also gives a chamber “appearance time” for each compound, defined as the time at which the signal for a given spectral feature exceeds the mean background signal plus three times its standard devi-ation. All compound assignments have been made using a combination of information, namely TOF-MS accurate mass measurements, appearance time, subsequent temporal pro-file, and data available from the MCMv3.1 box model simu-lations (see Rickard et al., 2008).
3.7.3 Behaviour of the gas phase organics under high NOx conditions
K. P. Wyche et al.: Secondary organic aerosol formation from 1,3,5-trimethylbenzene photooxidation 649
Table 4. Most major VOC contributors to the gas phase as measured by CIR-TOF-MS. Measuredm/z, actual “unprotonated” compound mass, approximate peak signal intensity, appearance time and tentative assignments are included. MCM species names are included and can be used for navigation around the MCMv3.1 TMB degradation scheme via the MCM website (http://mcm.leeds.ac.uk/MCM).
Mass Peak Tentative Assignment Appearance Time / minutes Measured Signal/ Name (MCM designation)/ Experiment
m/z ncps (Fig. 6 identifier)
(Actual/ Da) 1 2 3 4 5 6 7
232.20 200 1,3,5-trimethyl-4-nitrooxy- 120 90 n/m 51 36 51 3 (231.20)
6,7-dioxa-bicyclo[3.2.1]oct-2-en-8-ol (TM135BPNO3)/(L)
214.15 200 TM135BPNO3 Fragment: 96 100 87 81 33 12 3 (214.20) MH+[– H2O]
185.20 300 8-hydroxy-1,3,5-trimethyl- 105 130 288∗ 108 24 60 15 (184.19)
6,7-dioxa-bicyclo[3.2.1]oct-3-en-2-one (TM135OBPOH)/(P)
2-methyl-3-(1-methyl-3-oxo- but-1-enyl)-oxirane-2-carboxylic acid (TM135MUO2H)
169.22 70 1,3,5-trimethyl-6,7-dioxa- 36 93 n/m 69 36 42 3 (169.20)
bicyclo[3.2.1]oct-3-ene-2,8-diol (TM135BP2OH)/(O) Fragment: MH+[−H2O] (168.19)
2-methyl-3-(1-methyl-3-oxo- but-1-enyl)-oxirane-2-carbaldehyde (TM135OXMUC)
167.18 120 3,5-dimethyl- 147 177 n/m 81 114 63 n/m (166.17) benzenecarboperoxoic acid
(TMBCO3H)
157.20 150 5-hydroxy-4-methyl-hept-3- 150 126 240 99 102 66 24 (156.18) ene-2,6-dione
(C7M2CO5OH)
155.18 120 4-methyl-hept-4-ene-2,3,6- 453∗ 171 n/m 111 183 129 30∗ (154.16) trione (C7M3CO)
153.22 100 (3,5-dimethyl-phenyl)- 72 120 n/m 102 120 120 120∗ (152.19) methyl-hydroperoxide
(TMBOOH)
151.17 160 3,5-dimethylbenzoic acid 105 84 465∗ 72 135 60 39∗
Table 4.Continued.
Mass Peak Tentative Assignment Appearance Time / minutes Measured Signal/ Name (MCM designation)/ Experiment
m/z ncps (Fig. 6 identifier)
(Actual/ Da) 1 2 3 4 5 6 7
145.17 50 2-methyl-4-oxo-pent-2- 309 180∗ n/m 141 81 249∗ n/m (144.13) eneperoxoic acid
(C5CODBCO3H)
2-hydroxy-2-methyl-3,4-dioxo-pentanal (C6CO3MOH) 2-oxo-propionic acid 1-methyl-2-oxo-ethyl ester
(C23O3MCHO)
143.19 120 Unidentified 366∗ ∗ 406∗ 129 78 75 30∗ 141.18 140 Unidentified 126 111 ∗∗ 132 138 75 60 139.18 400 3,5-dimethyl-phenyl- 309∗ 78 ∗∗ 51 3 66 3 (138.16) hydroperoxide (DMPHOOH)
137.19 220 2,4,6-trimethyl phenol 81 75 96 54 ∗∗ 15 15 (136.19) (TM135BZOL)/(D)
(3,5-dimethyl-phenyl)-methanol (TMBOH) (136.15) m-xyloquinone
136.09 400 Unidentified organic nitrate 114 132 141 87 45 96 n/m
135.18 1000 3,5-dimethyl benzaldehyde 63 78 93 57 30 39 18 (134.18) (TMBCHO)/(W)
(134.09) 2-hydroxy-2-methyl-3-oxo-propaneperoxoic acid
(CHOMOHCO3H) (134.09)
2-hydroxy-3-oxo-butaneperoxoic acid (CO2H3CO3H) (134.09) malic acid
129.17 500 2-methyl-4-oxo-pent-2-enoic 84 93 168 66 3 72 33 (128.13) acid (C5CODBCO2H)
3-acetyl-2-methyl-oxirane-2-carbaldehyde (EPXMALKT)
K. P. Wyche et al.: Secondary organic aerosol formation from 1,3,5-trimethylbenzene photooxidation 651
Table 4.Continued.
Mass Peak Tentative Assignment Appearance Time / minutes Measured Signal/ Name (MCM designation)/ Experiment
m/z ncps (Fig. 6 identifier)
(Actual/ Da) 1 2 3 4 5 6 7
125.15 1200 Bicyclic Fragment: 99 102 69 45 3 33 3 (125.10) [C6H5O3]H+
123.17 400 Unidentified ∗∗ ∗∗ 183∗ ∗∗ ∗∗ ∗∗ ∗∗ 119.18 200 2-hydroperoxy-2-methyl- 90 75 ∗∗ 123 33 69 3∗ (118.09) malonaldehyde
(C3MDIALOOH) Succinic acid
117.14 140 3-hydroxy-pentane-2,4-dione 174 129 183 84 42 81 12 (116.12) (C5CO243OH)
115.13 250 pentane-2,3,4-trione 153 108 183 111 18 3 33∗ (114.10) (C5CO234)
113.13 7400 methyl maleic anhydride 15 15 33 15 9 3 6 (112.08) (MMALANHY)/(AF)
(112.13) 2-methyl-4-oxo-2-pentenal (C5MDICARB)/(R) (112.13)
3,5-dimethyl-3(2H)-2-furanone/(AF) (112.13)
3,5-dimethyl-5(2H)-2-furanone (MXFUONE)/(S)
111.12 6000 3 methyl-5-methylidene-5- 72 60 105 66 15 21 39 (110.04) (2H) furanone
109.15 400 TM135BPNO3 Fragment: 84 75 51 60 3 54 3 (109.10) MH+[−NO3.3(CH3)O]
103.11 150 2-hydroxy-2-methyl- 150 126 ∗∗ 126 93 12 27 (102.09) malonaldehyde
(C3MDIALOH)
101.13 400 2,3-dioxobutanal 126 90 129 84 60 12 15 (100.07)
99.12 160 Unidentified 183 171 n/m 177∗ 366 99 30∗ 97.13 1000 Unidentified 72 78 102 81 51 9 33 87.10 1200 Related to Bicyclic Signals 117 75 123 90 42 12 24 85.11 500 m/z113 Fragment: 84 63 81 51 63 33 27 (85.13) MH+[-CO]
Table 4.Continued.
Mass Peak Tentative Assignment Appearance Time / minutes Measured Signal/ Name (MCM designation)/ Experiment
m/z ncps (Fig. 6 identifier)
(Actual/ Da) 1 2 3 4 5 6 7
77.07 1400 hydroxy acetic acid 99 135 168 90 36 63 15 (76.05)
75.09 400 hydroxyacetone 141 66 147 105 72 66 3 (74.08)
(74.04) oxo-acetic acid (HCOCO2H)
73.07 1600 methyl glyoxal (MGLYOX)/(Q) 36 30 39 15 9 36 15 (72.06)
61.07 6000 acetic acid (CH3CO2H)/(X) 36 72 60 90 12 18 3 (60.05)
(60.50) glycoaldehyde (88.06) pyruvic acid fragment (90.08) lactic acid fragment
59.08 1200 acetone n/m n/m 174 51 72∗ 207 27
(58.08)
57.10 1000 carbonyl/hydrocarbon 225 141 n/m 147 114 183 51 (57.07/ Fragment: [C3H5O+]/[C4H+9]
57.11)
47.01 600 formic acid/(Y) 198 105 69 72 72 252 ∗∗ (46.03)
46.01 (46.01) 5000 PAN Fragment/organic nitrate: [NO+2] 102 105 105 72 93 72 51 45.06 3500 methyl glyoxal Fragment 63 42 93 48 99 45 12
(44.05) acetaldehyde
(CH3OOH)/(AE)
43.04 5000 carbonyl/hydrocarbon 63 18 69 57 3 3 0 (43.04/ Fragment: [C2H3O+]/[C3H+7]
43.09)
33.05 5000 methanol (CH3OH)/(AA) 105 141 399∗ 106 132 153 90 (32.04)
31.03 1000 formaldehyde (HCHO)/(AC) 264 159 345∗ 132∗ 243∗ 249 27 (30.03)
n/m = Compound not measured during specific experiment
∗= Weak signal, high potential for error in appearance time
K. P. Wyche et al.: Secondary organic aerosol formation from 1,3,5-trimethylbenzene photooxidation 653
Signal / ncps
m/z
50 100 150 200 250
100 200 300 400 500
0 500 1000 1500 2000
Signal / ncps
50 100 150 200 250
T
ime /
Minute
s
100 200 300 400 500
0 1000 2000 3000 4000 5000 6000 7000 8000
(a) (b)
Fig. 8. (a)Evolution of the gas phase organic species during experiment 6 (VOC/NOx∼2:1). (b)Signal intensity (z-axis) scaled to 2000
ncps to reveal lower concentration features.
including many high mass oxidation products. The high NOx photooxidation system of TMB is also characterised by a peak in concentration of the heavier species around the mid-point of the experiment (∼200–300 min). The lower molecu-lar mass features demonstrate a continual rise in intensity up to the end of the experiment.
Looking more closely at the features recorded by CIR-TOF-MS (Table 4), it is possible to follow the system evo-lution as outlined in Fig. 6. Two of the earliest com-pounds to appear in the oxidation chain are the ring-retaining compounds, 2,4,6-trimethylphenol (D) and 3,5-dimethylbenzaldehyde (W). Both 2,4,6-trimethylphenol and 3,5-dimethylbenzaldehyde were measured in the cham-ber as protonated parent ions (i.e. m/z 137 and 135, re-spectively); their temporal profiles as measured under the high NOx conditions of experiment 6, are shown in Fig. 9. During experiment 6, 2,4,6-trimethylphenol and 3,5-dimethylbenzaldehyde were measured to reach peak concen-trations of approximately 2.5 and 7 ppbV, respectively.
As described in Sect. 3.7.1, the majority of mass transit in the TMB oxidation system occurs via addition of OH to the aromatic ring followed by production of the trimethyl per-oxide bicyclic radical (E) and its peroxy radical counterpart (K). The various subsequent pathways shown in Fig. 6 can lead to an array of O2-bridged aromatic compounds (L–P). We report here the first firm evidence for the existence of these O2-bridged species along with documentation of their real-time evolution, as measured by the CIR-TOF-MS. As
8
6
4
2
0
3,
5-d
im
e
th
y
lbe
nz
al
de
hy
de
/
p
p
b
V
600 500 400 300 200 100 0
Time / Minutes
3
2
1
0
2,4,6-trime
th
y
lph
e
n
o
l /
pp
bV
T.M.P.
D.M.B.
Fig. 9. Temporal evolution of 2,4,6-trimethylphenol and 3,5-dimethylbenzaldehyde during high NOxexperiment 6. The black
vertical line indicates the start of the “dark phase” and the grey ver-tical line indicates the NO injection time.
600 500 400 300 200 100 0 600 400 200 0 250 200 150 100 50 0 160 120 80 40 0
Time / Minutes
S ignal / ncps (1) (2) (3) S ignal / ncps 120 100 80 60 40 20 0 600 500 400 300 200 100 0
Time / Minutes
C oncen tr at io n / ppbV (4) (5) (6) 600 500 400 300 200 100 0
Time / Minutes
300 200 100 0 8 6 4 2 0 40 30 20 10 0 C oncen trat io n / ppbV C oncent ra ti on / ppbV (7) (8) (9) 120 100 80 60 40 20 0 Co nce n tr at io n / ppb V 600 500 400 300 200 100 0
Time / Minutes
(10) (11) (12) (a) (c) (b) (d)
Fig. 10. Temporal evolution of a selection of important VOCs measured during the photooxidation of 1,3,5-TMB in experiment 6 (VOC/NOx∼2:1). (a)(1) O2-bridged nitrate, (2) O2-bridged ketone (on right axis), (3) O2-bridged diol fragment,(b) (4) methyl
gly-oxal, (5)m/z113- isobaric ring opening products, citraconic anhydride, 3,5-dimethyl-3(2H)-2-furanone, 3,5-dimethyl-5(2H)-2-furanone and 2-methyl-4-oxo-2-pentenal, (6) 3 methyl-5-methylidene-5-(2H)-furanone,(c)(7)m/z43 (carbonyl marker), (8) 2-methyl-4-oxo-pent-2-enoic acid and 3-acetyl-2-methyl-oxirane-2-carbaldehyde, (9) hydroxyl acetone and(d)(10) acetic acid, (11) formic acid, (12) hydroxy acetic acid. Chamber lights were switched off for the “dark phase” at 460 min followed by NO injection (see text for details).
The measured concentration time profiles of the O2 -bridged bicyclic compounds are shown in Fig. 10a. Due to relatively high levels of NO early in the experiment, the O2 -bridged nitrate (L) was the first of the triumvirate to appear in the chamber, at∼10–50 min during experiment 6. The O2-bridged nitrate is formed in relatively high yield when compared to the other aromatic systems (Bloss et al., 2005b). As the chamber matrix evolved and levels of HO2and RO2 began to increase, the O2-bridged diol and ketone (and pre-sumably the peroxide (M): see Rickard et al., 2009) were produced, appearing roughly together at∼40–60 min.
The primary bicyclic nitrate remained in a state of produc-tion whilst NO was present in the chamber, up to a peak near 250 min, followed by decay as its rate of loss via oxidation (and/or loss to the aerosol, see Sect. 6.4.1) overtook its rate of production as the precursor TMB was consumed and as chamber [NOx] fell towards zero. The O2-bridged diol and ketone followed a similar profile to the nitrate early in the experiment but continued on a steady rise as HO2and RO2 became more prevalent within the chamber.
According to the mechanism outlined in Fig. 6, the O2 -bridged ketone (P) and alkoxy radical (N) act as conduits for further mass transit through the oxidation system. Both compounds are liable to undergo ring cleavage to yield an array of lower molecular mass oxygenated and nitrated com-pounds, the first and most abundant of which are methyl gly-oxal (Q) and 3,5-dimethyl-5(2H)-2-furanone (S), measured as protonated parent ions at m/z 73 and 113, respectively.
A variety of oxygenated species, all of nominal mass 112, appear in the TMB oxidation chain and were measured col-lectively atm/z113 (i.e. protonated) by CIR-TOF-MS. Along with 3,5-dimethyl-5(2H)-2-furanone, laboratory studies have identified these to be the furanones, 3,5-dimethyl-3(2H)-2-furanone (AF) and 3-methyl-furan-2,5-dione (methyl maleic anhydride) (AC), and the δ-dicarbonyl 2-methyl-4-oxo-2-pentenal (R) (Smith et al., 1999). Also observed here in the chamber matrix was a fourth furanone, 3-methy-5-methylidene-5(2H)-2-furanone, measured at m/z 111 (AE) (Smith et al., 1999).
Both methyl glyoxal and the m/z 113 compounds were amongst the first oxidation products to appear in the chamber (after∼3-30 min), being formed via a series of highly reac-tive radical intermediates during the early, NOxdominated stages of the high NOxexperiment. As shown in Fig. 10b, the concentrations of methyl glyoxal, 3-methy-5-methylidene-5(2H)-2-furanone and them/z113 species increased rapidly to peaks of∼110, 30 and 65 ppbV, at roughly 320, 450 and 170 min, respectively. Eventually the chemistry generating these oxidation products reached steady state, as indicated by the observed concentration plateaus.


![Fig. 3. Theoretical variation in partitioning of RO 2 species with evolving chamber [NO] for (a) high NO x conditions and (b) low NO x conditions](https://thumb-eu.123doks.com/thumbv2/123dok_br/18378257.356101/9.892.462.818.90.453/theoretical-variation-partitioning-species-evolving-chamber-conditions-conditions.webp)