ISSN 0100-879X
BIOMEDICAL SCIENCES
AND
CLINICAL INVESTIGATION
www.bjournal.com.br
www.bjournal.com.br
Volume 45 (6) 473-564 June 2012
Braz J Med Biol Res, May 2012, Volume 45(6) 537-545
doi:
10.1590/S0100-879X2012007500051
Three-dimensional kinematic analysis of upper and lower limb
motion during gait of post-stroke patients
A.A. Carmo, A.F.R. Kleiner, P.H. Lobo da Costa and R.M.L. Barros
Institutional Sponsors
The Brazilian Journal of Medical and Biological Research is partially financed by
Faculdade de Medicina de Ribeirão Preto Campus
Ribeirão Preto
Explore High - Performance MS Orbitrap Technology In Proteomics & Metabolomics
Three-dimensional kinematic analysis of
upper and lower limb motion during
gait of post-stroke patients
A.A. Carmo
1, A.F.R. Kleiner
1, P.H. Lobo da Costa
2and R.M.L. Barros
11Laboratório de Instrumentação para Biomecânica, Faculdade de Educação Física,
Universidade Estadual de Campinas, Campinas, SP, Brasil
2Núcleo Multidisciplinar de Análise do Movimento,
Universidade Federal de São Carlos, São Carlos, SP, Brasil
Abstract
The aim of this study was to analyze the alterations of arm and leg movements of patients during stroke gait. Joint angles of upper and lower limbs and spatiotemporal variables were evaluated in two groups: hemiparetic group (HG, 14 hemiparetic men, 53 ± 10 years) and control group (CG, 7 able-bodied men, 50 ± 4 years). The statistical analysis was based on the following
comparisons (P ≤ 0.05): 1) right versus left sides of CG; 2) affected (AF) versus unaffected (UF) sides of HG; 3)CG versus both the affected and unaffected sides of HG, and 4) an intracycle comparison of the kinematic continuous angular variables between HG and CG. This study showed that the affected upper limb motion in stroke gait was characterized by a decreased range of motion of the glenohumeral (HG: 6.3 ± 4.5, CG: 20.1 ± 8.2) and elbow joints (AF: 8.4 ± 4.4, UF: 15.6 ± 7.6) on the sagittal
plane and elbow joint flexion throughout the cycle (AF: 68.2 ± 0.4, CG: 46.8 ± 2.7). The glenohumeral joint presented a higher abduction angle (AF: 14.2 ± 1.6, CG: 11.5 ± 4.0) and a lower external rotation throughout the cycle (AF: 4.6 ± 1.2, CG: 22.0 ±
3.0). The lower limbs showed typical alterations of the stroke gait patterns. Thus, the changes in upper and lower limb motion
of stroke gait were identified. The description of upper limb motion in stroke gait is new and complements gait analysis.
Key words: Upper limbs; Stroke; Human gait analysis
Introduction
Correspondence: A.A. Carmo, Av. Érico Veríssimo, 701, Caixa Postal 6134, 13083-851 Campinas, SP, Brasil. Fax: +55-19-3521-6626. E-mail: [email protected]
Received September 18, 2011. Accepted March 23, 2012. Available online April 5, 2012. Published June 4, 2012. The basis of gait analysis in stroke patients was
es-tablished by pioneering research (1-3). In these and other studies, kinematic, electromyographic and dynamometric analyses were performed to characterize alterations in lower limb and pelvis movements by comparisons between this pathologic group and able-bodied subjects. These studies showed that the stroke group presented reduced gait speed, decreased leg joint power, increased double support time, and reduced support phase time for the affected lower limb. Furthermore, three common changes were identified: excessive plantar flexion, knee hyperextension and hip cir-cumduction. According to the authors of one study (2), these changes may or may not be associated with one another, depending on the subject’s motor impairment level.
If the human body is considered to be a biomechanical, articulated system, the movement of any segment can af-fect the entire gait. Accordingly, some recent gait studies
have analyzed the movements, patterns and functions of the upper extremity segments in normal gait. Frigo et al. (4) described and analyzed the upper limb and trunk move-ments in normal gait. Their results showed that the angles of all the segmental movements analyzed were smaller than 5 degrees during gait, except the angle of shoulder rotation and the angle between the shoulders and pelvis. Some stud-ies have shown that upper limb movements help to maintain balance (5) and the center of mass movement control (6) in normal gait. Trunk and head movements help maintain body stability (7,8). Moreover, electromyographic analyses have shown rhythmic neural connections that control arm and leg movements during the gait cycle (7).
538 A.A. Carmo et al.
stroke patients and 10 healthy subjects who were asked to walk on a treadmill under three different conditions: 1) swinging their arms naturally, 2) holding onto handles that were fixed in place, and 3) holding handles that could slide along horizontal handrails. Their findings revealed that lower limb muscle activation was different with and without arm support, suggesting that the device used in the cited study may be useful in gait rehabilitation (9). Furthermore, in high-functioning stroke subjects, the ability to coordinate arm and leg movements during gait was not affected by their pathology (10).
Hirsch et al. (11) evaluated the association between changes in lower limb range of motion (sagittal plane ankle and knee range of motion) throughout the gait cycle and botulinum toxin (BTX) injection into the upper limb in adult hemiparetic patients. A three-dimensional (3-D) gait analysis was performed before and after treatment with BTX. The results showed that BTX injection into the upper extremity was associated with a decrease in hemiparetic leg stride time and a higher range of motion in the ankle and knee joints. Bakheit and Sawyer (12) investigated whether the treatment of localized muscle spasticity with BTX type A would abolish spasticity in the affected upper limb and improve balance and mobility during hemiplegic gait. An observational gait analysis and other subjective assessment scales were ap-plied before and after treatment. There was a significant reduction in the associated reactions after treatment, but this did not seem to improve the patients’ balance or mobility, as assessed by the clinicians. However, 7 of the 8 patients reported improvement in their walking.
Although these findings have shown that upper limb movements affect and are affected by other segments’ movements, the kinematics of upper limb movements in human stroke gait has not been widely described or ana-lyzed. This could be due to the idea that the alterations of upper limb movements are obvious, and an observational gait analysis alone should be adequate to determine them. However, the gait is a complex sequence of movements involving dynamic coordination between the segments (10,13), and only a quantitative movement analysis is able to identify the alterations in the gait. Thus, a detailed description and quantification of upper limb movement during stroke gait is necessary. Furthermore, the analysis of upper limb movements simultaneously with the traditional gait analysis protocol, which includes the lower limbs and pelvis, has not been explored and might provide complementary informa-tion for the diagnosis of gait pattern alterainforma-tions.
The aim of this study was to analyze the kinematics of arm and leg movements during stroke gait. We hypothesized that identification and measurements of the changes in upper limb movements during stroke gait is important to improve the understanding of biomechanical alterations of the gait pattern, especially because movement analysis provides information that is not available from the static and qualitative methods widely used in the gait analysis field.
Material and Methods
Gait analysis requires and depends on representation and orientation models of the body segments in space. The most commonly used biomechanical models, proposed by Kadaba et al. (14), were restricted to the lower limbs and pelvis. It was not until 2005 that the International Society of Biomechanics (ISB) proposed the recommendations for the upper limb orientation (15) that was used in the present study.
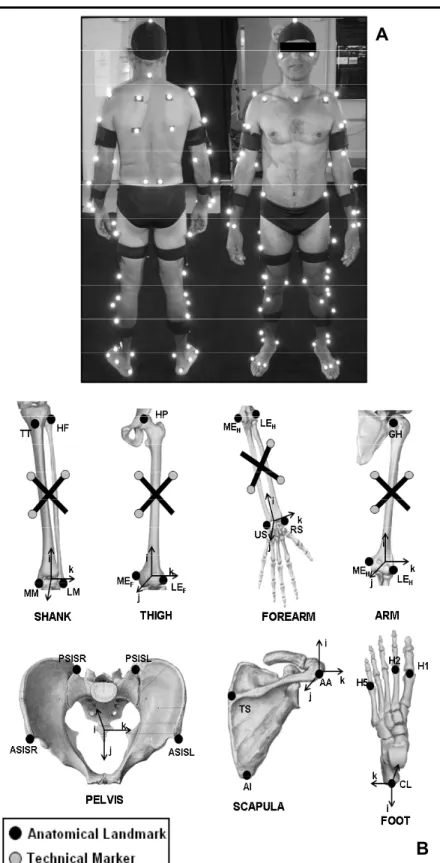
The protocol for body segment positioning and orienta-tion considers the human body as a system with 13 ball-and-socket joints with 3 degrees of freedom in each joint (16). The modeled segments were the pelvis, scapulas, arms, forearms, thighs, shanks, and feet. For orientation purposes, surface markers and technical markers were fixed on the subject’s skin. In a static trial, the subjects used both sets of markers. During the dynamic trial, only the technical marker set remained, which reduced the number of markers during the execution of movements and facilitated the identification of markers of the kinematic analysis system. The markers were positioned as shown in Figure 1. The hip and the glenohumeral joint centers were calculated according to Bell et al. (17) and Meskers et al. (18), respectively. The ankle, knee, elbow, and wrist joint centers were calculated as the midpoint between the lateral and medial markers in the static trial.
The present study was approved by the Ethics Research Committee of the University of Campinas (UNICAMP; proto-col No. 789/2007) and the volunteers gave written informed consent to participate. A total of 21 subjects were analyzed in this study. The hemiparetic group (HG) consisted of 14 individuals affected by stroke, 7 subjects with right side hemiparesis, and 7 subjects with left side hemiparesis. Inclusion criteria for this group were: male subjects, af-fected by only one stroke (ischemic or hemorrhagic), aged between 40 and 60 years, with a minimum post-injury time of 3 years and without the need for any assistive devices during data collection. The average characteristics of HG subjects were: age = 53.0 ± 10.3 years; body mass = 74.9 ± 13.7 kg; height = 1.68 ± 0.06 m.
The control group (CG) consisted of 7 healthy adult males with ages similar to those of HG subjects (range: 40 to 60 years). The average characteristics of CG subjects were: age = 49.8 ± 4.0 years; body mass = 82.4 ± 11.7 kg; height = 1.69 ± 0.05 m.
A
B
Figure 1. Segment anatomical coordinate
sys-tem included in the model. A, Static trial marker positioning. B, Anatomical landmarks and tech-nical markers. The anatomical landmarks are
represented by AA = acromial angle; AI = infe
-rior angle of the scapula; CL = calcaneus; GH = glenohumeral joint center; HP = hip joint cen
-ter; ASISR and ASISL = right and left anterior superior iliac spine; PSISR and PSISL = right and left posterior superior iliac spine; MEF and
LEF = medial and lateral femoral epicondyle;
MEH and LEH = medial and lateral humeral epicondyle; H1, H2, H5 = first, second, and fifth metatarsal head; HF = head of fibula; MM and LM = medial and lateral tibial malleolus; RS and US = radius and ulna styloid process; TS = trigonum spinae of the scapula; TT = tibial tuberosity. The axes of the coordinate systems
540 A.A. Carmo et al.
hypertonia of both the upper and lower limbs. Moreover, the subjects were asked about handedness and all stated that they were right-handed.
Data collection was started after clinical examination and marker positioning. First, a static trial was acquired and then some specific anatomical markers were removed. Each participant was then asked to walk barefoot at a self-selected gait speed. A cycle for the right and the left sides was collected for the CG subjects. For the HG subjects a cycle for the affected side and the unaffected side was collected.
The DVideo kinematic analysis system from Brazil (22-24) was used to obtain the 3-D coordinates of the passive markers on the image sequence captured by video cameras. Four Gen-lock Basler cameras (Model A602fc, Germany) working at a 75-Hz frame rate were used. The 3-D marker coordinates were filtered with a zero-phase forward and reverse 4th-order Butterworth digital filter with a 6-Hz cut-off frequency.
Three types of variables were analyzed. The first type consisted of spatiotemporal variables associated with the lower limb gait cycle that were analyzed for all subjects: step length and width, stride length, speed, cadence and the support, double-support and swing phase durations. These variables were calculated according to Kirtley et al. (25). The second type of variables consisted of those obtained from the joint angle curves, such as maximum, minimum and average range of motion (ROM) of the ankle, knee, hip, shoulder (glenohumeral), and elbow joints in the three movement planes (sagittal, frontal and transverse). The last type of variables analyzed consisted of the lower and upper limb continuous angular variables
in the context of the gait cycle. 3-D joint rotation was cal-culated using Euler angles (26). The rotation sequence was: 1) flexion/extension angles about the z-axis of the proximal segment, 2) abduction/adduction angles about the floating axis, and 3) internal/external rotation about the x-axis of the distal segment. Angular curves were represented as a function of the percentage of the gait cycle. The statistical analysis was performed with the Matlab® software. Normality tests (Lilliefors test, P ≤ 0.05)
and variance tests (F-test, P ≤ 0.05) were applied before any comparison. When normal distribution and equality of variances were found, parametric analysis using the Student t-test (P ≤ 0.05) was applied. For non-parametric
statistics, the Wilcoxon test and the Mann-Whitney U-test (P ≤ 0.05) were applied.
The statistical comparisons were made in the follow-ing sequence: 1) CG right side versus CG left side, with no significant differences between CG left- and right-limb movement in any spatiotemporal or angular-dependent variables (P ≤ 0.05). Taking into account these statistical results and the information that all CG subjects were right-handed, we only used the CG’s right gait cycle results for all comparisons between CG and HG; 2) HG affected side versus HG unaffected side; 3) CG versus HG, and 4) for the continuous angle variables, comparisons between the HG affected side versus CG and between the HG unaf-fected side versus CG. These comparisons were made by applying statistical tests to each point of the 100% gait cycle to identify intracycle phases in which significant dif-ferences were found.
Results
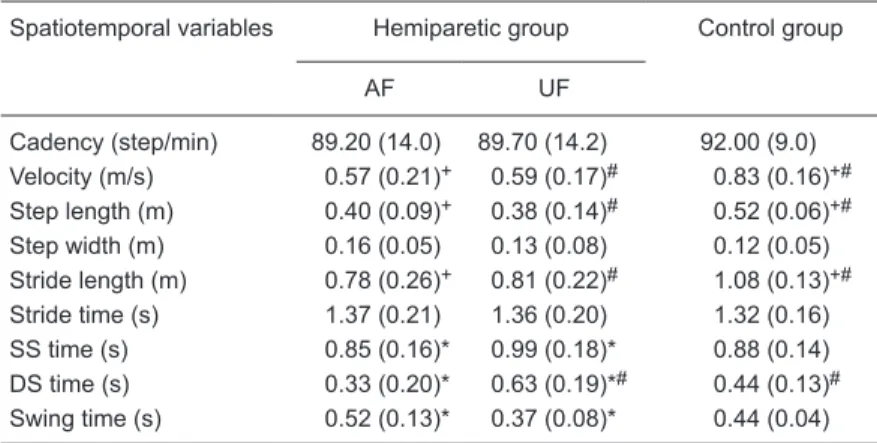
No significant differences were found between the hemiparetic and control groups for age (P = 0.318), weight (P = 0.654), or height (P = 0.232). The group averages for the spatiotemporal variable results are presented in Table 1. When the affected and unaffected sides of HG were compared to CG, HG presented lower speed (affected side: P = 0.012; unaffected side: P = 0.012), reduced stride length (affected side: P = 0.008; unaffected side: P = 0.012) and step length (affected side: P = 0.010; unaffected side: P = 0.006). In the comparisons between unaffected and affected side, the affected side showed shorter single- (P = 0.006) and double-support (P = 0.003) phases and longer swing phase duration (P = 0.004).
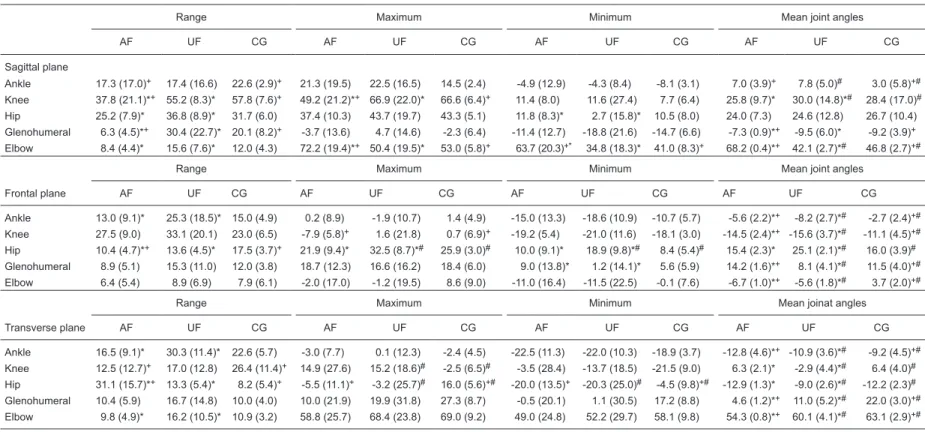
Table 2 shows the comparison between groups according to the upper and lower limb joint angles in the sagittal, frontal and transverse planes. The affected upper
Table 1. Spatiotemporal variables for the hemiparetic and control groups.
Spatiotemporal variables Hemiparetic group Control group
AF UF
Cadency (step/min) 89.20 (14.0) 89.70 (14.2) 92.00 (9.0) Velocity (m/s) 0.57 (0.21)+ 0.59 (0.17)# 0.83 (0.16)+#
Step length (m) 0.40 (0.09)+ 0.38 (0.14)# 0.52 (0.06)+#
Step width (m) 0.16 (0.05) 0.13 (0.08) 0.12 (0.05) Stride length (m) 0.78 (0.26)+ 0.81 (0.22)# 1.08 (0.13)+#
Stride time (s) 1.37 (0.21) 1.36 (0.20) 1.32 (0.16) SS time (s) 0.85 (0.16)* 0.99 (0.18)* 0.88 (0.14) DS time (s) 0.33 (0.20)* 0.63 (0.19)*# 0.44 (0.13)#
Swing time (s) 0.52 (0.13)* 0.37 (0.08)* 0.44 (0.04)
Data are reported as means (SD). Data are shown for the affected side (AF; N = 14) and the unaffected side (UF; N = 14) for the hemiparetic group (HG). For the control group (CG; N = 7), the data are for the right side of the subjects. SS time = single-support time; DS time = double-support time. +P < 0.05, comparison between AF and CG; #P < 0.05, comparison between UF and CG; *P < 0.05, comparison be
-tween AF and UF of HG subjects (t-test or Wilcoxon test according to the presence
Braz J Med Biol Res 45(x) 2012
www.bjournal.com.br
Table 2. Range, maximum, minimum, and mean joint angles in the three planes of movement.
Range Maximum Minimum Mean joint angles
AF UF CG AF UF CG AF UF CG AF UF CG
Sagittal plane
Ankle 17.3 (17.0)+ 17.4 (16.6) 22.6 (2.9)+ 21.3 (19.5) 22.5 (16.5) 14.5 (2.4) -4.9 (12.9) -4.3 (8.4) -8.1 (3.1) 7.0 (3.9)+ 7.8 (5.0)# 3.0 (5.8)+# Knee 37.8 (21.1)*+ 55.2 (8.3)* 57.8 (7.6)+ 49.2 (21.2)*+ 66.9 (22.0)* 66.6 (6.4)+ 11.4 (8.0) 11.6 (27.4) 7.7 (6.4) 25.8 (9.7)* 30.0 (14.8)*# 28.4 (17.0)# Hip 25.2 (7.9)* 36.8 (8.9)* 31.7 (6.0) 37.4 (10.3) 43.7 (19.7) 43.3 (5.1) 11.8 (8.3)* 2.7 (15.8)* 10.5 (8.0) 24.0 (7.3) 24.6 (12.8) 26.7 (10.4) Glenohumeral 6.3 (4.5)*+ 30.4 (22.7)* 20.1 (8.2)+ -3.7 (13.6) 4.7 (14.6) -2.3 (6.4) -11.4 (12.7) -18.8 (21.6) -14.7 (6.6) -7.3 (0.9)*+ -9.5 (6.0)* -9.2 (3.9)+ Elbow 8.4 (4.4)* 15.6 (7.6)* 12.0 (4.3) 72.2 (19.4)*+ 50.4 (19.5)* 53.0 (5.8)+ 63.7 (20.3)+* 34.8 (18.3)* 41.0 (8.3)+ 68.2 (0.4)*+ 42.1 (2.7)*# 46.8 (2.7)+#
Range Maximum Minimum Mean joint angles
Frontal plane AF UF CG AF UF CG AF UF CG AF UF CG
Ankle 13.0 (9.1)* 25.3 (18.5)* 15.0 (4.9) 0.2 (8.9) -1.9 (10.7) 1.4 (4.9) -15.0 (13.3) -18.6 (10.9) -10.7 (5.7) -5.6 (2.2)*+ -8.2 (2.7)*# -2.7 (2.4)+# Knee 27.5 (9.0) 33.1 (20.1) 23.0 (6.5) -7.9 (5.8)+ 1.6 (21.8) 0.7 (6.9)+ -19.2 (5.4) -21.0 (11.6) -18.1 (3.0) -14.5 (2.4)*+ -15.6 (3.7)*# -11.1 (4.5)+# Hip 10.4 (4.7)*+ 13.6 (4.5)* 17.5 (3.7)+ 21.9 (9.4)* 32.5 (8.7)*# 25.9 (3.0)# 10.0 (9.1)* 18.9 (9.8)*# 8.4 (5.4)# 15.4 (2.3)* 25.1 (2.1)*# 16.0 (3.9)# Glenohumeral 8.9 (5.1) 15.3 (11.0) 12.0 (3.8) 18.7 (12.3) 16.6 (16.2) 18.4 (6.0) 9.0 (13.8)* 1.2 (14.1)* 5.6 (5.9) 14.2 (1.6)*+ 8.1 (4.1)*# 11.5 (4.0)+# Elbow 6.4 (5.4) 8.9 (6.9) 7.9 (6.1) -2.0 (17.0) -1.2 (19.5) 8.6 (9.0) -11.0 (16.4) -11.5 (22.5) -0.1 (7.6) -6.7 (1.0)*+ -5.6 (1.8)*# 3.7 (2.0)+#
Range Maximum Minimum Mean joinat angles
Transverse plane AF UF CG AF UF CG AF UF CG AF UF CG
Ankle 16.5 (9.1)* 30.3 (11.4)* 22.6 (5.7) -3.0 (7.7) 0.1 (12.3) -2.4 (4.5) -22.5 (11.3) -22.0 (10.3) -18.9 (3.7) -12.8 (4.6)*+ -10.9 (3.6)*# -9.2 (4.5)+# Knee 12.5 (12.7)+ 17.0 (12.8) 26.4 (11.4)+ 14.9 (27.6) 15.2 (18.6)# -2.5 (6.5)# -3.5 (28.4) -13.7 (18.5) -21.5 (9.0) 6.3 (2.1)* -2.9 (4.4)*# 6.4 (4.0)# Hip 31.1 (15.7)*+ 13.3 (5.4)* 8.2 (5.4)+ -5.5 (11.1)+ -3.2 (25.7)# 16.0 (5.6)+# -20.0 (13.5)+ -20.3 (25.0)# -4.5 (9.8)+# -12.9 (1.3)* -9.0 (2.6)*# -12.2 (2.3)#
Glenohumeral 10.4 (5.9) 16.7 (14.8) 10.0 (4.0) 10.0 (21.9) 19.9 (31.8) 27.3 (8.7) -0.5 (20.1) 1.1 (30.5) 17.2 (8.8) 4.6 (1.2)*+ 11.0 (5.2)*# 22.0 (3.0)+# Elbow 9.8 (4.9)* 16.2 (10.5)* 10.9 (3.2) 58.8 (25.7) 68.4 (23.8) 69.0 (9.2) 49.0 (24.8) 52.2 (29.7) 58.1 (9.8) 54.3 (0.8)*+ 60.1 (4.1)*# 63.1 (2.9)+#
Data are reported as means (SD). The values shown correspond to the affected side (AF; N = 14) and unaffected side (UF; N = 14) of the hemiparetic group (HG) subjects and to the right side for the control group (CG; N = 7) subjects. +P < 0.05, comparison between AF and CG; #P < 0.05, comparison between UF and CG; *P < 0.05, comparison
542 A.A. Carmo et al.
limb showed differences in the sagittal, frontal and transverse planes compared to the unaffected side and to CG. In the sagittal plane, the glenohumeral joint presented reduced extension (P = 0.001) and ROM (P < 0.001), and the elbow joint presented higher flexion (P < 0.001) maximum (P = 0.020) and minimum (P < 0.001) values. In the frontal plane, the glenohumeral joint showed higher mean abduction values (P < 0.001) and higher minimum values (P = 0.006), and the elbow joint showed higher adduction (P = 0.012) and external rotation (P = 0.027). In the transverse plane, the glenohumeral joint presented reduced external rotation (P = 0.001) and the elbow joint showed reduced ROM (P = 0.035).
The unaffected upper limb joints also showed significant differences when compared with CG. The glenohumeral joint of the unaffected upper limb showed lower mean values for abduction (P = 0.020) and external rotation (P = 0.013). Moreover, the unaffected elbow joint oscillated around higher mean values for adduction (P = 0.020) and lower mean values for external rotation (P = 0.027).
For the motion of lower limb joints, significant differences were detected in the three planes of movement compared to CG and to the unaffected side. In the sagittal plane, the ankle and knee joints of the affected lower limb showed significant reduc -tion of the ROM compared to CG (P = 0.010; P = 0.022). The affected hip joint also showed significant reduction of the ROM in the sagittal plane, but only compared to the unaffected side (P = 0.003). The mean joint angle values indicated that the affected ankle oscillated around lower values of extension than CG (P <0.001), while the affected knee joint
oscillated around lower values of flexion compared to the un-affected side (P < 0.001). This last finding was also observed based on the lower maximum value of the affected knee joint compared to both CG (P = 0.040) and the unaffected side (P = 0.016). In the frontal and transverse planes the most important alterations were observed for the affected hip joint. Compared to the unaffected hip joint and CG, the affected hip joint presented a lower ROM in the frontal plane (P = 0.041; P = 0.006) and a higher ROM in the transverse plane (P = 0.001; P = 0.002). Moreover, the affected hip joint oscillated around lower maximum value of abduction than the unaffected side (P < 0.001) and higher mean values of internal rotation than both the unaffected side and CG (P < 0.001; P <0.001).
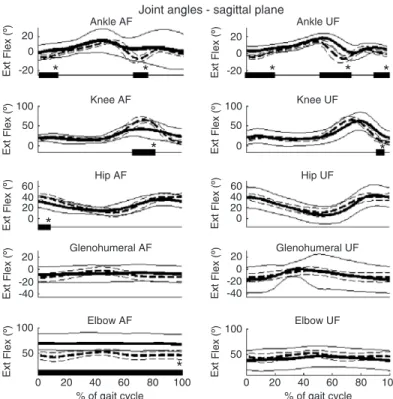
Figures 2, 3, and 4 show the intracycle analysis of angular variables. With this analysis it was possible to identify the exact moment during the gait cycle phase when the joint angles of HG were significantly different (P <0.05) from CG for the three movement planes.
Figure 2 shows the sagittal plane differences. The affected elbow presented significantly greater flexion throughout the gait cycle. Simultaneously, at the initial contact and loading
response, the affected hip showed reduced flexion and the affected ankle showed greater flexion. In the middle swing phase, the affected knee presented reduced flexion.
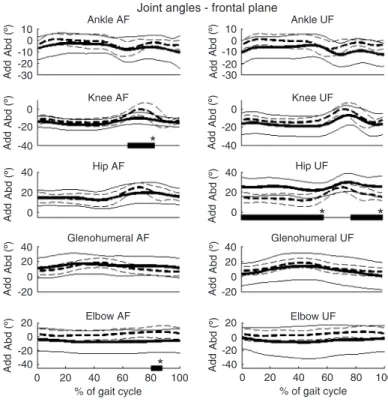
Figure 3 shows the frontal plane. No significant differences were found between the upper limb joint angles of the two groups. However, the unaffected hip presented a significantly higher abduction angle during the support, middle and terminal swing phases.
Figure 4 shows the transverse plane. The affected gle-nohumeral joint showed significant differences throughout the swing phase compared to CG, almost moving around the neutral position. In addition, both the affected and unaffected hip joints showed greater internal rotation during the support, initial and middle swing phases.
Discussion
The upper and lower limb motion analysis carried out in the present study showed that stroke gait is characterized not only by alterations in the lower limb and pelvis motion, but by a set of changes that also involve the upper limb motion. Although the
Figure 2. Mean and standard deviation of flexion/extension (Flex/Ext) joint
angles of HG, bold solid line (mean) and solid line (standard deviation) and CG, bold dashed line (mean) and dashed line (standard deviation). The charts show the joint angles of the affected side (AF) and unaffected side
(UF) of the HG. HG = hemiparetic group; CG = control group. The bars and asterisks on the x-axes indicate the phases of the gait cycle that presented significant differences (P ≤ 0.05) between the HG and CG curves (t-test or
Wilcoxon test according to the presence or absence of normal distribution
Figure 3. Mean and standard deviation of ab-duction/adduction (Abd/Add) joint angles of HG, bold solid line (mean) and solid line (standard deviation) and CG, bold dashed line (mean) and dashed line (standard deviation). The charts show the joint angles of the affected side (AF) and unaffected side (UF) of the HG. HG =
hemi-paretic group; CG = control group. The bars and asterisks on the x-axes indicate the phases of the gait cycle that presented significant dif
-ferences (P ≤ 0.05) between the HG and CG
curves (t-test or Wilcoxon test according to the
presence or absence of normal distribution and equality of variance).
Figure 4. Mean and standard deviation of
inter-nal/external (IR/ER) rotation joint angles of HG,
bold solid line (mean) and solid line (standard deviation) and CG, bold dashed line (mean) and dashed line (standard deviation). The charts show the joint angles of the affected side (AF) and unaffected side (UF) of HG. HG =
hemipa-retic group; CG = control group. The bars and asterisks on the x-axes indicate the phases of the gait cycle that presented significant dif
-ferences (P ≤ 0.05) between the HG and CG
curves (t-test or Wilcoxon test according to the
544 A.A. Carmo et al.
lower limb and pelvis motions have been widely analyzed (1-3,27-29), the upper limb motion during stroke gait has not been quantified in the literature.
The analysis of the lower limb and pelvis motion was the reference used to guide our study and the results showed significant kinematic differences in the affected lower limbs and in the spatial and temporal parameters. The main alterations found for the affected lower limb joints were: decreased ankle, knee and hip flexion/extension ROM and lower hip and knee flexion angles that disturb the initial contact, take-off and swing phases. Moreover, in the analysis of the spatial and temporal gait parameters, the gait pattern of the stroke group was characterized by slower velocity, reduced stride and step length, decreased single- and double-support phases and increased swing phase. All of these findings agree with those of pioneer-ing studies (1-3) that claimed that the majority of these changes were due to spasticity and weakness of knee and hip extensor muscles.
However, the results of the present study also showed that affected upper limb motion during stroke gait was characterized by decreased ROM in the glenohumeral and elbow joints in the sagittal plane. It was also associated with higher elbow joint flexion, higher abduction angle of the glenohumeral joint and reduced external rotation of the glenohumeral joint. Furthermore, the intracycle analysis of the upper limb movement used in the present study was able to demonstrate that, despite the decreased ROM of the affected glenohumeral joint in the sagittal plane, the pattern of movement did not differ from that of the unaffected side or of the control group, while the affected elbow joint showed a significant flexion pattern throughout the cycle compared to both groups. These alterations of the affected upper limb may be due to spasticity (1) and its associatied reactions (12) in the upper limb muscle groups in stroke subjects (1). The associated reactions of the spastic up-per limb have been reported in 80% of hemiplegia stroke patients (30) and are usually characterized by sudden flexion at the elbow and abduction and elevation of the shoulder, as observed in the present study. Association reactions often occur when a voluntary movement is being attempted but may also accompany involuntary actions such as yawning or sneezing (12).
In patients with an upper motoneuron syndrome (par-ticularly those who suffer a stroke), a common pattern of upper extremity joint dysfunction, the arm is adducted tightly against the lateral chest wall, the elbow is typically flexed, and the shoulder is internally rotated (31). However, in the present study, this combination of pathological alterations of the affected upper limb was not detected during stroke gait. This difference may be due to the fact that the study of Mayer et al. (31) was conducted using observational clinical evaluations with the patient in a static position, while our study was done using a 3-D kinematic analysis. The kinematic analysis of movement is an effective method
for the diagnosis of alterations in the movement patterns because of its higher accuracy and precision compared to qualitative and/or observational methods.
Since the human body is an articulated biomechanical system, the alterations in upper and lower limb motion can be related to each other during stroke gait. Furthermore, some researchers (12,13,32) have investigated the role of the arms for normal and pathological gait by the analysis of lower limb motion after restriction and treatment of upper limb motion. Their results have shown that alterations in upper limb motion lead to some disturbances in the gait pattern. In normal gait, reduced stride length and velocity was observed when arm movements were constrained (13,32). Some studies of stroke gait (11,12,33) have re-ported improvement in the temporal parameters, especially in gait velocity, and also in the angular variables, showing an increase in the affected ankle and knee ROM of stroke patients after BTX injection into the spastic upper limb. Ac-cording to Davies (34), severe association reactions of the paralyzed arm during walking, as observed in our patients, accentuate the hemiplegic posture and may interfere with balance and safe ambulation. Thus, all of these findings indicate that any changes in upper limb movement could be related to spatiotemporal gait parameters and perhaps the upper limb dysfunctions found in the present study could be one of the factors in the spatiotemporal alterations of stroke gait. However, the present results are not sufficient to reach this conclusion.
On the other hand, the changes in upper limb move-ments may constitute compensatory strategies and may be helpful to improve gait balance and body weight distribution. Carmo (35) reported compensatory strategies of the upper limbs through the gait cycle. The author found an increase of the abduction angle of the affected glenohumeral joint compensating the higher lateral displacement of the center of mass during stroke gait. Our study agrees with these re-sults, since it also showed that HG oscillated around higher mean values of abduction of the affected glenohumeral joint than CG and the unaffected side.
References
1. Olney SJ, Richards C. Hemiparetic gait following stroke. Part I: Characteristics. Gait Posture 1996; 4: 136-148.
2. Kim CM, Eng JJ. Magnitude and pattern of 3-D kinematic
and kinetic gait profiles in persons with stroke: relationship
to walking speed. Gait Posture 2004; 20: 140-146.
3. Perry J. Gait analysis: normal and pathological function.
Thorofare: Slack; 1992.
4. Frigo C, Carabalona R, Dalla MM, Negrini S. The upper body segmental movements during walking by young females.
Clin Biomech 2003; 18: 419-425.
5. Kavanagh JJ, Barrett RS, Morrison S. Upper body accelera-tions during walking in healthy young and elderly men. Gait Posture 2004; 20: 291-298.
6. Hodges PW, Cresswell AG, Daggfeldt K, Thorstensson A. Three dimensional preparatory trunk motion precedes asymmetrical upper limb movement. Gait Posture 2000; 11: 92-101.
7. Dietz V, Fouad K, Bastiaanse CM. Neuronal coordination of arm and leg movements during human locomotion. Eur J Neurosci 2001; 14: 1906-1914.
8. Kubo M, Holt KG, Saltzman E, Wagenaar RC. Changes in
axial stiffness of the trunk as a function of walking speed. J Biomech 2006; 39: 750-757.
9. Stephenson JL, De Serres SJ, Lamontagne A. The effect of arm movements on the lower limb during gait after a stroke.
Gait Posture 2010; 31: 109-115.
10. Stephenson JL, Lamontagne A, De Serres SJ. The coordination of upper and lower limb movements during gait in healthy and stroke individuals. Gait Posture 2009; 29: 11-16.
11. Hirsch MA, Westhoff B, Toole T, Haupenthal S, Krauspe
R, Hefter H. Association between botulinum toxin injection
into the arm and changes in gait in adults after stroke. Mov Disord 2005; 20: 1014-1020.
12. Bakheit AM, Sawyer J. The effects of botulinum toxin treat -ment on associated reactions of the upper limb on hemiple-gic gait - a pilot study. Disabil Rehabil 2002; 24: 519-522.
13. Ford MP, Wagenaar RC, Newell KM. The effects of auditory rhythms and instruction on walking patterns in individuals post stroke. Gait Posture 2007; 26: 150-155.
14. Kadaba MP, Ramakrishnan HK, Wootten ME. Measurement
of lower extremity kinematics during level walking. J Orthop Res 1990; 8: 383-392.
15. Wu G, van der Helm FC, Veeger HE, Makhsous M, Van Roy
P, Anglin C, et al. ISB recommendation on definitions of joint
coordinate systems of various joints for the reporting of hu-man joint motion - Part II: shoulder, elbow, wrist and hand.
J Biomech 2005; 38: 981-992.
16. Cappozzo A, Catani F, Croce UD, Leardini A. Position and ori-entation in space of bones during movement: anatomical frame
definition and determination. Clin Biomech 1995; 10: 171-178.
17. Bell AL, Pedersen DR, Brand RA. A comparison of the ac-curacy of several hip center location prediction methods. J Biomech 1990; 23: 617-621.
18. Meskers CG, van der Helm FC, Rozendaal LA, Rozing PM.
In vivo estimation of the glenohumeral joint rotation center from scapular bony landmarks by linear regression. J Bio-mech 1998; 31: 93-96.
19. Fugl-Meyer AR, Jaasko L, Leyman I, Olsson S, Steglind S. The post-stroke hemiplegic patient. 1. A method for evalu-ation of physical performance. Scand J Rehabil Med 1975;
7: 13-31.
20. Miyamoto ST, Lombardi Junior I, Berg KO, Ramos LR, Na-tour J. Brazilian version of the Berg balance scale. Braz J Med Biol Res 2004; 37: 1411-1421.
21. Bohannon RW, Smith MB. Interrater reliability of a modified
Ashworth scale of muscle spasticity. Phys Ther 1987; 67:
206-207.
22. Barros RML, Brenzikofer R, Leite NJ, Figueroa PJ. Desen-volvimento e avaliação de um sistema para análise tridi-mensional de movimentos humanos. Rev Bras Eng Biomed 1999; 79-86.
23. Leite de Barros RM, Guedes RT, Brenzikofer R, Jovino FP. A method to synchronise video cameras using the audio band.
J Biomech 2006; 39: 776-780.
24. Figueroa PJ, Leite NJ, Barros RM. A flexible software for
tracking of markers used in human motion analysis. Comput Methods Programs Biomed 2003; 72: 155-165.
25. Kirtley C. Clinical gait analysis - theory and practice. London:
Elsevier Churchill Livingstone; 2006.
26. Chao EY. Justification of triaxial goniometer for the measure -ment of joint rotation. J Biomech 1980; 13: 989-1006.
27. Yavuzer G, Oken O, Elhan A, Stam HJ. Repeatability of lower limb three-dimensional kinematics in patients with stroke. Gait Posture 2008; 27: 31-35.
28. von Schroeder HP, Coutts RD, Lyden PD, Billings E Jr, Nickel VL. Gait parameters following stroke: a practical as-sessment. J Rehabil Res Dev 1995; 32: 25-31.
29. De Quervain I, Simon SR, Leurgans S, Pease WS, McAl-lister D. Gait pattern in the early recovery period after stroke.
J Bone Joint Surg Am 1996; 78: 1506-1514.
30. Mulley G. Associated reactions in the hemiplegic arm. Scand J Rehabil Med 1982; 14: 117-120.
31. Mayer NH, Esquenazi A, Martin K, Childers DO. Common patterns of clinical motor dysfunction. Muscle and Nerve 1990; 20 (Suppl 6): S21-S35.
32. Eke-Okoro ST, Gregoric M, Larsson LE. Alterations in gait resulting from deliberate changes of arm-swing amplitude and phase. Clin Biomech 1997; 12: 516-521.
33. Esquenazi A, Mayer N, Garreta R. Influence of botulinum toxin type A treatment of elbow flexor spasticity on hemipa -retic gait. Am J Phys Med Rehabil 2008; 87: 305-310.
34. Davies P. Steps to follow: A guide to the treatment of adult hemiplegia. Berlin: Verlag; 1985.
35. Carmo AA. Kinematic analysis of upper and lower limbs trunk and head motions during hemiparetic gait after stroke. [Master’s thesis]. Campinas: Faculdade de Educação
Física, UNICAMP; 2009.
Acknowledgments
We acknowledge financial support from FAPESP (#06/05234-6), CNPq (#473729/2008-3, #304975/2009-5,