Consistency of the results of path analysis among sugarcane
experiments
Bruno Portela Brasileiro1*, Luiz Alexandre Peternelli1 and Márcio Henrique Pereira Barbosa2
Received 20 October 2012
Accepted 25 March 2013
Abstract – The aim of this research was to evaluate the consistency of path analyses in sugarcane experiments based on genetic, phenotypic and genotypic correlations. Forty-four analyses were made with a view toward quantifying the direct and indirect effects of stalk height (SH), stalk diameter (SD) and number of stalks (NS) on sugarcane weight (SW). NS had the greatest direct effect on SW in all the analyses with the use of genetic and phenotypic correlations and in 12 analyses with use of the genotypic correlations. SD had a high direct effect on SW, going beyond NS in only one experiment, while SH had the lowest direct effect on SW in most of the experiments. The results showed greater consistency with the use of genetic and phenotypic correlations. In the balanced experiments, the phenotypic and genetic correlations showed equivalent results. NS is the main determinant of changes in sugarcane production.
Key words:Saccharum spp., correlations, genetic breeding.
1 Universidade Federal de Viçosa (UFV), Departamento de Estatística, 36.570-000, Viçosa, MG, Brazil. *E-mail: brunobiogene@hotmail.com 2 UFV, Departamento de Fitotecnia
INTRODUCTION
The use of correlation coefficients is relevant for
quantification of the associability between two variables (Falconer and Mackay 1996). However, correlation might
not be a measure of cause and effect, and direct
interpreta-tion of its magnitudes may result in mistakes in selecinterpreta-tion strategy. High correlation in some cases may be the result
of the effect of a third variable or of a group of variables
on the response variable (Silva et al. 2012). Path analysis allows the correlation coefficients to be broken down into direct and indirect effects on a main variable (Tyagi and Lal 2007). Therefore, the use of this methodology in sugarcane breeding programs is highly worthwhile in its initial stages because the methodology aims at indicating
the most adequate characteristics so that indirect selection
be made of the most productive families since quantifying their production is quite a slow job due to the large number of genotypes assessed in these stages (Barbosa and Silveira 2012). In addition, knowledge of a consistent pattern of
relationship between the component variables of produc
-tion may present new perspectives on estimating sugarcane weight (SW), which is usually practiced in studies where the plots are not harvested and sugarcane weight is estimated in accordance with Chang and Milligan (1992).
In experiments with sugarcane, some authors have used only the phenotypic correlation in path analysis (Sukhchain and Saini 1997, Tyagi and Lal 2007). Others, however, in addition to phenotypic correlation, have also used genotypic
correlation obtained as based on decomposition of variance and covariance components (Ferreira et al. 2007, Espósito et
al. 2012, Silva et al. 2012). For Silva et al. (2009), genetic
correlations (Pearson correlation) obtained from the
geno-typic mean values predicted from mixed models (REML/ BLUP), are more efficient in determination of the direct
and indirect effects of the traits.
It is known that the genotypic values predicted by means of mixed model analysis lead to more precise and accurate inferences (Barbosa et al. 2004), increasing the efficiency of breeding programs. By means of BLUP, the phenotypic
values are corrected to the environmental effects and are
weighted by the heritability of the trait, which is estimated by the REML procedure. In this case, it is presumed that path analysis would be most effective when based on predicted genotypic values than when applied to phenotypic values.
Kang et al. (1983) affirm that, from the practical point of view, the path coefficients obtained from the genotypic
correlations are more important for deciding on the best
selection criteria. However, according to Resende (2002), Crop Breeding and Applied Biotechnology 13: 113-119, 2013
Brazilian Society of Plant Breeding. Printed in Brazil
traits that are correlated genotypically but not phenotypi
-cally might not have practical value for selection because this is generally based on phenotype.
Thus, one observes that for defining the correlations to be used in path analyses, three possibilities are manifest in the literature: the phenotypic correlation obtained via Pearson correlation on the phenotypic values, and the two types of correlation of genetic origin, one obtained from analysis
of variance and covariance, and the other via Pearson
cor-relation of the genotypic values predicted through mixed models. Each author uses the former or the latter type of correlation through believing that the analyses based on these measures may lead to more trustworthy conclusions, or through simple ease of application or use of software. Nevertheless, there is no consensus on the best strategy. The aim of this study is to evaluate the consistency of the results of path analysis in different sugarcane experiments through the use of genetic, phenotypic and genotypic correlations, as well as identifying the variable which has the greatest effect on SW, with a view toward optimizing the selection process of sugarcane families in the field.
MATERIAL AND METHODS
For the present study, 110 full-sib families and 100 half-sib families were used, derived from crosses undertaken in the years 2006 and 2010, respectively, at the Serra do Ouro
Experimental Station of the Universidade Federal de Alagoas
(Federal University of Alagoas), located in the municipality
of Murici, AL, Brazil. The plantlets originating from
bipa-rental crosses and polycrosses, after acclimatization, were
sent for setting up the experiment in the experimental area
of the Sugarcane Research and Breeding Center (Centro de Pesquisa e Melhoramento de Cana-de-Açúcar - CECA)
belonging to the Federal University of Viçosa, in the mu
-nicipality of Oratórios, MG, Brazil, with latitude 20º 25’ S, longitude 42º 48’ W, altitude 494 m asl and LVE soil.
The 110 full-sib families were distributed in five experi
-ments, each one with 22 families. The experiments were
set up in 2007 in a randomized block design with five rep
-lications. Each plot was composed of 20 plants distributed in two five-meter length furrows, spaced at 1.40 m. The data from plant-cane were collected in June 2008 and from ratoon-cane in June 2009.
The 100 half-sib families were distributed in five experi
-ments, each with 20 families. The experiments were set up in 2010 in a randomized block design with six replications. Each plot was composed of 10 plants, distributed in a 5 m length furrow, with between furrow spacing of 1.40 m. The ratoon-cane data were collected in June 2012.
In all the experiments, the traits evaluated were: aver
-age stalk height (SH) in meters, measuring one stalk from
each plant, from the base of the stalk up to the first leaf with dewlap visible; stalk diameter (SD) in centimeters, with the
sampling made at the third internode, counted from the base of the stalk to the apex, measuring a stalk from each plant
with a caliper rule; and number of stalks per plot (NS). The dependent variable, sugarcane weight (SW, in t
ha-1), was obtained in a different manner depending on
the type of experiment considered. In the full-sib families, SW was obtained from weighing all the plants of the plot using a spring scale and applying the expression: SW = (total weight of the plot x10)/tp, in which tp is the plot size in m². In the experiments of half-sib families, the SW was estimated with the weighing of a 10 stalk sample from the plot, using a spring scale and applying the expression: SW = (NS x average weight of the stalk x 10)/tp.
The phenotypic and genotypic correlations were obtained
based on the decomposition of variance and covariance
com-ponents, while the genetic correlations were obtained from mean values corrected by REML/BLUP, and the statistical model adopted for full-sib families is presented as follows: y = Xr + Za + Wf + e, in which y is the vector of phenotypic data; r is the vector of the effects of block (fixed) added to
the overall mean value; a is the vector of individual addi
-tive genetic effects (random); f is the vector of dominance effects (random); e is the vector of errors (random); and X, Z and W refer to the matrices of incidence that relate the fixed and random effects of the model to the data.
For half-sib families, the following statistical model was adopted: y = Xr + Zg + e, in which y is the vector of phenotypic data, r is the vector of the effects of block (fixed)
added to the overall mean value, g is the vector of
geno-typic effects (random), e is the vector of errors (random). Capital letters represent the matrices of incidence for the
aforementioned effects.
Before carrying out path analysis, a diagnosis of mul
-ticollinearity was carried out in the 45 correlation matrices among the explanatory variables (X' X), i.e., in the three correlation matrices (phenotypic, genotypic and genetic)
for each one of the 15 experiments evaluated. The degree
of multicollinearity was established based on the condition number (Montgomery and Peck 1992). Afterwards, path analysis was carried out according to the general causal
diagram (Ferreira et al. 2007), in which sugarcane produc
RESULTS AND DISCUSSION
The mean values for SW in full-sib families were from 70 to 85 tons in the plant-cane stage, with production differences
of up to 39 t ha-1 between the best and worst family of the
same experiment. In the ratoon-cane stage, the mean value
of production was from 104 to 113 t ha-1, and the greatest
amplitude in the same experiment was only 2.69 t ha-1. In
half-sib families in the ratoon-cane stage, the mean values
of SW were from 87 to 91 tons, with differences in produc
-tion of up to 76 t ha-1 between the best and worst family of
the same experiment. The descriptive analyses for SW are
shown in Table 1. In general, the statistics showed similar values between the experiments of full-sib families in the
ratoon-cane and plant-cane stages.
Estimates of the correlation coefficients between SW
and its components were positive, relatively high and sig
-nificant (P < 0,05) by the t test (Table 2), suggesting that the increase in any of the components would cause a mean increase in SW. It is fitting to highlight that the significance
of the genotypic correlations was evaluated by the expres
-sion: t r / vâr(r )= g g following Espósito et al. (2012).
NS showed the greatest correlation with SW in 11 genetic
Table 1.Overall mean value, mean square of the genotype (MSG), experimental coefficient of variation (CV%), maximum and minimum values and
amplitude of the genotypic mean values estimated by REML/BLUP for the sugarcane weight trait (SW, in t ha-1) in 110 full-sib families (Exp I - X) and 100 half-sib families (Exp XI – XV) in sugarcane
Exp Mean MSG CV (%) Maximum Minimum Amplitude
I 72.84 856.54 35.68 73.42 72.38 1.03
II 82.10 659.21 32.89 94.12 59.80 34.32
III 85.35 504.97 22.70 85.68 84.86 0.81
IV 69.99 896.29 33.29 88.96 49.39 39.57
V 73.49 815.06 31.56 81.11 65.18 15.92
VI 112.39 2085.27 36.24 113.07 111.89 1.18
VII 113.42 2052.90 39.93 114.45 112.41 2.03 VIII 112.10 700.38 25.88 113.50 110.80 2.69
IX 104.70 1587.29 37.22 105.03 104.19 0.83
X 110.07 2277.57 32.95 110.40 109.74 0.65
XI 91.69 2341.67 23.37 115.83 48.56 67.27
XII 90.48 1756.25 24.05 106.85 51.54 55.31
XIII 87.13 628.75 22.60 95.68 79.03 16.65
XIV 89.15 1871.08 19.77 129.76 66.62 63.13
XV 91.85 1759.07 21.73 121.14 64.22 56.92
Table 2. Phenotypic (rf), genotypic (rg) and genetic (rgblup) correlations between the variables of number of stalks (NS), stalk diameter (SD), stalk height
(SH) and sugarcane weight (SW) in 110 full-sib families (Exp I - X) and 100 half-sib families (Exp XI – XV) in sugarcane
Exp
Correlations
NS.SH NS.SD SH.SD NS.SW SH.SW SD.SW
rf rg rgblup rf rg rgblup rf rg rgblup rf rg rgblup rf rg rgblup rf rg rgblup
I 0.36* 0.37** 0.35 0.13 0.22 0.01 0.08 0.82 0.18 0.90** 0.90** 0.84** 0.54** 0.55** 0.54** 0.46* 0.64** 0.48*
II 0.63** 1.05 0.67** 0.58** 0.98 0.48* 0.74** 1.09 0.75** 0.95** 1.17 0.89** 0.64** 0.77 0.73** 0.69** 0.86 0.66**
III 0.30 0.28 0.26 0.32 0.45* 0.41* 0.41* 0.45* 0.40* 0.85** 0.87** 0.90** 0.65** 0.68** 0.58** 0.60** 0.70** 0.69**
IV 0.57** 0.72** 0.63** 0.12 0.11 0.25 0.50** 0.65** 0.49* 0.83** 0.86** 0.84** 0.79** 0.90** 0.80** 0.57** 0.67** 0.60**
V 0.70** 0.77** 0.65** 0.67** 0.78** 0.50* 0.70** 0.73** 0.61** 0.94** 0.97** 0.89** 0.84** 0.87** 0.76** 0.84** 0.89** 0.77**
VI 0.49* 0.54* 0.41* 0.14 0.19* 0.04 0.62** 0.71** 0.65** 0.87** 0.87** 0.75** 0.77** 0.82** 0.79** 0.49* 0.56** 0.51*
VII 0.48* 0.53* -0.02 0.15 0.17 -0.16 0.74** 0.80** 0.92** 0.92** 0.92** 0.92** 0.75** 0.80** 0.58** 0.49* 0.53* 0.26
VIII 0.33 0.42* 0.27 0.12 0.26 -0.07 0.64** 0.70** 0.51* 0.76** 0.70** 0.75** 0.62** 0.70** 0.57** 0.68** 0.87** 0.62** IX 0.51* 0.69** 0.26 -0.12 -0.10 -0.27 0.45* 0.47* 0.48* 0.81** 0.72** 0.72** 0.82** 0.99** 0.78** 0.42* 0.58** 0.49* X 0.70** 0.74** 0.69** 0.44* 0.55** 0.20 0.71** 0.76** 0.69** 0.92** 0.92** 0.81** 0.85** 0.89** 0.90** 0.72** 0.81** 0.76** XI 0.27 0.29 0.27 0.42* 0.64** 0.42* 0.30 0.34 0.30 0.84** 0.86** 0.84** 0.60** 0.64** 0.60** 0.52* 0.68** 0.52* XII -0.03 -0.13 -0.03 0.23 0.38 0.23 0.48* 0.53* 0.48* 0.73** 0.74** 0.73** 0.51* 0.52* 0.51* 0.74** 0.90** 0.74**
XIII 0.07 0.07 0.07 -0.47* -0.51* -0.47* 0.04 -0.05 0.04 0.66** 0.81** 0.66** 0.44* 0.56** 0.44* 0.10 0.12 0.10
correlation matrices (0.66 ≤ rgblup ≤ 0.89), in 13 phenotypic
correlation matrices (0.66 ≤ rf ≤ 0.94) and in 10 cases in
which the genotypic correlations were used (0.70 ≤ rg ≤
0.96). In most experiments, SH was the trait with the second greatest genetic (0.51 ≤ rgblup ≤ 0.91), phenotypic (0.51 ≤ rf ≤
0.98) and genotypic (0.52 ≤ rg ≤ 0.98) correlations with SW,
followed by SD which also presented high genetic (0.10 ≤
rgblup ≤ 0.77), phenotypic (0.51 ≤ rf ≤ 0.90) and genotypic
(0.12 ≤ rg ≤ 0.90) correlations with SW (Table 2).
In this study, NS exhibited the greatest importance in determining SW, since the correlations between the two traits were of high magnitude. However, as studies
of correlations do not give the relative importance of the
production components on the main variable, path analyses were carried out for the purpose of making a breakdown of the correlation coefficients into direct and indirect effects.
Analysis of the condition number indicated weak mul
-ticollinearity (Nc < 100) in the correlation matrix of the ex
-planatory variables in 44 of the 45 analyses performed. Only the genotypic correlation matrix of experiment II exhibited moderate multicollinearity (Nc = 138.4) (Table 3), thus not being used in the analysis because, under these conditions, the variances associated with the estimators of path analysis may reach excessively high values, resulting in estimates that are not very reliable (Montgomery and Peck 1992).
The phenotypic, genotypic and genetic path coefficients efficiently explained the variations in SW, as indicated by the high values of the coefficient of determination of the
model (R² ≥ 0.80), as well as the small residual effect (pε
≤ 0.45). This result indicates the excellent contribution of these explanatory variables to sugarcane production (Tables 3, 4 and 5), confirming the possibility of practicing selection
based on these variables.
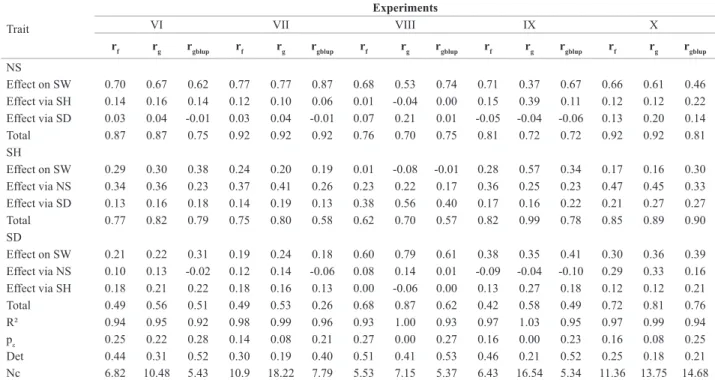
The NS trait exhibited the greatest direct effect on SW in 12 of the analyses with the use of genotypic correlations, and in all analyses with the use of genetic and phenotypic analyses, and, in general, the values obtained were similar between the experiments in the plant-cane and ratoon-cane stages and between full-sib and half-sib families (Tables 3, 4 and 5). Sukhchain and Saini (1997), Silva et al. (2009)
and Espósito et al. (2012) also obtained high direct effects
of NS on SW, suggesting selection of clones for SW based
in this trait. The direct effects (genetic, genotypic and phe
-notypic) of SD on SW were in general high, ranging from 0.11 to 0.79; however, its direct effects were only greater than the effects of NS on SW in experiment VIII and as of
the genotypic correlation (Table 4). A similar result was ob
-tained by Ferreira et al. (2007), who also ob-tained a greater direct of SD on SW with the use of genotypic correlation. However, with the use of the phenotypic correlation of the
Table 3. Path analysis as of phenotypic (rf), genotypic (rg) and genetic (rgblup) correlation of the production components: number of stalks (NS), stalk
diameter (SD) and stalk height (SH) on sugarcane weight (SW) in the experiments with full-sib families in the plant-cane stage
Trait
Experiments
I II III IV V
rf rg rgblup rf rg rgblup rf rg rgblup rf rg rgblup rf rg rgblup
NS
Effect on SW 0.77 0.69 0.77 0.86 - 0.77 0.67 0.66 0.71 0.65 1.01 0.60 0.61 0.58 0.61 Effect via SH 0.09 0.10 0.06 -0.07 - -0.04 0.10 0.11 0.07 0.13 -0.24 0.17 0.15 0.16 0.08 Effect via SD 0.05 0.11 0.01 0.16 - 0.16 0.08 0.10 0.12 0.05 0.09 0.07 0.19 0.22 0.20 Total 0.90 0.90 0.84 0.95 - 0.89 0.85 0.87 0.90 0.83 0.86 0.84 0.94 0.97 0.89 SH
Effect on SW 0.24 0.28 0.18 -0.10 - -0.05 0.35 0.40 0.20 0.23 -0.33 0.29 0.21 0.21 0.11 Effect via NS 0.28 0.25 0.27 0.54 - 0.53 0.20 0.18 0.25 0.38 0.73 0.35 0.43 0.45 0.43 Effect via SD 0.03 0.01 0.08 0.20 - 0.25 0.10 0.10 0.13 0.19 0.50 0.16 0.20 0.21 0.22 Total 0.54 0.55 0.54 0.64 - 0.73 0.65 0.68 0.58 0.79 0.90 0.80 0.84 0.87 0.76 SD
Effect on SW 0.33 0.48 0.44 0.27 - 0.37 0.24 0.22 0.26 0.37 0.76 0.30 0.28 0.29 0.36 Effect via NS 0.11 0.16 0.01 0.50 - 0.33 0.21 0.3 0.33 0.08 0.12 0.14 0.41 0.46 0.34 Effect via SH 0.02 0.01 0.03 -0.08 - -0.04 0.14 0.18 0.10 0.12 -0.21 0.15 0.15 0.15 0.07 Total 0.46 0.64 0.48 0.69 - 0.66 0.60 0.70 0.69 0.57 0.67 0.60 0.84 0.89 0.77 R² 0.97 1.08 0.97 0.93 - 0.89 0.93 1.00 0.94 0.93 1.09 0.91 0.98 1.00 0.90 pε 0.18 0.00 0.15 0.27 - 0.33 0.26 0.04 0.25 0.26 0.00 0.3 0.12 0.03 0.31 Det 0.85 0.81 0.84 0.25 0.01 0.27 0.71 0.62 0.56 0.47 0.15 0.45 0.22 0.14 0.29 Nc 2.26 2.51 2.31 9.34 138.4 9.98 2.93 3.72 4.03 6.24 24.19 6.19 8.40 12.15 7.74
same experiment, the NS trait was that which exhibited the greatest direct effect on SW. The SH trait exhibited lower direct effects (genetic, genotypic and phenotypic) on SW, ranging from -0.33 to 0.57. The value of 0.57 was estimated in experiment IX, and, in this analysis, SH was the variable with the greatest direct effect on SW (Table 4).
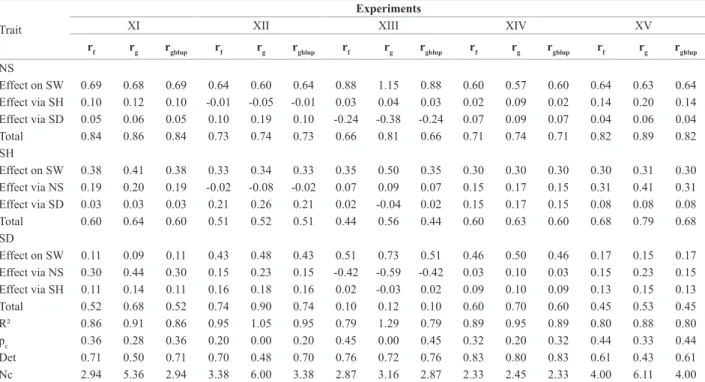
In the present study, the values obtained from the genetic and phenotypic correlations in the experiments of half-sib families were identical. However, in the experiments of full-sib families, the genetic and phenotypic correlations
exhibited differences, although the values of these
cor-relations were consistent. The data of full-sib families
are unbalanced because the participation of the parents
in the biparental crosses was not equitable, as observed in the pedigree used in the analysis. This imbalance has led to different precisions in prediction of the genotypic values, even with the use of the REML/BLUP procedure
(Barbosa et al. 2004). Nevertheless, pedigree information
in full-sib families has shown more accurate estimates of genetic parameters (Nunes et al. 2008, Atkin et al. 2009),
indicating that under these conditions, the genetic
correla-tions estimated by mixed models (REML/BLUP) are more precise that the correlations estimated by analysis of variance (Durel et al. 1998). As the experiments of half-sib families are balanced, the genetic and phenotypic correlations did
not exhibit differences, consequently generating the same results in path analyses (Table 5), showing that the REML/ BLUP procedures and analysis of variance are equivalent
in balanced experiments.
Conflicting values were obtained as a result of the use of genotypic correlations, which may have occurred due to overestimated correlations between the traits evaluated, as identified in the correlation matrix of experiment II, which exhibited correlations above one (Table 2) and, consequently, problems with multicollinearity. The values of genotypic correlations between all the pairs of traits were greater than the phenotypic and genetic correlations in all the experiments, agreeing with the theoretical and practical results obtained by other authors (Cheverud 1988, Ferreira et al. 2007, Espósito et al. 2012). For Cheverud (1988), high genotypic correlation without the same pattern of phenotypic correlation occurs
due to the lack of precision in the estimates of the genetic
components used in obtaining the genotypic correlation matrix. Although the results were more consistent with the use of genetic and phenotypic correlations, genotypic path analyses exhibited greater coefficients of determination and lower residual effects, explaining 100% of the variation in SW in eight analyses, with six being in experiments of full-sib families and two in half-sib families.
Table 4. Path analysis as of phenotypic (rf), genotypic (rg) and genetic (rgblup) correlation of the production components: number of stalks (NS), stalk
diameter (SD) and stalk height (SH) on sugarcane weight (SW) in the experiments with full-sib families in the ratoon-cane stage
Trait
Experiments
VI VII VIII IX X
rf rg rgblup rf rg rgblup rf rg rgblup rf rg rgblup rf rg rgblup
NS
Effect on SW 0.70 0.67 0.62 0.77 0.77 0.87 0.68 0.53 0.74 0.71 0.37 0.67 0.66 0.61 0.46 Effect via SH 0.14 0.16 0.14 0.12 0.10 0.06 0.01 -0.04 0.00 0.15 0.39 0.11 0.12 0.12 0.22 Effect via SD 0.03 0.04 -0.01 0.03 0.04 -0.01 0.07 0.21 0.01 -0.05 -0.04 -0.06 0.13 0.20 0.14 Total 0.87 0.87 0.75 0.92 0.92 0.92 0.76 0.70 0.75 0.81 0.72 0.72 0.92 0.92 0.81 SH
Effect on SW 0.29 0.30 0.38 0.24 0.20 0.19 0.01 -0.08 -0.01 0.28 0.57 0.34 0.17 0.16 0.30 Effect via NS 0.34 0.36 0.23 0.37 0.41 0.26 0.23 0.22 0.17 0.36 0.25 0.23 0.47 0.45 0.33 Effect via SD 0.13 0.16 0.18 0.14 0.19 0.13 0.38 0.56 0.40 0.17 0.16 0.22 0.21 0.27 0.27 Total 0.77 0.82 0.79 0.75 0.80 0.58 0.62 0.70 0.57 0.82 0.99 0.78 0.85 0.89 0.90 SD
Effect on SW 0.21 0.22 0.31 0.19 0.24 0.18 0.60 0.79 0.61 0.38 0.35 0.41 0.30 0.36 0.39 Effect via NS 0.10 0.13 -0.02 0.12 0.14 -0.06 0.08 0.14 0.01 -0.09 -0.04 -0.10 0.29 0.33 0.16 Effect via SH 0.18 0.21 0.22 0.18 0.16 0.13 0.00 -0.06 0.00 0.13 0.27 0.18 0.12 0.12 0.21 Total 0.49 0.56 0.51 0.49 0.53 0.26 0.68 0.87 0.62 0.42 0.58 0.49 0.72 0.81 0.76 R² 0.94 0.95 0.92 0.98 0.99 0.96 0.93 1.00 0.93 0.97 1.03 0.95 0.97 0.99 0.94 pε 0.25 0.22 0.28 0.14 0.08 0.21 0.27 0.00 0.27 0.16 0.00 0.23 0.16 0.08 0.25 Det 0.44 0.31 0.52 0.30 0.19 0.40 0.51 0.41 0.53 0.46 0.21 0.52 0.25 0.18 0.21 Nc 6.82 10.48 5.43 10.9 18.22 7.79 5.53 7.15 5.37 6.43 16.54 5.34 11.36 13.75 14.68
The SH and SD traits exhibited direct effects on SW less than the residual effects in 22 analyses. Among the traits, SH was the one with least influence on production, followed by SD, showing the lesser importance of these traits in the
selection process. On the other hand, NS exhibited direct effect values greater than residual effects in all the
experi-ments, once more showing that NS is the main determinant of the variations in SW.
Individual selection of clones (mass selection) applied
in the initial stages of programs, in spite of being commonly practiced, has proven to be inefficient (Kimbeng and Cox
2003, Resende and Barbosa 2006) and the selection of
families followed by individual selection of clones is recom
-mended. Thus, the selection of the best families in sugarcane
may be performed as based on the number of stalks (NS), whose heritability based on mean values of families has been greater than the heritability with individual plants, as shown by Kimberg and Cox (2003), Barbosa et al. (2005) and Oliveira et al. (2008). In addition, its direct effect on SW
is of great magnitude. This practice may lead to a reduction
in time and costs in the evaluation and selection process
between and within families, increasing the efficiency of
this process in the initial phases of sugarcane breeding programs since indirect selection through less complex
traits with greater heritability and ease of measurement may result in greater genetic progress in relation to the use
of direct selection.
The results of path analysis obtained in the plant-cane and ratoon-cane stages show greater consistency with the use of genetic and phenotypic correlations, with phenotypic correlation being equivalent to genetic correlation only in
balanced experiments. The number of stalks trait is the main
determinant of alterations in the sugarcane weight trait.
ACKNOWLEDGMENTS
The authors thank the CNPq, CAPES and FAPEMIG for the financial support for research projects.
Table 5. Path analysis as of phenotypic (rf), genotypic (rg) and genetic (rgblup) correlation of the production components: number of stalks (NS), stalk
diameter (SD) and stalk height (SH) on sugarcane weight (SW) in the experiments of half-sib families in the ratoon-cane stage
Trait
Experiments
XI XII XIII XIV XV
rf rg rgblup rf rg rgblup rf rg rgblup rf rg rgblup rf rg rgblup
NS
Effect on SW 0.69 0.68 0.69 0.64 0.60 0.64 0.88 1.15 0.88 0.60 0.57 0.60 0.64 0.63 0.64 Effect via SH 0.10 0.12 0.10 -0.01 -0.05 -0.01 0.03 0.04 0.03 0.02 0.09 0.02 0.14 0.20 0.14 Effect via SD 0.05 0.06 0.05 0.10 0.19 0.10 -0.24 -0.38 -0.24 0.07 0.09 0.07 0.04 0.06 0.04 Total 0.84 0.86 0.84 0.73 0.74 0.73 0.66 0.81 0.66 0.71 0.74 0.71 0.82 0.89 0.82 SH
Effect on SW 0.38 0.41 0.38 0.33 0.34 0.33 0.35 0.50 0.35 0.30 0.30 0.30 0.30 0.31 0.30 Effect via NS 0.19 0.20 0.19 -0.02 -0.08 -0.02 0.07 0.09 0.07 0.15 0.17 0.15 0.31 0.41 0.31 Effect via SD 0.03 0.03 0.03 0.21 0.26 0.21 0.02 -0.04 0.02 0.15 0.17 0.15 0.08 0.08 0.08 Total 0.60 0.64 0.60 0.51 0.52 0.51 0.44 0.56 0.44 0.60 0.63 0.60 0.68 0.79 0.68 SD
Effect on SW 0.11 0.09 0.11 0.43 0.48 0.43 0.51 0.73 0.51 0.46 0.50 0.46 0.17 0.15 0.17 Effect via NS 0.30 0.44 0.30 0.15 0.23 0.15 -0.42 -0.59 -0.42 0.03 0.10 0.03 0.15 0.23 0.15 Effect via SH 0.11 0.14 0.11 0.16 0.18 0.16 0.02 -0.03 0.02 0.09 0.10 0.09 0.13 0.15 0.13 Total 0.52 0.68 0.52 0.74 0.90 0.74 0.10 0.12 0.10 0.60 0.70 0.60 0.45 0.53 0.45 R² 0.86 0.91 0.86 0.95 1.05 0.95 0.79 1.29 0.79 0.89 0.95 0.89 0.80 0.88 0.80 pε 0.36 0.28 0.36 0.20 0.00 0.20 0.45 0.00 0.45 0.32 0.20 0.32 0.44 0.33 0.44 Det 0.71 0.50 0.71 0.70 0.48 0.70 0.76 0.72 0.76 0.83 0.80 0.83 0.61 0.43 0.61 Nc 2.94 5.36 2.94 3.38 6.00 3.38 2.87 3.16 2.87 2.33 2.45 2.33 4.00 6.11 4.00
Consistência dos resultados da análise de trilha entre experimentos com
cana-de-açúcar
Resumo – O objetivo dessa pesquisa foi avaliar a consistência das análises de trilha em experimentos com cana-de-açúcar, a partir
de correlações genéticas, fenotípicas e genotípicas. Foram realizadas 44 análises visando quantificar os efeitos diretos e indiretos
da altura de colmos (AC), diâmetro de colmos (DC) e número de colmos (NC) sobre massa de cana (MC). O NC apresentou o maior efeito direto sobre MC em todas as análises com o uso de correlações genéticas e fenotípicas e em 12 análises com uso das cor-relações genotípicas. O DC apresentou efeito direto elevado sobre MC, superando NC em apenas um experimento, enquanto que AC apresentou menor efeito direto sobre MC na maioria dos experimentos. Os resultados apresentaram maior consistência com o uso de correlações genéticas e fenotípicas. Nos experimentos balanceados as correlações fenotípicas e genéticas apresentaram resultados equivalentes. O NC é o principal determinante das alterações na produção de cana.
Palavras-chave:Saccharum spp., correlações, melhoramento genético. REFERENCES
Atkin FC, Dieters MJ and Stringer JK (2009) Impact of depth of pedigree
and inclusion of historical data on the estimation of additive variance and breeding values in a sugarcane breeding program. Theoretical and Applied Genetics 119: 555-565.
Barbosa MHP, Resende MDV, Peternelli LA, Bressiani JA, Silveira LCI, Silva FL and Figueiredo ICR (2004) Use of REML/BLUP for the
selection of sugarcane families specialized in biomass production.
Crop Breeding and Applied Biotechnology 4: 218-226.
Barbosa MHP, Resende MDV, Bressiani JA, Silveira LCI and Peternelli LA (2005) Selection of sugarcane families and parents by Reml/Blup. Crop Breeding and Applied Biotechnology 5: 443-450.
Barbosa MHP and Silveira LCI (2012) Breeding and cultivar recommendations. In Santos F, Borém A and Caldas C (eds.) Sugarcane: bioenergy, sugar and ethanol: technology and prospects. MAPA/ACS: UFV/DEA, Brasília, p. 301-318.
Chang YS and Milligan SB (1992) Estimating the potential of sugarcane families to produce elite genotypes using univariate cross prediction
methods. Theoretical and Applied Genetics 84: 662-671.
Cheverud JM (1988) A comparison of genetic and phenotypic correlations. Evolution 42: 958-968.
Durel CE, Laurens F, Fouillet A and Lespinasse Y (1998) Utilization
of pedigree information to estimate genetic parameters from large unbalanced data sets in apple. Theoretical and Applied Genetics 96: 1077-1085.
Espósito DP, Peternelli LA, Paula TOM and Barbosa MHP (2012) Análise de trilha usando valores fenotípicos e genotípicos para componentes
do rendimento na seleção de famílias de cana-de-açúcar. Ciência Rural42: 38-44.
Falconer SD and Mackay TFC (1996) Introduction to quantitative genetics. Longman, Edinburgh, 464p.
Ferreira FM, Barros WS, Silva FL, Barbosa MHP, Cruz CD and Bastos
IT (2007) Relações fenotípicas e genotípicas entre componentes de
produção em cana-de-açúcar. Bragantia66: 605-610.
Kang MS, Miller JD and Tai PYP (1983) Genetic and phenotypic path analysis and heritability in sugarcane. Crop Science 23: 643-647.
Kimberg CA and Cox MC (2003) Early generation selection of sugarcane families and clones in Australia: a review. Journal of the American Society of Sugar Cane Technologists 23: 20-39.
Montgomery DC and Peck EA (1992) Introduction to linear regression analyses. John Wiley & Sons, New York, 527p.
Nunes AJR, Ramalho MAP and Ferreira DF (2008) Inclusion of genetic
relationship information in the pedigree selection method using mixed models. Genetics and Molecular Biology 31:73-78.
Oliveira RA, Daros E, Bespalhok-Filho JC, Zambon JLC, Ido OT, Weber H, Resende MDV and Zeni-Neto H (2008) Seleção de famílias de cana-de-açúcar via modelos mistos. Scientia Agraria9: 269-274. R Development Core Team (2012) R: a language and environment for
statistical computing. Available at <http://www.R-project.org/>
Accessed in April 2012.
Resende MDV (2002) Genética biométrica e estatística no melhoramento de plantas perenes. Embrapa Informação Tecnológica, Brasília, 975p.
Resende MDV and Barbosa MHP (2006) Selection via simulated
individual BLUP based on family genotypic effects in sugarcane. Pesquisa Agropecuária Brasileira 41: 421-429.
Resende MDV (2007) Selegen-Reml/Blup: sistema estatístico e seleção genética comutadorizada via modelos lineares mistos. Embrapa
Florestas, Colombo, 358p.
Silva FL, Pedrozo CA, Barbosa MHP, Resende MDV, Peternelli LA, Costa PMA and Vieira MS (2009) Análise de trilha para os componentes de produção de cana-de-açúcar via blup. Revista Ceres 56: 308-314. Silva PP, Soares L, Costa JG, Viana LS, Andrade JCF, Gonçalves ER,
Santos JM, Barbosa GVS, Nascimento VX, Todaro AR, Riffel A, Grossi-de-Sa MF, Barbosa MHP, Sant’Ana AEG and Ramalho Neto CE (2012) Path analysis for selection of drought tolerant sugarcane genotypes through physiological components. Industrial Crop and Products37: 11-19.
Sukhchain SD and Saini GS (1997) Inter-relationships among cane yield
and commercial cane sugar and their component traits in autumn plant crop of sugarcane. Euphytica95: 109-114.
Tyagi AP and Lal P (2007) Correlation and path coefficient analysis in