www.atmos-chem-phys.net/10/6195/2010/ doi:10.5194/acp-10-6195-2010
© Author(s) 2010. CC Attribution 3.0 License.
Chemistry
and Physics
Impact of Mexico City emissions on regional air quality from
MOZART-4 simulations
L. K. Emmons1, E. C. Apel1, J.-F. Lamarque1, P. G. Hess1,*, M. Avery2, D. Blake3, W. Brune4, T. Campos1, J. Crawford2, P. F. DeCarlo5,**, S. Hall1, B. Heikes6, J. Holloway7, J. L. Jimenez5, D. J. Knapp1, G. Kok8, M. Mena-Carrasco9,***, J. Olson2, D. O’Sullivan10, G. Sachse2, J. Walega1, P. Weibring1, A. Weinheimer1, and C. Wiedinmyer1
1National Center for Atmospheric Research, Boulder, CO, USA 2NASA Langley Research Center, Hampton, VA, USA
3Department of Chemistry, University of California, Irvine, CA, USA
4Department of Meteorology, Pennsylvania State University, University Park, PA, USA 5Department of Chemistry and Biochemistry, University of Colorado, Boulder, CO, USA 6Graduate School of Oceanography, University of Rhode Island, Narragansett, RI, USA
7NOAA, Earth System Research Laboratory, Boulder, CO, USA and Cooperative Institute for Research in Environmental
Science, University of Colorado, Boulder, CO, USA
8Droplet Measurement Technologies, Boulder, CO, USA 9University of Iowa, USA
10Chemistry Department, US Naval Academy, Annapolis, MD, USA
*now at: Department of Biological and Environmental Engineering, Cornell University, Ithaca, NY, USA **now at: Laboratory of Atmospheric Chemistry, Paul Scherrer Institut, Villigen, Switzerland
***now at: Universidad Andr´es Bello, Santiago, Chile, and Massachusetts Institute of Technology, Cambridge, MA, USA
Received: 12 January 2010 – Published in Atmos. Chem. Phys. Discuss.: 9 February 2010 Revised: 11 June 2010 – Accepted: 20 June 2010 – Published: 9 July 2010
Abstract. An extensive set of measurements was made in and around Mexico City as part of the MILAGRO (Mega-city Initiative: Local and Global Research Observations) ex-periments in March 2006. Simulations with the Model for Ozone and Related Chemical Tracers, version 4 (MOZART-4), a global chemical transport model, have been used to pro-vide a regional context for these observations and assist in their interpretation. These MOZART-4 simulations repro-duce the aircraft observations generally well, but some dif-ferences in the modeled volatile organic compounds (VOCs) from the observations result from incorrect VOC speciation assumed for the emission inventories. The different types of CO sources represented in the model have been “tagged” to quantify the contributions of regions outside Mexico, as well as the various emissions sectors within Mexico, to the regional air quality of Mexico. This analysis indicates open fires have some, but not a dominant, impact on the
atmo-Correspondence to:L. K. Emmons (emmons@ucar.edu)
spheric composition in the region around Mexico City when averaged over the month. However, considerable variation in the fire contribution (2–15% of total CO) is seen during the month. The transport and photochemical aging of Mexico City emissions were studied using tags of CO emissions for each day, showing that typically the air downwind of Mexico City was a combination of many ages. Ozone production in MOZART-4 is shown to agree well with the net production rates from box model calculations constrained by the MI-LAGRO aircraft measurements. Ozone production efficiency derived from the ratio of Oxto NOzis higher in MOZART-4
1 Introduction
The emissions from megacities are becoming an increas-ingly important influence on regional and global air qual-ity (e.g., Mayer et al., 2000). Mexico Cqual-ity is one exam-ple of a developing megacity, with a population approach-ing 20 million in a growapproach-ing urbanized area (Molina et al., 2007). While air quality has improved significantly in the past decade due to emissions control measures, pollution levels are still quite high in the Mexico City Metropolitan Area (MCMA) (de Foy et al., 2008). During March 2006 a large suite of measurements was made as part of the Mega-city Initiative: Local and Global Research Observations (MI-LAGRO) in and around Mexico City from the ground and aircraft. MILAGRO consisted of four field campaigns that focused on local (MCMA-2006 and DOE/MAX-Mex) and regional scales (NSF/MIRAGE-Mex and NASA/INTEX-B), providing a comprehensive view of the emissions and near-field chemistry within the MCMA, as well as the regional atmospheric composition. Details of the campaign measure-ments and field experiment designs are given in overview pa-pers for INTEX-B (Singh et al., 2009) and the Mexico-based experiments (Molina et al., 2010). An overview of the me-teorological conditions during MILAGRO is given by Fast et al. (2007). MILAGRO is the largest of a series of inter-national campaigns in and around Mexico City, which also includes IMADA-AVER in 1997 (Edgerton et al., 1999) and MCMA-2003 (Molina et al., 2007).
While urban air quality analyses are usually assisted by regional models, global chemical transport models are valu-able for providing a larger scale view of the regional impact. When global models are run at sufficiently high horizontal resolution they are also able to reproduce, and are valuable for the interpretation of, observations on a megacity to re-gional scale, as presented in this paper. Understanding the contributions of the various emissions sectors to the atmo-spheric composition in Mexico City is necessary for identi-fying control strategies for improving air quality. This work quantifies both the contributions from remote regions and within Mexico to the air over Mexico. Due to its impact on human health and crops, the sources of ozone are of partic-ular interest. In addition to evaluating a model’s ability to reproduce observed ozone contributions, the simulation of ozone precursors must also be accurate to properly under-stand ozone production. This work evaluates modeled ozone production in several ways.
After a brief description of the model and the setup for the simulations used here, comparisons between the model re-sults and the observations are presented. The rere-sults of model simulations with “tagged” CO tracers are used, in Sect. 4, to illustrate the contributions of various pollution sources to the Mexico region and, in Sect. 5, to determine the physical age of the pollutants emitted from Mexico City and surround-ing urban areas. After an evaluation of the modeled ozone
production rate in Sect. 6, the amount of ozone produced by Mexico City emissions is presented in Sect. 7, followed by the conclusions.
2 Model description
Model simulations for this study were performed with MOZART-4 (Model for Ozone and Related chemical Trac-ers, version 4), a global chemical transport model for the troposphere (Emmons et al., 2010). It was run with the standard chemical mechanism, which includes 97 species and approximately 200 reactions. Many volatile organic compounds (VOCs) are included explicitly (e.g., ethane, propane, formaldehyde, acetaldehyde, acetone, methanol, isoprene), but higher hydrocarbons are lumped. For example, the MOZART-4 species BIGALK represents C4and greater
alkanes and other higher-carbon VOCs with similar reactiv-ity and TOLUENE is a lumped aromatic (including toluene, benzene and xylenes). Photolysis rates were calculated using FTUV (Fast Tropospheric Ultraviolet and Visible radiation model), that takes into account the impact of the simulated clouds and aerosols, as described in Emmons et al. (2010).
2.1 Meteorology and resolution
For many studies using global chemical transport mod-els, such as those that address large-scale questions or in-clude multi-year analyses, the typical MOZART-4 horizon-tal resolution of 2.8◦×2.8◦(approximately 280 km) is
suffi-cient. However, for this analysis of the MILAGRO obser-vations and Mexico City pollution, MOZART-4 was run at 0.7◦×0.7◦ (70 km). Model simulations at 2.8◦×2.8◦
start-ing July 2005 were used to initialize the 0.7◦×0.7◦
simula-tions covering 1–31 March 2006. The simulasimula-tions presented here were run using the National Centers for Environmen-tal Prediction (NCEP) Global Forecast System (GFS) me-teorological fields (Kanamitsu et al., 1991), with 42 sigma levels in the vertical. A combination of analysis and fore-cast fields were used (00:00 UTC and 06:00 UTC analysis, 3-h forecast from 00:00 UTC, and 3-h through 15-h forecasts from 06:00 UTC), to provide meteorological inputs every 3 h to MOZART-4.
2.2 Emissions
C-130 Flights
-108 -104 -100 -96 -92 -88
-108 -104 -100 -96 -92 -88
16
18
20
22
24
26
28
30
32
16
18
20
22
24
26
28
30
32
DC-8 Flights
-108 -104 -100 -96 -92 -88
-108 -104 -100 -96 -92 -88
16
18
20
22
24
26
28
30
32
16
18
20
22
24
26
28
30
32
0 1 2 3 4 5 6 7 8 9 10 11 km
Fig. 1.Map of flights by the C-130 (4–29 March, 12 flights) and DC-8 (4–19 March, 6 flights), colored by pressure altitude above sea level.
the EDGAR Fast Track 2000 and EDGAR-2 databases, re-spectively (Olivier et al., 2005, 1999). For Asia, the 2006 in-ventory of Zhang et al. (2009) has been used. Aircraft emis-sions of NO, CO and SO2from scheduled, charter, general
aviation and military traffic for 1999 are also included, as described in Emmons et al. (2010). Biomass burning emis-sions are from the Global Fire Emisemis-sions Database, ver-sion 2 (GFED-v2) (van der Werf et al., 2006). For species not provided in GFED-v2, such as individual VOCs, SO2
and NH3, emissions are determined by scaling the
GFED-v2 CO2emissions, using the included vegetation
classifica-tion, by the emission factors of Andreae and Merlet (2001) and updates (Granier et al., 2004). Biogenic emissions of isoprene and monoterpenes are calculated online based on the Model of Emissions of Gases and Aerosols in Nature (MEGAN) (Guenther et al., 2006), as described in Emmons et al. (2010), with emission factors from MEGAN v2.0. Other natural emissions, NO from soil and lightning, and DMS from oceans, are included as in the standard MOZART-4 configuration (Emmons et al., 2010). Dust is not calcu-lated in MOZART-4, but included as a climatological av-erage distribution, as described in Emmons et al. (2010). The volcanoes circling Mexico City are an important source of SO2. SO2 emissions from continuously outgassing
vol-canoes from the GEIA-v1 inventory (Andres and Kasgnoc, 1998) are included in MOZART-4. These emissions include 1.32×10¹¹molecules/cm2/s in a 1◦ grid, resulting in total
emissions of 4.3 Gg-SO2 for March. Grutter et al. (2008)
report observations of 2.45±1.39 Gg/day of SO2 emitted
from the Popocat´epetl volcano averaged over March 2006 (76 Gg total for March). These results were published after the MOZART-4 simulations were completed, so are not in-cluded in these results.
For this study, the anthropogenic and biomass burning emissions for Mexico have been replaced with higher res-olution inventories. The anthropogenic emissions from the
Table 1.Emissions in Central Mexico (18–23◦N, 255–264◦E) for March 2006, and fraction of emissions from open fires, from the emissions inventories used in this study (see Sect. 2.1).
Species Emissions Fire fraction
(Gg) (%)
NO 53.9 16
CO 640.7 39
C2H6 8.7 19
C3H8 16.4 3
C2H4 6.3 50
C3H6 3.0 48
Lumped alkane (BIGALK) 138.0 1
Lumped alkene (BIGENE) 8.2 18
Lumped aromatic (TOLUENE) 30.7 10
Isoprene (ISOP) 194.3 0
Terpenes (C10H16) 13.7 0
CH2O 4.3 78
CH3CHO 5.9 64
CH3COCH3 5.6 77
MEK 4.0 86
CH3OH 38.9 82
C2H5OH 2.6 11
SO2 137.2 2
DMS 0.3 0
NH3 60.7 4
Black carbon (BC) 3.8 40
Organic carbon (OC) 40.8 53
Table 2.Measurements used in model evaluation.
Parameter Instrument name, technique PI, reference
C-130
O3 NCAR-NOxyO3, chemiluminescence Weinheimer (Walega et al., 1991)
NO, NO2, NOy NCAR-NOxyO3, chemiluminescence Weinheimer (Walega et al., 1991)
CO NCAR, vacuum UV resonance fluorescence Campos (Gerbig et al., 1999)
SO2 NOAA, pulsed UV fluorescence Holloway
CH2O NCAR DFG-TDL Fried, Weibring
OVOCs TOGA / Fast GC-MS Apel (Apel et al., 2010)
aerosol composition high-resolution AMS Jimenez (DeCarlo et al., 2006, 2008)
soot SP-2, single particle soot photometer Kok
DC-8
O3 NASA Langley FASTOZ, chemiluminescence Avery
CO DACOM, TDL Sachse (Sachse et al., 1987)
OH, HO2 ATHOS Brune
NMHCs UCI canister samples, GC-MS Blake
H2O2, CH3OOH URI, HPLC Heikes
photolysis rates Scanning Actinic Flux Spectroradiometer (SAFS) Shetter, Hall (Shetter and M¨uller, 1999)
TOGA: Trace Organic Gas Analyzer; OVOCS: (methanol, acetaldehyde and acetone) aerosol comp. (submicron): sulfate, nitrate, chloride, ammonium, organic aerosol.
more recent Mexico City inventories are more detailed, and presumably more accurate, Mexico City is represented by a single model grid box in our study, so were not included. NOx emissions are emitted as NO in MOZART-4 and the
partitioning between NO and NO2is calculated explicitly in
the chemistry. The emissions for VOCs are only available as lumped total VOCs, so speciation to the MOZART VOCs was based on ratios to CO in the POET inventory. The fire emissions for North America have been replaced by an in-ventory based on daily MODIS fire counts, following Wied-inmyer et al. (2006). Emissions for individual fires were cal-culated and then gridded to the simulation resolution. The to-tals for the emissions from Central Mexico (18–23◦N, 255– 264◦E) for March 2006 using these inventories are given in Table 1. This region is much larger than the MCMA and in-cludes the fires around the city that impact the regional air quality, along with a number of other major cities. The frac-tion of emissions from open fires averaged over the month is also given in Table 1.
3 Model evaluation
MILAGRO included many ground-based and airborne mea-surements, covering broad spatial and temporal scales. The aircraft measurements from the NSF/NCAR C-130 and the NASA DC-8 sampled both the Mexico City urban area and the surrounding region over Mexico and the Gulf of Mexico, particularly in the pollution outflow. Figure 1 shows the loca-tion and altitude of the flights used in the following analyses, including the 12 C-130 flights between 4 and 29 March, and
the 6 DC-8 flights between 4 and 19 March. Descriptions of the instrument payloads of the C-130 and DC-8 are given by Molina et al. (2010) and Singh et al. (2009). The measure-ments used in this work are listed in Table 2.
The C-130 and DC-8 measurements best match the scale of the MOZART-4 simulations and the scale of the analy-ses presented here. The DOE G-1 aircraft also provided a comprehensive suite of gas-phase and aerosol measurements (Molina et al., 2010), but as the flights were limited to the re-gion directly surrounding the Mexico City basin, only a few MOZART grid boxes were covered. Due to the large model grid size it is also not expected that the model would repro-duce the surface site observations very well.
Summaries of the comparisons between the MOZART-4 simulations for the MILAGRO period and the C-130 and DC-8 aircraft observations are shown in Figs. 2–5. MOZART-4 3-h average results have been interpolated to the time and lo-cation of the aircraft measurements. The measurements and model results for all flights have been binned into 0.5 km al-titude bins, and the median and quartiles are shown for each bin. Since Mexico City is at an elevation of 2.3 km above sea level (a.s.l.), these profiles show relatively high values for most species at 2–4 km due to the sampling focused di-rectly over the city and in its outflow. The C-130 was based in Veracruz, Mexico, and the DC-8 in Houston, Texas, so the measurements below 2 km are primarily within the vicinity of those cities.
0 20 40 60 80 100 O3 [ppbv] 0
1 2 3 4 5 6
Altitude [km]
Obs
MOZART
0 100 200 300
CO [ppbv] 0
1 2 3 4 5 6
Altitude [km]
0 500 1000 1500 2000 2500
NOx [pptv] 0
1 2 3 4 5 6
Altitude [km]
0 1 2 3 4 5 6
SO2 [ppbv]
0 1 2 3 4 5 6
Altitude [km]
0 2 4 6 8 10
CH3OH [ppbv]
0 1 2 3 4 5 6
Altitude [km]
0 1 2 3 4
CH2O [ppbv]
0 1 2 3 4 5 6
Altitude [km]
0.0 0.5 1.0 1.5
CH3CHO [ppbv]
0 1 2 3 4 5 6
Altitude [km]
0 1 2 3
CH3COCH3 [ppbv]
0 1 2 3 4 5 6
Altitude [km]
0 1 2 3 4 5
Sulfate [µg/m3]
0 1 2 3 4 5 6
Altitude [km]
0.0 0.5 1.0 1.5 2.0 2.5 3.0
Ammonium [µg/m3]
0 1 2 3 4 5 6
Altitude [km]
0 5 10 15 20
OA [µg/m3]
0 1 2 3 4 5 6
Altitude [km]
0.0 0.1 0.2 0.3 0.4 0.5
BC [µg/m3]
0 1 2 3 4 5 6
Altitude [km]
C-130 - within (18-23N, 105-96W)
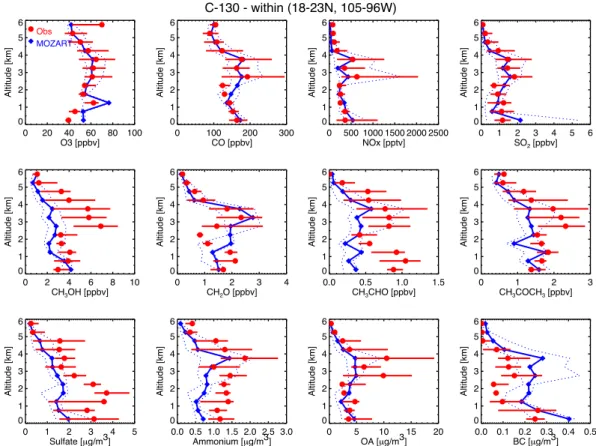
Fig. 2. Comparison of MOZART results to C-130 observations within the Central Mexico box shown in Fig. 1. Model results have been interpolated to flight tracks and then binned by pressure altitude. Symbols indicate the median, with error bars and dashed lines indicating the quartiles, of each 0.5-km bin.
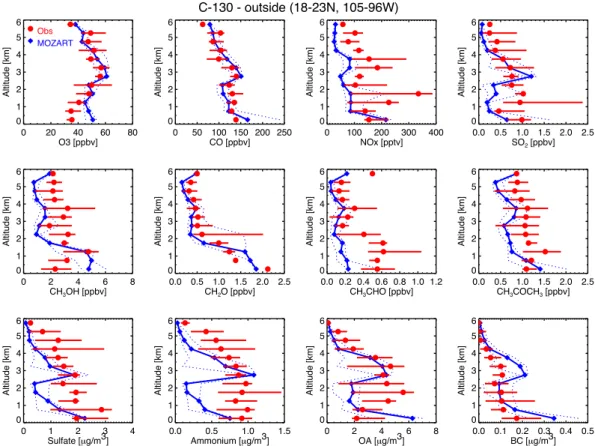
within the Central Mexico box than outside it. The simulated ozone values agree very well with observations from the C-130 and DC-8, as do several of the ozone precursors, such as CO and NOx(NO+NO2). The model substantially
under-estimates a number of the oxygenated VOCs (OVOCs), such as methanol, acetaldehyde and acetone, as shown in Figs. 2 and 3, most likely the result of too low emissions of these species or their precursors (discussed below). While the SO2
measurements are reproduced fairly well, sulfate aerosols are underestimated by the model, indicating possible model er-rors in the formation or loss of sulfate. However, it is likely that the SO2emissions are underestimated, with a
compen-sating error of the oxidation to sulfate being too slow. Much of the SO2emissions in Central Mexico are due to the
volca-noes and petrochemical complexes, and are likely underes-timated, as discussed above in Sect. 2.2. MOZART-4 simu-lates organic carbon aerosols (OC), so to compare to the ob-served organic aerosol (OA), they been scaled by an OA/OC ratio of 1.8 (Aiken et al., 2008) and then added to the mod-eled secondary organic aerosol (SOA). The vertical profile of the modeled OA agrees fairly well with the observations, but with some significant under-predictions at times. This is sur-prising given the very low SOA formation in MOZART-4. Along the C-130 flight legs, the simulated SOA
concentra-tions are on average about 3% of the total organic aerosol. The unrealistically low modeled SOA results are consistent with previous comparisons of MOZART-4 with observations (Dunlea et al., 2009), as well as many other models for Mex-ico City (Volkamer et al., 2006; Dzepina et al., 2009; Fast et al., 2009; Hodzic et al., 2009; Tsimpidi et al., 2009) and other areas (as summarized by Heald et al., 2005; Hallquist et al., 2009; de Gouw and Jimenez, 2009). Since total OA is well predicted despite the lack of a realistic SOA source, most likely another OA source is overestimated. Since urban primary OA is underpredicted by the Mexico City emissions inventory (Fast et al., 2009; Aiken et al., 2009), this sug-gests that fire emissions of OA may be too high in the model. Black carbon concentrations are slightly overestimated, con-sistent with the conclusion of Fast et al. (2009) that the fire emissions, and possibly also the anthropogenic, inventories are too high for black carbon.
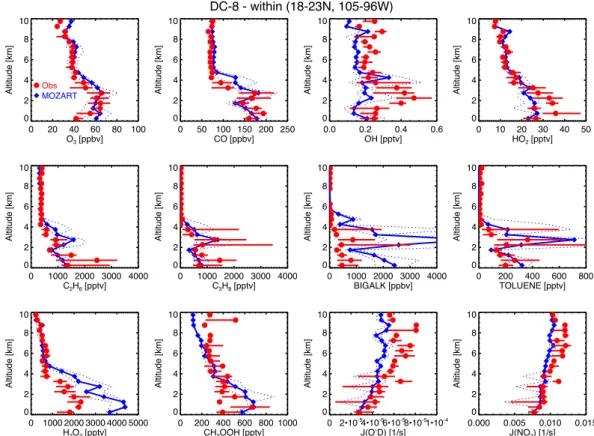
Since the DC-8 has greater vertical range than the C-130, the plots in Figs. 4 and 5 show a greater extent of the free troposphere. As for the C-130 comparisons, O3and CO are
reproduced well by the model, both within and outside the Central Mexico box. The model under-predicts the OH mea-surements, but matches HO2 quite well when compared to
0 20 40 60 80 O3 [ppbv] 0
1 2 3 4 5 6
Altitude [km]
Obs MOZART
0 50 100 150 200 250 CO [ppbv] 0
1 2 3 4 5 6
Altitude [km]
0 100 200 300 400 NOx [pptv] 0
1 2 3 4 5 6
Altitude [km]
0.0 0.5 1.0 1.5 2.0 2.5 SO2 [ppbv]
0 1 2 3 4 5 6
Altitude [km]
0 2 4 6 8
CH3OH [ppbv]
0 1 2 3 4 5 6
Altitude [km]
0.0 0.5 1.0 1.5 2.0 2.5 CH2O [ppbv]
0 1 2 3 4 5 6
Altitude [km]
0.0 0.2 0.4 0.6 0.8 1.0 1.2 CH3CHO [ppbv]
0 1 2 3 4 5 6
Altitude [km]
0.0 0.5 1.0 1.5 2.0 2.5 CH3COCH3 [ppbv]
0 1 2 3 4 5 6
Altitude [km]
0 1 2 3 4
Sulfate [µg/m3] 0
1 2 3 4 5 6
Altitude [km]
0.0 0.5 1.0 1.5 Ammonium [µg/m3] 0
1 2 3 4 5 6
Altitude [km]
0 2 4 6 8
OA [µg/m3] 0
1 2 3 4 5 6
Altitude [km]
0.0 0.1 0.2 0.3 0.4 0.5 BC [µg/m3] 0
1 2 3 4 5 6
Altitude [km]
C-130 - outside (18-23N, 105-96W)
Fig. 3.Comparison of MOZART results to C-130 observations outside of Central Mexico box, as Fig. 2.
observations (not shown) indicates MOZART-4 simulates OH well, but underestimates HO2. The difference between
the aircraft in model-measurement comparisons could be due to the different chemical regimes sampled by the two aircraft. Overall, the model slightly underestimates HOx. There are
significant emissions of propane in Mexico City due to preva-lent use of liquified petroleum gas (LPG), but the model pre-diction of propane roughly agrees with observations. The most substantial discrepancy in the nonmethane hydrocar-bons (NMHCs) is in the model over-prediction of the lumped alkane BIGALK, which is compared to the sum ofi- and
n-butane, i- and n-pentane, n-hexane and n-heptane. The lumped aromatic TOLUENE is compared to the sum of ben-zene, toluene, ethylbenzene and m-, p- and o-xylene, all measured by the UC-Irvine group. Errors in the VOC specia-tion of the emissions are likely the source of these errors. The model over-predicts H2O2 in the lower troposphere, while
CH3OOH is simulated well. The “observed” photolysis
fre-quencies of J(O1D)and J(NO2)are from calculations of the
Tropospheric Ultraviolet and Visible (TUV) radiation model (Madronich and Flocke, 1999) based on the actinic flux mea-surements. The MOZART-4 results slightly underestimate the observations, particularly at higher altitudes. One cause of this discrepancy could be in the representation of clouds in MOZART-4. While atmospheric water vapor and clouds are calculated in the model based on the surface water flux from
the driving meteorological fields, it is possible the simulated clouds are not accurate, and thus affect the photolysis.
0 20 40 60 80 100 O3 [ppbv] 0
2 4 6 8 10
Altitude [km] Obs
MOZART
0 50 100 150 200 250 CO [ppbv] 0
2 4 6 8 10
Altitude [km]
0.0 0.2 0.4 0.6
OH [pptv] 0
2 4 6 8 10
Altitude [km]
0 10 20 30 40 50
HO2 [pptv] 0
2 4 6 8 10
Altitude [km]
0 1000 2000 3000 4000 C2H6 [pptv] 0
2 4 6 8 10
Altitude [km]
0 1000 2000 3000 4000 C3H8 [pptv] 0
2 4 6 8 10
Altitude [km]
0 1000 2000 3000 4000 BIGALK [ppbv] 0
2 4 6 8 10
Altitude [km]
0 200 400 600 800 TOLUENE [pptv] 0
2 4 6 8 10
Altitude [km]
0 1000 2000 3000 4000 5000 H2O2 [pptv] 0
2 4 6 8 10
Altitude [km]
0 200 400 600 800 1000 CH3OOH [pptv] 0
2 4 6 8 10
Altitude [km]
0 2•10-54•10-56•10-58•10-51•10-4 J(O1D) [1/s]
0 2 4 6 8 10
Altitude [km]
0.000 0.005 0.010 0.015 J(NO2) [1/s] 0
2 4 6 8 10
Altitude [km]
DC-8 - within (18-23N, 105-96W)
Fig. 4.Comparison of MOZART results to DC-8 observations within Central Mexico box, as Fig. 2.
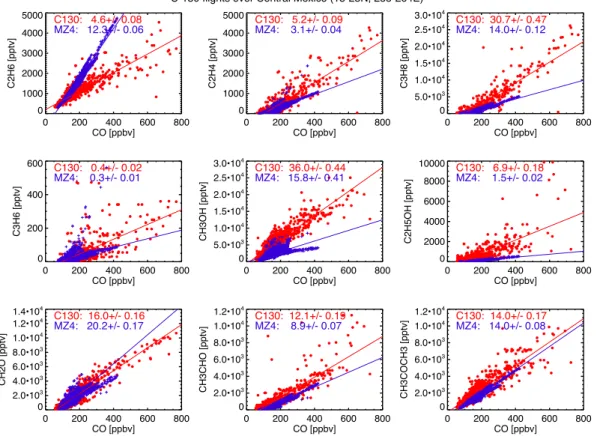
inventory significantly underestimates the vehicle emissions of CH3OH in Mexico City, as suggested by Velasco et al.
(2009), and consistent with the analysis of Apel et al. (2010). The correlations of several species show two dis-tinct branches in the MOZART-4 results, indicative of differ-ent emission factors for fire and traffic emissions, with some mixing between the two types of emissions. The scatter in the observations indicate that the sampled air was also a mix-ture of air influenced by fire and traffic (and other urban) emissions. Formaldehyde, acetaldehyde and acetone are all fairly well reproduced by the model, which may be a result of these species having substantial secondary sources (Apel et al., 2010; de Gouw et al., 2009) and therefore less influ-enced by underestimates of their direct emissions.
4 Impact of Mexico City emissions on CO distributions
Since CO is a good tracer of long-range pollution transport, having a lifetime of several weeks and is well-correlated with many other pollutants as shown in Fig. 6, it is a useful species to use to examine the impact of Mexico City on the regional atmosphere and the impact of other regions on Mexico. The different types and regions of CO sources have been “tagged” in the model by creating additional tracers, with each tracer having emissions from a single region or source type and loss rates equal to the loss rate total CO experiences. These
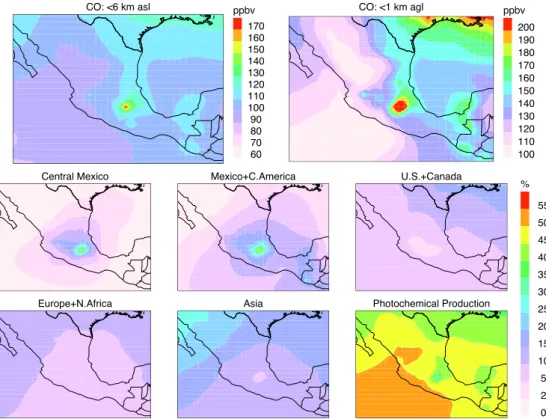
tracers can then be used to quantify the contributions from various sources at any given location. Figure 7 shows the March 2006 monthly mean column averages for CO mix-ing ratio and fractional contributions of the tagged CO. For each panel, the column is shown as the pressure-weighted average of the mixing ratio below 400 hPa (approximately 6 km a.s.l.), or, for the upper right panel, below 1 km altitude above the surface.
In the two plots of CO (top row of Fig. 7), the emissions from Mexico City and surrounding cities are clearly evident, but do not seem to have a strong influence beyond the borders of Mexico, due to the limited source strength of the MCMA in the larger regional context. However, under certain me-teorological conditions, it is possible for fairly concentrated plumes of pollution from Mexico City to be carried across the Gulf of Mexico and into the United States, as discussed below (Sect. 5). The prevailing winds from the west bring fairly clean air from the tropical Pacific over Mexico, dilut-ing the local pollution.
0 20 40 60 80 O3 [ppbv]
0 2 4 6 8 10
Altitude [km] ObsMOZART
0 50 100 150 200 250 CO [ppbv] 0
2 4 6 8 10
Altitude [km]
0.0 0.1 0.2 0.3 0.4 0.5 OH [pptv] 0
2 4 6 8 10
Altitude [km]
0 10 20 30 40
HO2 [pptv]
0 2 4 6 8 10
Altitude [km]
0 500 1000 1500 2000 2500 C2H6 [pptv]
0 2 4 6 8 10
Altitude [km]
0 200 400 600 800 1000 C3H8 [pptv]
0 2 4 6 8 10
Altitude [km]
0 500 1000 1500 2000 BIGALK [ppbv] 0
2 4 6 8 10
Altitude [km]
0 100 200 300 400 TOLUENE [pptv] 0
2 4 6 8 10
Altitude [km]
0 1000 2000 3000 4000 H2O2 [pptv]
0 2 4 6 8 10
Altitude [km]
0 200 400 600 800 1000 CH3OOH [pptv]
0 2 4 6 8 10
Altitude [km]
0 2•10-5
4•10-5
6•10-5
8•10-5
1•10-4
J(O1D) [1/s]
0 2 4 6 8 10
Altitude [km]
0.000 0.005 0.010 0.015 J(NO2) [1/s]
0 2 4 6 8 10
Altitude [km]
DC-8 - outside (18-23N, 105-96W)
Fig. 5.Comparison of MOZART results to DC-8 observations outside Central Mexico box, as Fig. 2.
most significant source in Mexico. During this month on av-erage, there was little impact of the US and Canada on Mex-ico, but 10% of the tropospheric CO was from Asia, with the contribution increasing to the north.
While urban CO concentrations are dominated by direct emissions, roughly half of the CO in the free troposphere is from secondary production, as shown in the bottom right panel of Fig. 7. Approximately half of this contribution is from the oxidation of CH4. Much of the CO from methane
is produced in the Tropics, where OH levels are high, and then transported to higher latitudes. In the region plotted, the highest fraction of secondary CO is over the relatively cleaner air over the Pacific. While the fraction is less over Mexico City and the US, significant secondary CO is pro-duced in those regions.
To track the influence of Mexico City emissions, CO from anthropogenic (primarily traffic) and open fire emis-sions were tagged separately. The monthly average anthro-pogenic and fire emissions of CO for the Central Mexico re-gion (as defined for this study) are mapped separately in the top panels of Fig. 8. This region includes emissions from the many large cities that ring Mexico City, including Cuer-navaca, Puebla, Toluca, and Pachuca. Many of these cities have less stringent pollution controls than Mexico City, thus their emissions are a significant contributor to the region. A significant portion of the open burning during March took
place in the hillsides surrounding Mexico City, so the emis-sions on the scale of the model grid overlap with the anthro-pogenic emissions. Averaged over the month, the fire emis-sions are about 40% of the total CO emisemis-sions over the Cen-tral Mexican Plateau (see Table 1). However, the open fire emissions are not as concentrated in the city as the anthro-pogenic sources (Crounse et al., 2009; Aiken et al., 2010) and have a substantially smaller contribution to the regional CO distribution (10–15 ppbv vs. 20–50 ppbv).
0 200 400 600 800 CO [ppbv]
0 1000 2000 3000 4000 5000
C2H6 [pptv]
C130: 4.6+/- 0.08
MZ4: 12.3+/- 0.06
0 200 400 600 800 CO [ppbv]
0 1000 2000 3000 4000 5000
C2H4 [pptv]
C130: 5.2+/- 0.09
MZ4: 3.1+/- 0.04
0 200 400 600 800 CO [ppbv]
0 5.0•103
1.0•104
1.5•104
2.0•104
2.5•104
3.0•104
C3H8 [pptv]
C130: 30.7+/- 0.47
MZ4: 14.0+/- 0.12
0 200 400 600 800 CO [ppbv]
0 200 400 600
C3H6 [pptv]
C130: 0.4+/- 0.02
MZ4: 0.3+/- 0.01
0 200 400 600 800 CO [ppbv]
0 5.0•103
1.0•104
1.5•104
2.0•104
2.5•104
3.0•104
CH3OH [pptv]
C130: 36.0+/- 0.44
MZ4: 15.8+/- 0.41
0 200 400 600 800 CO [ppbv]
0 2000 4000 6000 8000 10000
C2H5OH [pptv]
C130: 6.9+/- 0.18
MZ4: 1.5+/- 0.02
0 200 400 600 800 CO [ppbv]
0 2.0•103
4.0•103
6.0•103
8.0•103
1.0•104
1.2•104
1.4•104
CH2O [pptv]
C130: 16.0+/- 0.16
MZ4: 20.2+/- 0.17
0 200 400 600 800 CO [ppbv]
0 2.0•103
4.0•103
6.0•103
8.0•103
1.0•104
1.2•104
CH3CHO [pptv]
C130: 12.1+/- 0.19
MZ4: 8.9+/- 0.07
0 200 400 600 800 CO [ppbv]
0 2.0•103
4.0•103
6.0•103
8.0•103
1.0•104
1.2•104
CH3COCH3 [pptv]
C130: 14.0+/- 0.17
MZ4: 14.0+/- 0.08
C-130 flights over Central Mexico (18-23N, 255-264E)
Fig. 6. Correlations between VOCs and CO for MOZART (MZ4) results and C-130 observations for portions of all flights within Central Mexico (18–23◦N, 105–96◦W). The slope and its uncertainty from the linear regression of each VOC to CO is given.
“Mex-Anthro” and “Mex-Fires” the dashed lines show the contribution from the Central Mexico region as opposed to all of Mexico and Central America indicated by the colored area. It is clear the Mexico City fire contribution became a much smaller fraction of the Mexico and Central America fires after 20 March, but fires from outside Central Mexico (e.g., the Yucatan) had a considerable influence on the re-gion. Similar features are seen in the 0–2-km average, but with greater variability in the direct source contributions, as well as the NMHC oxidation contribution resulting from the urban and fire emissions. Around 10 March the contribution from fires in Central Mexico is about 12% of total CO, but drops to less than 5% after 20 March.
Several other studies have analyzed the MILAGRO observations to estimate the contribution of fires to the atmospheric composition around Mexico City. Yokelson et al. (2007) estimate 15% or 25%, depend-ing on the type of analysis, of the CO emitted from the Mexico City area is from fires. Crounse et al. (2009) estimate that one third of the CO is from fires over the larger scale, with a smaller contribution directly over Mexico City. The fraction of organic aerosol (OA) due to fires inside Mexico City is 15–20 % (Stone et al., 2008; Querol et al., 2008; Aiken et al., 2009, 2010). Both CO and OA have a substantially lower impact on the ground compared to
aloft (DeCarlo et al., 2008; Crounse et al., 2009). Karl et al. (2009) estimate 0–10% of the observed aromatic compound concentrations are from biomass burning. Another potential source of information about the relative contribution of anthropogenic and biomass burning emissions is from
14C isotopic ratio measurements, however interpretation
of the results is quite complex due to the contamination of wood by nuclear bomb radiocarbon and other enriched sources (Vay et al., 2009; Aiken et al., 2010). The fraction of fire emissions in the inventory used here (see Table 1) varies greatly among species, depending both on the fire emissions factors and on the magnitude of anthropogenic and natural emissions in this region. The fractions in the inventory calculated here are generally in the range of the observations-derived conclusions.
5 Age of Mexico City pollution
CO: <6 km asl
60 70 80 90 100 110 120 130 140 150 160 170
ppbv CO: <1 km agl
100 110 120 130 140 150 160 170 180 190 200 ppbv
Central Mexico Mexico+C.America U.S.+Canada
Europe+N.Africa Asia Photochemical Production
0 2 5 10 15 20 25 30 35 40 45 50 55 %
Fig. 7. Top, left: CO averaged for 1–31 March 2006 over the tropospheric column (surface to 6 km, or 400 hPa, a.s.l.); top right: same, averaged over the lowest km above the surface. Middle and bottom rows: fraction of tagged CO to total CO averaged over the tropospheric column.
CO Anthro Emissions
-110 -105 -100 -95 -90
15 20 25
30 CO Fire Emissions
-110 -105 -100 -95 -90
15 20 25 30
0 1.e-12 2.e-12 5.e-12 1.e-11 2.e-11 5.e-11 1.e-10 2.e-10 5.e-10 1.e-09 kg/m2/s
Central Mexico Anthro CO
-110 -105 -100 -95 -90
15 20 25
30 Central Mexico Fire CO
-110 -105 -100 -95 -90
15 20 25 30
0 5 10 15 20 25 30 35 40 45 ppbv
CO contributions over Central Mexico (0-6 km asl)
5 10 15 20 25 30
Day of March 2006 0
20 40 60 80 100
CO average column [ppbv]
NMHC oxid.
CH4 oxid. SH Europe+Africa Asia US+Canada Mex-Anthro Mex-Fires
CO contributions over Central Mexico (0-2 km agl)
5 10 15 20 25 30
Day of March 2006 0
50 100 150
CO average column [ppbv]
NMHC oxid.
CH4 oxid. SH Europe+Africa Asia US+Canada Mex-Anthro Mex-Fires
Fig. 9. Contributions of source regions to CO over Central Mex-ico region, 1–31 March 2006, for average columns, top: below 6 km a.s.l., bottom: below 2 km above the surface. Black line: total CO; light blue region is total chemical production, with dashed line separating methane and non-methane hydrocarbon oxidation terms; orange and red regions show contribution from anthropogenic and fire emissions, respectively, for all of Mexico and Central America, with dashed lines showing contribution from just Central Mexico. Difference between total CO and sum of tags is due to natural CO emissions from vegetation and the ocean.
of NOxto NOy(Kleinman et al., 2008) or the ratio of
hydro-carbons with different lifetimes, e.g., toluene/benzene (e.g., Warneke et al., 2007; Apel et al., 2010). The physical age of the airmass can be estimated from MOZART-4 results by tag-ging the CO emissions in and around Mexico City for each day. These tags have been used to assist in the interpreta-tion of data sampled by the C-130 flight on 8 March 2006 (DeCarlo et al., 2008).
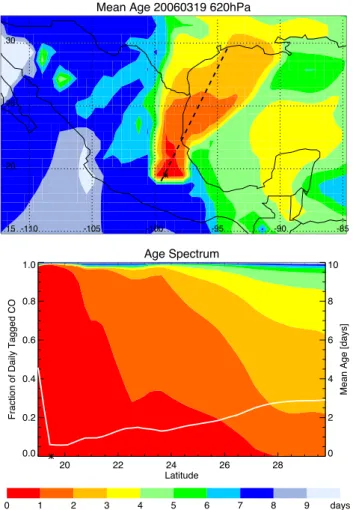
A particularly strong outflow event from Mexico City oc-curred on 19 March, producing a clear plume of pollution to the northeast of Mexico City that was sampled by the C-130 aircraft and reproduced well by MOZART-4. The top panel of Fig. 10 shows the mean age of Mexico City pollu-tion in this plume at the 620 hPa pressure level (≈4 km a.s.l.).
Mean Age 20060319 620hPa
-110 -105 -100 -95 -90 -85
15 20 25 30
Age Spectrum
20 22 24 26 28
Latitude 0.0
0.2 0.4 0.6 0.8 1.0
Fraction of Daily Tagged CO
0 2 4 6 8 10
Mean Age [days]
0 1 2 3 4 5 6 7 8 9 days
Fig. 10. Mean age (top) and age spectrum (bottom) of CO emitted from Mexico City on 19 March at 620 hPa (4 km), derived from the MOZART-4 tagged CO for each day. Bottom panel shows the contributions of each day’s Mexico City CO emissions along the dashed line in top panel, with the mean age plotted as the white line against the right axis. Asterisk in both panels indicates location of Mexico City.
A large region directly over Mexico City and stretching to the northeast is less than a day old. The plume has a mean age of 1–2 days along the Gulf coast of Northern Mexico and Southern Texas, and then 2–3 days as it reaches Louisiana. Just north of the Yucatan peninsula is a region containing 3-day-old Mexico City pollution that has circulated back south-ward. The high values of mean age shown over the western part of Mexico show the pollution does not frequently get transported to that region.
NOy 20060319 620hPa
-110 -105 -100 -95 -90 -85
15 20 25 30
0.0 0.2 0.4 0.6 0.8 1.0 1.2 1.4 1.6 1.8 ppbv
-ln(NOx/NOy) 20060319 620hPa
-110 -105 -100 -95 -90 -85
15 20 25 30
0.00 0.50 1.00 1.50 2.00 2.50 3.00 3.50 4.00 4.50
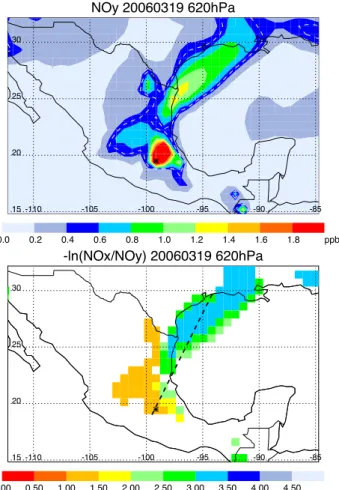
Fig. 11.NOydistribution (top) and photochemical age represented by−ln(NOx/NOy) (bottom) on 19 March at 620 hPa (4 km). As-terisk indicates location of Mexico City. White dashed line in top panel indicates 0.5 ppbv contour, which is the lower limit for values shown in bottom panel. Black dashed line from Fig. 7 is included for reference in bottom panel.
city with a mean age less than 1 day, the majority of the CO was emitted within 1 day. However, at higher latitudes where the plume mean age is gradually increasing from 1 to 3 days, there is an increasing contribution from pollution that is 3 to 6 days old. Thus, it is clear that a single mean age of an airmass may not be a useful parameter for the interpretation of its composition and thus the entire distribution should be considered for this purpose.
While estimation of the photochemical age using the ratio NOx/NOy is appropriate in some cases, it can also be
diffi-cult to interpret. Among the complications is the decomposi-tion of components of NOy, in particular PAN, back to NOx,
which result in an apparent “rejuvenation” of the NOyin the
airmass. Another major component of NOy, HNO3, can be
lost during transport due to washout, or to the uptake on dust (Querol et al., 2008; Zheng et al., 2008). In order to com-pare physical and photochemical ages, MOZART-4 results of NOxand NOyfor the 19 March plume have been used to
cal-DC-8
0.001 0.010 0.100 1.000 P-L(O3) [10
7 molec/cm3/s] 0
2 4 6 8 10
Altitude [km]
MOZART Box Model
24h Avg Instant.
C-130
0.001 0.010 0.100 1.000 P-L(O3) [10
7 molec/cm3/s] 0
2 4 6 8 10
Altitude [km]
MOZART Box Model
24h Avg Instant.
Fig. 12.Comparison of ozone net production rates from MOZART (in blue) and the NASA box model (in red), binned by altitude, for the DC-8 flights (left) and C-130 flights (right). Points indicate median values, red error bars and blue dashed lines indicate range of quartiles for box model and MOZART, respectively.
culate the photochemical age, –ln(NOx/NOy). These results
are shown in Fig. 11, with the NOydistribution (top panel)
clearly indicating strong outflow from Mexico City along the Northern Mexico and Texas Gulf coast. The NOx/NOy
ra-tio, however, does not show quite as clear a picture as the tagged CO. Values are plotted only for NOy mixing ratios
above 0.5 ppbv (indicated by the white dashed line in the top panel). The fresh emissions over Mexico City are apparent with –ln(NOx/NOy) values of less than 1. However, there is
also a large region in Central Mexico (NW of Mexico City) with photochemical age of 1–1.5 that corresponds to rela-tively low NOymixing ratios and 5–6 day physical ages (in
Fig. 10). This region of low photochemical ages could be a result of relatively fresh emissions from sources outside Mexico City, but is more likely a result of loss of NOydue to
washout or uptake on dust in fairly aged air.
6 Evaluation of ozone production
The ozone net production (production minus loss) rates from MOZART-4 are compared to box model calculations constrained by observations in Fig. 12. Results from the “constrained” version of the NASA Langley photochemi-cal box model (Olson et al., 2006) have been used for the comparisons here, where the calculations have been con-strained to the aircraft observations of NMHCs, acetone, MEK, methanol and ethanol, in addition to CO, NO, O3,
H2O, H2O2, CH3OOH, HNO3and PAN. The box model is
binned by altitude. The MOZART-4 ozone production rates have been interpolated to the DC-8 and C-130 flight tracks, and then binned by altitude. The MOZART-4 results are in-terpolated from 3-h average output. However, the MOZART-4 results are generally at or below the box model diurnal av-erage production rates. The coarse resolution of the model results in lower peak values of NOxand VOC concentrations
than observed, which in turn is likely one of the primary reasons for the underestimate of ozone production. Better agreement is seen for the DC-8 flights than the C-130, indica-tive that MOZART-4 reproduces the free troposphere well, where the majority of the DC-8 flights sampled and where the spatial gradients in NOx and VOCs change much more
slowly. The C-130 flights sampled the city air and urban out-flow with much greater frequency, a region where MOZART-4 had greater difficulty capturing the high concentrations due to the coarse model resolution.
The ozone production efficiency (OPE) of NOxis defined
as the total odd oxygen Ox (O3+NO2) produced per NOx
oxidized. It is typically inferred from the the correlation be-tween Ox and NOz (NOy–NOx). The OPE has been
deter-mined for several MILAGRO data sets (Shon et al., 2008; Wood et al., 2009; Nunnermacker et al., 2008). Analysis of the C-130 measurements by Shon et al. (2008) showed low OPE (4–5) for airmasses with fresh emissions from biomass burning and urban sources, while higher efficiencies (6–9) were seen in the free troposphere. Similar values were de-duced from the DOE G-1 aircraft observations (Nunnerma-cker et al., 2008). As shown in Sect. 5, the Mexico City region can be a complex mixture of airmasses with differ-ent photochemical ages and histories. This can make inter-pretation of the OPE difficult (Wood et al., 2009; Liang and Jacobson, 2000). However, as one measure of the model per-formance we compare the ozone production efficiency deter-mined from MOZART-4 results with that from the aircraft observations.
Figure 13 shows this correlation for the C-130 observa-tions and the MOZART-4 results interpolated to the C-130 flight tracks. Only the flights that included simultaneous measurements of O3, NOxand NOyare used, and only points
where NOyis between 2 and 6 ppbv are used, so as to filter
out fresh plumes and very aged air, and keep only moderately fresh airmasses. The OPE (1[Ox]/1[NOz]) inferred from
the C-130 measurements is 5.9±0.3, while for MOZART-4
it is 9.1±0.3. These plots show considerable scatter, but the degree of scatter is comparable for both the aircraft obser-vations and the model, i.e., in both cases there is a range of about 20 ppbv in Ox for a given value of NOz. It is
not surprising that the MOZART-4 OPE is slightly higher, as the large model grid will dilute urban emissions towards a regime where ozone production is larger (e.g., Shon et al., 2008).
Another key component of predicting ozone is the concen-tration of VOCs, and one way to evaluate this is through the comparison of OH reactivity determined from observations
C130 Measurements
0 2 4 6 8
NOz [ppbv] 20
40 60 80 100 120
Ox [ppbv]
Ox/NOz: 5.9+/-0.3
MOZART-4 on C130 tracks
0 2 4 6 8
NOz [ppbv] 20
40 60 80 100 120
Ox [ppbv]
Ox/NOz: 9.1+/-0.3
2 6 NOy
Fig. 13. Ozone production efficiency, Ox (O3+NO2) vs. NOz (NOy−NOx) from C-130 measurements (top) and MOZART re-sults (bottom), with points colored by NOy. The slope and its un-certainty from the linear regression of Oxto NOzis given.
OH reactivity along C-130 flight tracks
0 200 400 600 800
Distance from Mexico City [km] 0.0
0.2 0.4 0.6 0.8 1.0 1.2
OH reactivity [1/s]
NMHCs
OVOCs
Obs: solid
MZ4: lines
Fig. 14.OH reactivity calculated separately for NMHCs (blue) and OVOCs (red) from observations (solid fill) and MOZART (line fill) results along the C-130 flight tracks and binned by distance from Mexico City.
7 Ozone produced from Mexico City
The impact of Mexico City emissions is clearly evident in the monthly average of predicted tropospheric ozone shown in Fig. 15 (top panel). As was seen in the CO distribu-tions (Fig. 7), the air to the south and west of Mexico is relatively clean, while ozone average mixing ratios over the US are substantially higher. The amount of ozone produced from emissions in and around Mexico City can be quantified by “tagging” the NO emissions, as described by Lamarque et al. (2005) and Pfister et al. (2006, 2008b). The tagged NO (from the emissions shown in Fig. 8, top right panel) is traced through all the odd nitrogen species (e.g., PAN, HNO3,
or-ganic nitrates) to account for recycling of NOx. The
photol-ysis of NO2produces the tagged O3, which is destroyed at
the same rate as the full ozone. This tagging technique is ad-ditive: if each NOx source is tagged separately, the sum of
the resulting tagged O3is equal (within a few percent) to the
tagged O3from the total NOxemissions.
The bottom panel of Fig. 15 shows the monthly tropo-spheric column average of ozone produced from Mexico City region emissions. Directly over Mexico City, the average column is over 25 ppbv, almost half of the total ozone at that point (about 55 ppbv). However, the influence of Mexico City is quickly diluted as air gets transported primarily in the southwesterly and northeasterly direction. At the Texas-Mexico border, Texas-Mexico City ozone is less than 7 ppbv, or about 15% of the total ozone.
There was extensive evidence that emissions from open fires around the city had a strong influence on the regional air quality during MILAGRO, especially aloft and over larger spatial scales (Yokelson et al., 2007; Crounse et al., 2009; Karl et al., 2009). Based on the CO emissions inventories and model CO tags shown in Fig. 8, fires do not seem to be a dominant contribution to the CO distributions and the
frac-O3 Tropospheric Column - March
30 32 34 36 38 40 42 44 46 48 50 52 54 56 58 ppbv
O3 from Central Mexico
0 1 2 3 5 7 10 15 20 25 30 ppbv
Fig. 15.Tropospheric column (surface to 6 km a.s.l.) of total ozone (top) and ozone produced from the Central Mexico region emissions (bottom), averaged over March 2006. The dashed box shows the region of tagged emissions shown in Fig. 8.
tional contribution of the fires to NOxis smaller than for CO.
To quantify the impact of fires on the ozone distributions, the NO emissions from fires in the Mexico City metropolitan area have been tagged, and the results are shown in the right panels of Fig. 16, with the ozone from all Central Mexico sources in the left panels. On 20 March there was a shift in the weather patterns and a rainy period significantly reduced the fire activity around the city (Fast et al., 2007). There-fore, these two time periods have been averaged separately, shown in the top and bottom panels of Fig. 16, and clearly show lower ozone amounts during the second period. Before 20 March, the contribution of ozone from fires was 3–7 ppbv over a large region of Central Mexico, but was substantially reduced for the last 10 days of March, to 1–3 ppbv.
8 Conclusions
Central Mex O3 Mar 7-20 Central Mex Fire O3 Mar 7-20
0 1 2 3 5 7 10 15 20 25 30 ppbv
Central Mex O3 Mar 21-31 Central Mex Fire O3 Mar 21-31
0 1 2 3 5 7 10 15 20 25 30 ppbv
Fig. 16.Ozone from all Mexico City region emissions (left), and from open fires (right) in the Central Mexico region, before (top) and after (bottom) the rainy period. The dashed boxes show the region of tagged emissions.
Mexico during March 2006. Many of the discrepancies are likely due to errors in the emissions inventories, such as dis-crepancies in the speciation of VOCs, and the overestimation of black carbon from fires. The coarse horizontal resolution of the model compared to the small scale of the pollution and fire sources also contributes to model errors. The contri-bution of Mexico City pollution to the regional atmospheric composition was estimated for CO using tagged CO trac-ers. By tagging CO emissions in Mexico City for each day, a physical age of air, as well as the age spectrum, can be de-termined for any point in the region of Mexico. The age spec-tra show that the atmospheric composition around Mexico City is generally composed of air with a range of ages, there-fore the mean photochemical age may not be an appropriate representation of a given air parcel. Even in the strong plume of Mexico City pollution carried towards Texas on 19 March, a significant fraction of air older than 2 days was present in the plume. The ozone production rate in MOZART-4 shows generally good agreement with box model simulations that have been constrained by the aircraft observations. How-ever, the ozone production efficiency (correlation between Oxand NOz) determined from MOZART-4 results is
consid-erably higher than that inferred from observations, probably due primarily to the coarse model resolution diluting the NOx
concentrations. OH reactivity calculated from the MOZART-4 results somewhat overestimates the NMHC reactivity, but shows the same increasing importance of OVOCs downwind from the city, as shown by the observations. These results
highlight the need for understanding the chemical evolution of pollution outflow to properly assess the impact of megac-ities such as Mexico City on the regional atmospheric com-position.
By keeping track of the ozone produced from the NO emissions in the Central Mexico region, the contribution of Mexico City pollution on the regional tropospheric ozone column has been estimated. Directly over the city the contri-bution is about half, but drops quickly away from the city as the pollution is diluted by the clean tropical airmasses from the southwest of Mexico. The ozone produced by fires in Central Mexico is found to be a small contribution to the re-gional ozone.
Mexico City has a number of unique characteristics, such as its location in a basin surrounded by volcanoes and at high altitude, that make it difficult to generalize the findings of this study to other megacities. Cities in a more or less advanced state of development have very different relative source sec-tor contributions, resulting in very different contributions of ozone precursors (e.g., Butler et al., 2008). These differ-ences include the types of transportation, domestic heating and cooking, industry and power generation, all leading to unique mixes of NOx, CO and VOC emissions for each city.
Acknowledgements. The authors gratefully acknowledge all of the
based upon work supported by the National Aeronautics and Space Administration under Contract No. NNG06GB27G issued by the Tropospheric Chemistry Program. PFD and JLJ were supported by NSF ATM-0449815 and NOAA NA08OAR4310565. The National Center for Atmospheric Research is sponsored by the National Science Foundation.
Edited by: L. Molina
References
Andres, R. and Kasgnoc, A.: A time-averaged inventory of sub-aerial volcanic sulfur emissions, J. Geophys. Res., 103, 25251– 25261, 1998.
Aiken, A. C., DeCarlo, P. F., Kroll, J. H., Worsnop, D. R., Huff-man, J. A., Docherty, K. S., Ulbrich, I. M., Mohr, C., Kim-mel, J. R., Sueper, D., Sun, Y., Zhang, Q., Trimborn, A., North-way, M., Ziemann, P. J., Canagaratna, M. R., Onasch, T. B., Al-farra, M. R., Prevot, A. S. H., Dommen, J., Duplissy, J., Met-zger, A., Baltensperger, U., and Jimenez, J. L.: O/C and OM/OC ratios of primary, secondary, and ambient organic aerosols with high-resolution time-of-flight aerosol mass spectrometry, Envi-ron. Sci. Technol., 42, 4478–4485, 2008.
Aiken, A. C., Salcedo, D., Cubison, M. J., Huffman, J. A., DeCarlo, P. F., Ulbrich, I. M., Docherty, K. S., Sueper, D., Kimmel, J. R., Worsnop, D. R., Trimborn, A., Northway, M., Stone, E. A., Schauer, J. J., Volkamer, R. M., Fortner, E., de Foy, B., Wang, J., Laskin, A., Shutthanandan, V., Zheng, J., Zhang, R., Gaffney, J., Marley, N. A., Paredes-Miranda, G., Arnott, W. P., Molina, L. T., Sosa, G., and Jimenez, J. L.: Mexico City aerosol analysis during MILAGRO using high resolution aerosol mass spectrometry at the urban supersite (T0) – Part 1: Fine particle composition and organic source apportionment, Atmos. Chem. Phys., 9, 6633– 6653, doi:10.5194/acp-9-6633-2009, 2009.
Aiken, A. C., de Foy, B., Wiedinmyer, C., DeCarlo, P. F., Ul-brich, I. M., Wehrli, M. N., Szidat, S., Prevot, A. S. H., Noda, J., Wacker, L., Volkamer, R., Fortner, E., Wang, J., Laskin, A., Shutthanandan, V., Zheng, J., Zhang, R., Paredes-Miranda, G., Arnott, W. P., Molina, L. T., Sosa, G., Querol, X., and Jimenez, J. L.: Mexico city aerosol analysis during MILAGRO using high resolution aerosol mass spectrometry at the urban supersite (T0) – Part 2: Analysis of the biomass burning contribution and the non-fossil carbon fraction, Atmos. Chem. Phys., 10, 5315–5341, doi:10.5194/acp-10-5315-2010, 2010.
Andreae, M. and Merlet, P.: Emission of trace gases and aerosols from biomass burning, Global Biogeochem. Cycles, 15, 966– 995, 2001.
Apel, E. C., Emmons, L. K., Karl, T., Flocke, F., Hills, A. J., Madronich, S., Lee-Taylor, J., Fried, A., Weibring, P., Walega, J., Richter, D., Tie, X., Mauldin, L., Campos, T., Weinheimer, A., Knapp, D., Sive, B., Kleinman, L., Springston, S., Zaveri, R., Or-tega, J., Voss, P., Blake, D., Baker, A., Warneke, C., Welsh-Bon, D., de Gouw, J., Zheng, J., Zhang, R., Rudolph, J., Junkermann, W., and Riemer, D. D.: Chemical evolution of volatile organic compounds in the outflow of the Mexico City Metropolitan area, Atmos. Chem. Phys., 10, 2353–2375, doi:10.5194/acp-10-2353-2010, 2010.
Bond, T., Streets, D. G., Yarber, K. F., Nelson, S. M., Woo, J.-H., and Klimont, Z.: A technology-based global inventory of
black and organic carbon emissions from combustion, J. Geo-phys. Res., 109, D14203, doi:10.1029/2003JD003697, 2004. Butler, T.M., Lawrence, M.G., Gurjar, B.R., van Aardenne, J.,
Schultz, M. and Lelieveld, J.: The representation of emissions from megacities in global emission inventories, Atmos. Environ., 42, 703–719, 2008.
Crounse, J. D., DeCarlo, P. F., Blake, D. R., Emmons, L. K., Cam-pos, T. L., Apel, E. C., Clarke, A. D., Weinheimer, A. J., Mc-Cabe, D. C., Yokelson, R. J., Jimenez, J. L., and Wennberg, P. O.: Biomass burning and urban air pollution over the Cen-tral Mexican Plateau, Atmos. Chem. Phys., 9, 4929–4944, doi:10.5194/acp-9-4929-2009, 2009.
de Foy, B., Fast, J. D., Paech, S. J., Phillips, D., Walters, J. T., Coulter, R. L., Martin, T. J., Pekour, M. S., Shaw, W. J., Kasten-deuch, P. P., Marley, N. A., Retama, A., and Molina, L. T.: Basin-scale wind transport during the MILAGRO field campaign and comparison to climatology using cluster analysis, Atmos. Chem. Phys., 8, 1209–1224, doi:10.5194/acp-8-1209-2008, 2008. de Gouw, J. and Jimenez, J.: Organic Aerosols in the
Earths Atmosphere, Environ. Sci. Technol., 43, 7614–7618, doi:10.1021/es9006004, 2009.
de Gouw, J. A., Welsh-Bon, D., Warneke, C., Kuster, W. C., Alexan-der, L., Baker, A. K., Beyersdorf, A. J., Blake, D. R., Cana-garatna, M., Celada, A. T., Huey, L. G., Junkermann, W., Onasch, T. B., Salcido, A., Sjostedt, S. J., Sullivan, A. P., Tanner, D. J., Vargas, O., Weber, R. J., Worsnop, D. R., Yu, X. Y., and Zaveri, R.: Emission and chemistry of organic carbon in the gas and aerosol phase at a sub-urban site near Mexico City in March 2006 during the MILAGRO study, Atmos. Chem. Phys., 9, 3425–3442, doi:10.5194/acp-9-3425-2009, 2009.
DeCarlo, P., Kimmel, J., Trimborn, A., Northway, M., Jayne, J., Aiken, A., Gonin, M., Fuhrer, K., Horvath, T., Docherty, K., Worsnop, D., and Jimenez, J.: Field-deployable, high-resolution, time-of-flight aerosol mass spectrometer, Anal. Chem., 78, 8281–8289, 2006.
DeCarlo, P. F., Dunlea, E. J., Kimmel, J. R., Aiken, A. C., Sueper, D., Crounse, J., Wennberg, P. O., Emmons, L., Shinozuka, Y., Clarke, A., Zhou, J., Tomlinson, J., Collins, D. R., Knapp, D., Weinheimer, A. J., Montzka, D. D., Campos, T., and Jimenez, J. L.: Fast airborne aerosol size and chemistry measurements above Mexico City and Central Mexico during the MILAGRO campaign, Atmos. Chem. Phys., 8, 4027–4048, doi:10.5194/acp-8-4027-2008, 2008.
Dunlea, E. J., DeCarlo, P. F., Aiken, A. C., Kimmel, J. R., Peltier, R. E., Weber, R. J., Tomlinson, J., Collins, D. R., Shinozuka, Y., McNaughton, C. S., Howell, S. G., Clarke, A. D., Emmons, L. K., Apel, E. C., Pfister, G. G., van Donkelaar, A., Martin, R. V., Millet, D. B., Heald, C. L., and Jimenez, J. L.: Evolution of Asian aerosols during transpacific transport in INTEX-B, At-mos. Chem. Phys., 9, 7257–7287, doi:10.5194/acp-9-7257-2009, 2009.
Dzepina, K., Volkamer, R. M., Madronich, S., Tulet, P., Ulbrich, I. M., Zhang, Q., Cappa, C. D., Ziemann, P. J., and Jimenez, J. L.: Evaluation of recently-proposed secondary organic aerosol models for a case study in Mexico City, Atmos. Chem. Phys., 9, 5681–5709, doi:10.5194/acp-9-5681-2009, 2009.
Emmons, L. K., Walters, S., Hess, P. G., Lamarque, J.-F., Pfister, G. G., Fillmore, D., Granier, C., Guenther, A., Kinnison, D., Laepple, T., Orlando, J., Tie, X., Tyndall, G., Wiedinmyer, C., Baughcum, S. L., and Kloster, S.: Description and evaluation of the Model for Ozone and Related chemical Tracers, version 4 (MOZART-4), Geosci. Model Dev., 3, 43–67, 2010.
Fast, J., Aiken, A. C., Allan, J., Alexander, L., Campos, T., Cana-garatna, M. R., Chapman, E., DeCarlo, P. F., de Foy, B., Gaffney, J., de Gouw, J., Doran, J. C., Emmons, L., Hodzic, A., Hern-don, S. C., Huey, G., Jayne, J. T., Jimenez, J. L., Kleinman, L., Kuster, W., Marley, N., Russell, L., Ochoa, C., Onasch, T. B., Pekour, M., Song, C., Ulbrich, I. M., Warneke, C., Welsh-Bon, D., Wiedinmyer, C., Worsnop, D. R., Yu, X.-Y., and Zaveri, R.: Evaluating simulated primary anthropogenic and biomass burning organic aerosols during MILAGRO: implications for as-sessing treatments of secondary organic aerosols, Atmos. Chem. Phys., 9, 6191–6215, doi:10.5194/acp-9-6191-2009, 2009. Fast, J. D., de Foy, B., Acevedo Rosas, F., Caetano, E., Carmichael,
G., Emmons, L., McKenna, D., Mena, M., Skamarock, W., Tie, X., Coulter, R. L., Barnard, J. C., Wiedinmyer, C., and Madronich, S.: A meteorological overview of the MILA-GRO field campaigns, Atmos. Chem. Phys., 7, 2233–2257, doi:10.5194/acp-7-2233-2007, 2007.
Gerbig, C., Schmitgen, S., Kley, D., Volz-Thomas, A., Dewey, K., and Haaks, D.: An improved fast-response vacuum-UV reso-nance fluorescence CO instrument, J. Geophys. Res., 104, 1699– 1704, 1999.
Granier, C., Guenther, A., Lamarque, J., Mieville, A., Muller, J., Olivier, J., Orlando, J., Peters, J., Petron, G., Tyndall, G., and Wallens, S.: Present and future surface emissions of atmospheric compounds, European Commission report EVK 2199900011, http://www.aero.jussieu.fr/projet/ACCENT/POET.php, 2004. Grutter, M., Basaldud, R., Rivera, C., Harig, R., Junkerman, W.,
Caetano, E., and Delgado-Granados, H.: SO2 emissions from Popocat´epetl volcano: emission rates and plume imaging us-ing optical remote sensus-ing techniques, Atmos. Chem. Phys., 8, 6655–6663, doi:10.5194/acp-8-6655-2008, 2008.
Guenther, A., Karl, T., Harley, P., Wiedinmyer, C., Palmer, P. I., and Geron, C.: Estimates of global terrestrial isoprene emissions using MEGAN (Model of Emissions of Gases and Aerosols from Nature), Atmos. Chem. Phys., 6, 3181–3210, doi:10.5194/acp-6-3181-2006, 2006.
Hallquist, M., Wenger, J. C., Baltensperger, U., Rudich, Y., Simp-son, D., Claeys, M., Dommen, J., Donahue, N. M., George, C., Goldstein, A. H., Hamilton, J. F., Herrmann, H., Hoff-mann, T., Iinuma, Y., Jang, M., Jenkin, M. E., Jimenez, J. L., Kiendler-Scharr, A., Maenhaut, W., McFiggans, G., Mentel, Th. F., Monod, A., Pr´evˆot, A. S. H., Seinfeld, J. H., Surratt, J. D., Szmigielski, R., and Wildt, J.: The formation, properties and impact of secondary organic aerosol: current and emerging is-sues, Atmos. Chem. Phys., 9, 5155–5236, doi:10.5194/acp-9-5155-2009, 2009.
Heald, C. L., Jacob, D. J., Park, R. J., Russell, L. M., Hue-bert, B. J., Seinfeld, J. H., Liao, H., and Weber, R. J.: A large organic aerosol source in the free troposphere miss-ing from current models, Geophys. Res. Lett., 32, L18809, doi:10.1029/2005GL023831, 2005.
Hodzic, A., Jimenez, J. L., Madronich, S., Aiken, A. C., Bessag-net, B., Curci, G., Fast, J., Lamarque, J.-F., Onasch, T. B., Roux,
G., Schauer, J. J., Stone, E. A., and Ulbrich, I. M.: Modeling organic aerosols during MILAGRO: importance of biogenic sec-ondary organic aerosols, Atmos. Chem. Phys., 9, 6949–6981, doi:10.5194/acp-9-6949-2009, 2009.
Kanamitsu, M., Alpert, J., Campana, K., Caplan, P., Deaven, D., Iredell, M., Katz, B., Pan, H.-L., Sela, J., and White, G.: Recent changes implemented into the global forecast system at NMC, Weather Forecast., 6, 425–435, 1991.
Karl, T., Apel, E., Hodzic, A., Riemer, D. D., Blake, D. R., and Wiedinmyer, C.: Emissions of volatile organic compounds in-ferred from airborne flux measurements over a megacity, Atmos. Chem. Phys., 9, 271–285, doi:10.5194/acp-9-271-2009, 2009. Kleinman, L. I., Springston, S. R., Daum, P. H., Lee, Y.-N.,
Nun-nermacker, L. J., Senum, G. I., Wang, J., Weinstein-Lloyd, J., Alexander, M. L., Hubbe, J., Ortega, J., Canagaratna, M. R., and Jayne, J.: The time evolution of aerosol composition over the Mexico City plateau, Atmos. Chem. Phys., 8, 1559–1575, doi:10.5194/acp-8-1559-2008, 2008.
Lamarque, J.-F., Hess, P., Emmons, L., Buja, L., Washing-ton, W., and Granier, C.: Tropospheric ozone evolution be-tween 1890 and 1990, J. Geophys. Res., 110, D08304, doi:10.1029/2004JD005537, 2005.
Liang, J. and Jacobson, M. Z.: Effects of subgrid segregation on ozone production efficiency in a chemical model, Atmos. Envi-ron., 34, 2975–2982, 2000.
Madronich, S. and Flocke, S.: The role of solar radiation in atmo-spheric chemistry, in: Handbook of Environmental Chemistry, edited by: Boule, P., Springer, Heidelberg, 1–26, 1999.
Mayer, M., Wang, C., Webster, M., and Prinn, R. G.: Linking local air pollution to global chemistry and climate, J. Geophys. Res., 105, 22869–22896, 2000.
Molina, L. T., Kolb, C. E., de Foy, B., Lamb, B. K., Brune, W. H., Jimenez, J. L., Ramos-Villegas, R., Sarmiento, J., Paramo-Figueroa, V. H., Cardenas, B., Gutierrez-Avedoy, V., and Molina, M. J.: Air quality in North America’s most populous city – overview of the MCMA-2003 campaign, Atmos. Chem. Phys., 7, 2447–2473, doi:10.5194/acp-7-2447-2007, 2007.
Molina, L. T., Madronich, S., Gaffney, J. S., Apel, E., de Foy, B., Fast, J., Ferrare, R., Herndon, S., Jimenez, J. L., Lamb, B., Osornio-Vargas, A. R., Russell, P., Schauer, J. J., Stevens, P. S., and Zavala, M.: An overview of the MILAGRO 2006 campaign: Mexico City emissions and their transport and transformation, Atmos. Chem. Phys. Discuss., 10, 7819–7983, doi:10.5194/acpd-10-7819-2010, 2010.
Nunnermacker, L. J., Weinstein-Lloyd, J. B., Hillery, B., Giebel, B., Kleinman, L. I., Springston, S. R., Daum, P. H., Gaffney, J., Marley, N., and Huey, G.: Aircraft and ground-based mea-surements of hydroperoxides during the 2006 MILAGRO field campaign, Atmos. Chem. Phys., 8, 7619–7636, doi:10.5194/acp-8-7619-2008, 2008.
Olivier, J. and Berdowski, J.: Global emissions sources and sinks, in: The Climate System, edited by: Berdowski, J., Guicherit, R., and Heij, B. J., A.A. Balkema Publishers/Swets, Zeitlinger Pub-lishers, Lisse, The Netherlands, 33–78, 2001.
Olivier, J., Van Aardenne, J., Dentener, F., Ganzeveld, L., and Pe-ters, J.: Recent trends in global greenhouse gas emissions: re-gional trends and spatial distribution of key sources, in: Non-CO2Greenhouse Gases (NCGG-4), edited by: van Amstel, A. (coord.), Millpress, Rotterdam, 325–330, 2005.
Olson, J. R., Crawford, J. H., Chen, G., Brune, W. H., Faloona, I. C., Tan, D., Harder, H., and Martinez, M.: A reevaluation of air-borne HOxobservations from NASA field campaigns, J. Geo-phys. Res., 111, D10301, doi:10.1029/2005JD006617, 2006. Pfister, G. G., Emmons, L. K., Hess, P. G., Honrath, R. et al.: Ozone
production from the 2004 North American boreal fires, J. Geo-phys. Res., 111, D24S07, doi:10.1029/2006JD007695, 2006. Pfister, G. G., Emmons, L. K., Hess, P. G., Lamarque, J.-F.,
Thompson, A. M., and Yorks, J. E.: Analysis of the sum-mer 2004 ozone budget over the United States using Inter-continental Transport Experiment Ozonesonde Network Study (IONS) observations and Model of Ozone and Related Trac-ers (MOZART-4) simulations, J. Geophys. Res., 113, D23306, doi:10.1029/2008JD010190, 2008b.
Querol, X., Pey, J., Minguill´on, M. C., P´erez, N., Alastuey, A., Viana, M., Moreno, T., Bernab´e, R. M., Blanco, S., C´ardenas, B., Vega, E., Sosa, G., Escalona, S., Ruiz, H., and Art´ı˜nano, B.: PM speciation and sources in Mexico during the MILAGRO-2006 Campaign, Atmos. Chem. Phys., 8, 111–128, doi:10.5194/acp-8-111-2008, 2008.
Sachse, G. W., Hill, G. F., Wade, L. O., and Perry, M. G.: Fast-response, high-precision carbon monoxide sensor using a tunable diode laser absorption technique, J. Geophys. Res., 92, 2071– 2081, 1987.
Shetter, R. and M¨uller, M.: Photolysis frequency measurements us-ing actinic flux spectroradiometry durus-ing the PEM-Tropics mis-sion: instrumentation description and some results, J. Geophys. Res., 104, 5647–5661, 1999.
Shon, Z.-H., Madronich, S., Song, S.-K., Flocke, F. M., Knapp, D. J., Anderson, R. S., Shetter, R. E., Cantrell, C. A., Hall, S. R., and Tie, X.: Characteristics of the NO-NO2-O3system in different chemical regimes during the MIRAGE-Mex field campaign, At-mos. Chem. Phys., 8, 7153–7164, doi:10.5194/acp-8-7153-2008, 2008.
Singh, H. B., Brune, W. H., Crawford, J. H., Flocke, F., and Ja-cob, D. J.: Chemistry and transport of pollution over the Gulf of Mexico and the Pacific: spring 2006 INTEX-B campaign overview and first results, Atmos. Chem. Phys., 9, 2301–2318, doi:10.5194/acp-9-2301-2009, 2009.
Stone, E. A., Snyder, D. C., Sheesley, R. J., Sullivan, A. P., We-ber, R. J., and Schauer, J. J.: Source apportionment of fine or-ganic aerosol in Mexico City during the MILAGRO experiment 2006, Atmos. Chem. Phys., 8, 1249–1259, doi:10.5194/acp-8-1249-2008, 2008.
Tsimpidi, A. P., Karydis, V. A., Zavala, M., Lei, W., Molina, L., Ulbrich, I. M., Jimenez, J. L., and Pandis, S. N.: Evaluation of the volatility basis-set approach for the simulation of organic aerosol formation in the Mexico City metropolitan area, Atmos. Chem. Phys., 10, 525–546, doi:10.5194/acp-10-525-2010, 2010. van der Werf, G. R., Randerson, J. T., Giglio, L., Collatz, G. J.,
Kasibhatla, P. S., and Arellano Jr., A. F.: Interannual variabil-ity in global biomass burning emissions from 1997 to 2004, At-mos. Chem. Phys., 6, 3423–3441, doi:10.5194/acp-6-3423-2006, 2006.
Vay, S. A., Tyler, S. C., Choi, Y., Blake, D. R., Blake, N. J., Sachse, G. W., Diskin, G. S., and Singh, H. B.: Sources and transport of114C in CO2within the Mexico City Basin and vicinity, At-mos. Chem. Phys., 9, 4973–4985, doi:10.5194/acp-9-4973-2009, 2009.
Velasco, E., Lamb, B., Westberg, H., Allwine, E., Sosa, G., Arriaga-Colina, J. L., Jobson, B. T., Alexander, M. L., Prazeller, P., Knighton, W. B., Rogers, T. M., Grutter, M., Herndon, S. C., Kolb, C. E., Zavala, M., de Foy, B., Volkamer, R., Molina, L. T., and Molina, M. J.: Distribution, magnitudes, reactivities, ratios and diurnal patterns of volatile organic compounds in the Val-ley of Mexico during the MCMA 2002 & 2003 field campaigns, Atmos. Chem. Phys., 7, 329–353, doi:10.5194/acp-7-329-2007, 2007.
Velasco, E., Pressley, S., Grivicke, R., Allwine, E., Coons, T., Fos-ter, W., Jobson, B. T., Westberg, H., Ramos, R., Hern´andez, F., Molina, L. T., and Lamb, B.: Eddy covariance flux measure-ments of pollutant gases in urban Mexico City, Atmos. Chem. Phys., 9, 7325–7342, doi:10.5194/acp-9-7325-2009, 2009. Volkamer, R., Jimenez, J., San Martini, F., Dzepina, K.,
Zhang, Q., D. Salcedo, Molina, L., Worsnop, D., and Molina, M.: Secondary organic aerosol formation from anthropogenic air pol-lution: rapid and higher than expected, Geophys. Res. Lett., 33, L17811, doi:10.1029/2006GL026899, 2006.
Walega, J., Dye, J., Grahek, F., and Ridley, B.: A compact measure-ment system for the simultaneous determination of NO, NO2, NOy, and O3using a small aircraft, Proc. SPIE, 1443, 232–241, doi:10.1117/12.46167, 1991.
Warneke, C., McKeen, S., de Gouw, J., et al.: Determination of urban volatile organic compound emission ratios and compari-son with an emissions database, J. Geophys. Res., 112, D10S47, doi:10.1029/2006JD007930, 2007.
Wiedinmyer, C., Quayle, B., Geron, C., Belote, A., McKenzie, D., Zhang, X., O’Neill, S., and Wynne, K.: Estimating emissions from fires in North America for air quality modeling, Atmos. Environ., 40, 3419–3432, 2006.
Wood, E. C., Herndon, S. C., Onasch, T. B., Kroll, J. H., Cana-garatna, M. R., Kolb, C. E., Worsnop, D. R., Neuman, J. A., Seila, R., Zavala, M., and Knighton, W. B.: A case study of ozone production, nitrogen oxides, and the radical budget in Mexico City, Atmos. Chem. Phys., 9, 2499–2516, doi:10.5194/acp-9-2499-2009, 2009.
Yokelson, R. J., Urbanski, S. P., Atlas, E. L., Toohey, D. W., Al-varado, E. C., Crounse, J. D., Wennberg, P. O., Fisher, M. E., Wold, C. E., Campos, T. L., Adachi, K., Buseck, P. R., and Hao, W. M.: Emissions from forest fires near Mexico City, At-mos. Chem. Phys., 7, 5569–5584, doi:10.5194/acp-7-5569-2007, 2007.
Zhang, Q., Streets, D. G., Carmichael, G. R., He, K. B., Huo, H., Kannari, A., Klimont, Z., Park, I. S., Reddy, S., Fu, J. S., Chen, D., Duan, L., Lei, Y., Wang, L. T., and Yao, Z. L.: Asian emis-sions in 2006 for the NASA INTEX-B mission, Atmos. Chem. Phys., 9, 5131–5153, doi:10.5194/acp-9-5131-2009, 2009. Zheng, J., Zhang, R., Fortner, E. C., Volkamer, R. M., Molina, L.,