Additive Regulation of Adiponectin
Expression by the Mediterranean Diet Olive
Oil Components Oleic Acid and
Hydroxytyrosol in Human Adipocytes
Egeria Scoditti1, Marika Massaro1, Maria Annunziata Carluccio1, Mariangela Pellegrino2, Martin Wabitsch3, Nadia Calabriso1, Carlo Storelli2, Raffaele De Caterina4,5*
1National Research Council (CNR) Institute of Clinical Physiology, Lecce, Italy,2Department of Biological and Environmental Science and Technology (DISTEBA), University of Salento, Lecce, Italy,3Division of Pediatric Endocrinology, Diabetes and Obesity, Department of Pediatrics and Adolescent Medicine, University of Ulm, Ulm, Germany,4“G. d’Annunzio”University and Center of Excellence on Aging, Chieti, Italy,5“G. Monasterio”Foundation for Clinical Research, Pisa, Italy
Abstract
Adiponectin, an adipocyte-derived insulin-sensitizing and anti-inflammatory hormone, is suppressed in obesity through mechanisms involving chronic inflammation and oxidative stress. Olive oil consumption is associated with beneficial cardiometabolic actions, with possible contributions from the antioxidant phenol hydroxytyrosol (HT) and the monounsat-urated fatty acid oleic acid (OA, 18:1n-9cis), both possessing anti-inflammatory and vas-culo-protective properties. We determined the effects of HT and OA, alone and in
combination, on adiponectin expression in human and murine adipocytes under pro-inflam-matory conditions induced by the cytokine tumor necrosis factor(TNF)-α. We used human Simpson-Golabi-Behmel syndrome (SGBS) adipocytes and murine 3T3-L1 adipocytes as cell model systems, and pretreated them with 1-100μmol/L OA, 0.1-20μmol/L HT or OA plus HT combination before stimulation with 10 ng/mL TNF-α. OA or HT significantly (P<0.05) prevented TNF-α-induced suppression of total adiponectin secretion (by 42% compared with TNF-αalone) as well as mRNA levels (by 30% compared with TNF-αalone). HT and OA also prevented—by 35%—TNF-α-induced downregulation of peroxisome prolif-erator-activated receptor PPARγ. Co-treatment with HT and OA restored adiponectin and PPARγexpression in an additive manner compared with single treatments. Exploring the activation of JNK, which is crucial for both adiponectin and PPARγsuppression by TNF-α, we found that HT and OA additively attenuated TNF-α-stimulated JNK phosphorylation (up to 55% inhibition). In conclusion, the virgin olive oil components OA and HT, at nutritionally relevant concentrations, have additive effects in preventing adiponectin downregulation in inflamed adipocytes through an attenuation of JNK-mediated PPARγsuppression.
OPEN ACCESS
Citation:Scoditti E, Massaro M, Carluccio MA, Pellegrino M, Wabitsch M, Calabriso N, et al. (2015) Additive Regulation of Adiponectin Expression by the Mediterranean Diet Olive Oil Components Oleic Acid and Hydroxytyrosol in Human Adipocytes. PLoS ONE 10(6): e0128218. doi:10.1371/journal.pone.0128218
Academic Editor:Salvatore Papa, Institute of Hepatology - Birkbeck, University of London, UNITED KINGDOM
Received:February 22, 2015
Accepted:April 24, 2015
Published:June 1, 2015
Copyright:© 2015 Scoditti et al. This is an open access article distributed under the terms of the
Creative Commons Attribution License, which permits unrestricted use, distribution, and reproduction in any medium, provided the original author and source are credited.
Data Availability Statement:All relevant data are within the paper and its Supporting Information files.
Background
Obesity is associated with an increased risk for cardiometabolic complications, including type 2 diabetes (T2DM) and cardiovascular disease (CVD), two leading causes of morbidity and mortality [1,2]. Although pathophysiological mechanisms linking obesity to cardiometabolic disturbances are incompletely understood, compelling evidence suggests that obesity is charac-terized by an aberrant production of adipokines, among which tumor necrosis factor(TNF)-α, derived from both adipocytes and infiltrating macrophages, as well as by a state of tissue and systemic chronic, low-grade inflammation and increased oxidative stress, which likely play a key role in both T2DM and CVD [1,2].
Adiponectin is a major adipocyte-secreted adipokine, abundantly present in the circulation of healthy humans and mice and exerting anti-diabetic, anti-inflammatory and anti-atheroscle-rotic effects [3]. Unlike most other adipokines, local and circulating levels of adiponectin de-crease in obesity and related conditions, including insulin resistance, T2DM, endothelial dysfunction, hypertension, and atherosclerosis, all contributing to CVD in general and coro-nary heart disease in particular [3]. Genetic variations associated with low plasma adiponectin levels predispose to insulin resistance and CVD, and increased circulating adiponectin—by
ei-ther genetic or pharmacological approaches—has been shown to ameliorate insulin sensitivity
in the liver and the skeletal muscle, as well as glucose tolerance [3]. Therefore, pharmacological and/or dietary strategies able to restore adiponectin expression and secretion by improving in-flammation-associated adipocyte dysfunction might beneficially impact several obesity-related metabolic and cardiovascular complications. Interestingly, in addition to adiponectin alone, the related leptin to adiponectin ratio has been recently emerged as a reliable and clinically use-ful marker of cardiometabolic risk, as well as a valuable indicator of the effectiveness of anti-di-abetic therapy [4].
Over the past several years, Mediterranean diets rich in virgin olive oil have received much attention for health benefits, including a lower morbidity and mortality from CVD [5], and a lower incidence of obesity and of the metabolic syndrome [6] compared with other patterns of food intake. Mediterranean dietary patterns have been positively and independently associated with total adiponectin plasma levels in diabetic [7], obese women [8], in patients at high CV risk [9] as well as in healthy populations [10]. These beneficial effects may be at least partially ascribed to the consumption of virgin olive oil, a functional food rich in antioxidants, includ-ing the ortho-diphenolic compound hydroxytyrosol (2-[3,4-dihydroxyphenil]-ethanol, HT) as a main component, and characterized by a favorable fatty acid (FA) profile, with a high con-tent of the monounsaturated fatty acid (MUFA) oleic acid (OA, 18:1n-9,cis) [11]. HT has po-tent anti-inflammatory, anti-thrombotic, and anti-atherogenic properties, improving
endothelial dysfunction, haemostatic and lipid profiles, and decreasing oxidative stress and in-flammatory cell activation [12–15]. Recently, beneficial HT effects against hyperglycemia,
in-sulin resistance and the metabolic syndrome have been reported [16,17]. On the other hand, also OA or OA-rich diets have been reported to exert a number of anti-inflammatory and vas-culo-protective activitiesin vitroandin vivoand to provide improvements in insulin resistance and T2DM [18].
We therefore hypothesized that HT and OA, alone and possibly in concert, might improve adipocyte dysfunction by stimulating adiponectin expression as an additional mechanism for their beneficial metabolic and anti-inflammatory action. We here therefore evaluated the ef-fects of HT and OA on the TNF-α-induced downregulation of adiponectin expression in adi-pocytes, and explored underlying mechanisms.
Materials and Methods
Materials
HT (98% purity), the peroxisome proliferator-activated receptor (PPAR)γagonist rosiglita-zone (RSG), and the PPARγantagonist GW9662 were obtained from Cayman Chemicals (Ann Arbor, MI, USA). Recombinant human insulin was from Roche Diagnostics (Mannheim, Ger-many). All other chemicals, including sodium OA and TNF-α, were obtained from Sigma Al-drich (St. Louis, MO, USA), unless otherwise indicated. OA was conjugated with fatty acid-free bovine serum albumin at a 4:1 molar ratio.
Cell cultures and treatments
In the current study, as human adipose tissue material with potential to differentiate is limited, we used human Simpson-Golabi-Behmel syndrome (SGBS) preadipocytes, a physiologically relevant cell model system resembling human adipose tissue [19]. These, originally derived from the stromal fraction of subcutaneous adipose tissue of an infant with the Simpson-Golabi-Behmel syndrome, were a generous gift of Prof. Martin Wabitsch (Division of Pediatric Endocrinology, Diabetes and Obesity, Department of Pediatrics and Adolescent Medicine, University of Ulm, Ulm, Germany, among the study co-authors). SGBS cells are characterized by a high capacity for adipogenic differentiation over many generations, and functionally be-have like human primary adipocytes [19]. SGBS preadipocytes were cultured and differentiated into mature adipocytes as previously described [19]. Briefly, SGBS cells were maintained in Dulbecco's Modified Eagle Medium (DMEM)/F12 containing 10% fetal bovine serum (FBS) and 1% penicillin/streptomycin, 33μmol/L biotin and 17μmol/L pantothenate. For experi-mental purposes, cells were plated and allowed to reach confluence before the addition of serum-free differentiation medium [Dulbecco's Modified Eagle Medium: Nutrient Mixture F-12 (DMEM/FF-12) with 25 nmol/L dexamethasone, 250μmol/L 3-isobutyl-1-methylxanthine, 2μmol/L RSG, 0.01 mg/mL human transferrin, 20 nmol/L insulin, 100 nmol/L cortisol, 0.2 nmol/L triiodothyronine, 33μmol/L biotin, and 17μmol/L pantothenate] for 4 days. Cell medi-um was then changed to an adipogenic medimedi-um (DMEM/F12 with 0.01 mg/mL hmedi-uman trans-ferrin, 20 nmol/L insulin, 100 nmol/L cortisol, 0.2 nmol/L triiodothyronine, biotin, and pantothenate) for further 10 days. On day 15,>90% of these cells undergo complete
differenti-ation into mature adipocytes, as assessed using Oil Red-O lipid staining and the expression of adipocyte-specific mRNAs, such as lipoprotein lipase, adipocyte fatty acid binding protein (FABP4), peroxisome proliferator-activated receptor(PPAR)-γ, and the glucose transporter GLUT-4.
We also used 3T3-L1 mouse embryo fibroblasts as an additional model system of fat cells. These were obtained from American Type Culture Collection (ATCC) (Manassas, VA, USA) and cultured in DMEM containing 10% bovine calf serum until confluent. Two days after con-fluence (day 0), cells were stimulated to differentiate into adipocytes with DMEM containing 10% FBS, 1μg/mL insulin, 1μmol/L dexamethasone, and 0.5 mmol/L 3-isobutyl-1-methylxan-thine for 2 days. Cells were then maintained in 10% FBS/DMEM medium with 1μg/mL insulin for additional 2 days, followed by culturing with 10% FBS/DMEM medium until the analysis. Preliminary studies showed that 10 days after induction of differentiation,>90% of cells
dis-played the characteristic lipid-filled adipocyte phenotype.
dose- and time-course study, showing maximal reduction of both adiponectin protein and mRNA levels after 10 ng/mL TNF-αfor 24 h, in the absence of any effect on cell viability (data not shown). For HT and OA treatments, SGBS cells or 3T3-L1 adipocytes were incubated with 1–100μmol/L OA for 48 h or with 0.1–20μmol/L HT for 1 h, alone or in combination, before
stimulation with 10 ng/mL TNF-α. Our preliminary analysis of the fatty acid composition of cellular total lipids revealed that 48-h cell pretreatment with OA was associated with an in-crease in the amount of OA compared with untreated control (data not shown). A pretreat-ment time of 1 h was chosen for HT in consideration of the pharmacokinetics of plasma HT after virgin olive oil intake, with a time to reach the peak concentration of 1 h and an elimina-tion half-life of 2–3 h [20]. In some experiments, mitogen-activated protein kinase (MAPK)
in-hibitors were added 1 h before TNF-α.
Cell viability
Cell viability was determined by the 3-(4,5-dimethylthiazol-2-yl)-2,5-diphenyl tetrazolium bromide (MTT) assay, a commonly used method to evaluate cell survival, based on the ability of viable cells to convert MTT, a soluble tetrazolium salt, into an insoluble formazan precipi-tate, which is quantitated spectrophotometrically. Briefly, after the pertinent treatment, cells were incubated with MTT (0.5 mg/mL) for 4 h, and the formazan products were then dissolved by isopropanol. Absorbance was measured at 490 nm on a microplate reader.
Measurement of total adiponectin in culture media
Media were collected 24 h after TNF-αtreatment, centrifuged for 5 min, and stored at -20°C until analysis. Levels of adiponectin in the culture medium were determined using a Quanti-kine Human or Mouse Adiponectin/Acrp 30 ELISA kit (R&D Systems, Minneapolis, MN, USA) according to the manufacturer’s instructions. Adiponectin concentration was calculated
from the standard curve, normalized to total protein content, and expressed as percent of unstimulated control.
Measurement of leptin in culture media
Levels of leptin in the culture medium were determined using a Quantikine Human Leptin ELISA Kit (R&D Systems) according to the manufacturer’s instructions. Leptin concentration
was calculated from the standard curve, normalized to total protein content, and expressed as percent of unstimulated control.
Immunocytochemistry
3T3-L1 adipocytes grown in 24-well plates on coverslips (Thermanox, ProSciTech, Thurin-gowa, Queensland, Australia) were pretreated with HT or OA before TNF-αstimulation for 24 h. The specimens were fixed with cold acetone and then incubated overnight with a rabbit polyclonal antibody against adiponectin (Millipore, Billerica, MA, USA). After 3 washes with PBS, the specimens were incubated for 1 h with a biotinylated anti-rabbit IgG antibody (Santa Cruz Biotechnology, Santa Cruz, CA, USA) and for 1 h with extravidin peroxidase (Sigma). After the incubation with diaminobenzidine (Sigma) for 30 min, coverslips with the stained cells were mounted and photographed (x40 magnification).
Cell lysis and Western blotting
mmol/L ethylenediaminetetraacetic acid (EDTA), 1% Triton-X100, 10% glycerol, 1 mmol/L diethyldithiocarbamate, 1 mmol/L phenylmethylsulfonyl fluoride, 1 mg/mL aprotinin, 1 mg/ mL leupeptin). Lysates were incubated on ice for 30 min, and then centrifuged at 10,000 × g for 20 min at 4°C. Equal amounts of cell protein samples (20μg) were separated using NuPAGE Bis-Tris precast 10% polyacrylamide gels under reducing condition (Invitrogen, Carlsbad, CA, USA). Resolved proteins were transferred onto nitrocellulose sheets (Amersham, Freiburg, Germany), and the resulting membranes were saturated with 5% blocking agent (Amersham) in Tris-buffered saline (TBS, 20 mmol/L Tris, pH 7.6, 132 mmol/L NaCl)/0.1% Tween 20 for 1 h at room temperature. Blots were then incubated overnight at 4°C with primary antibodies against adiponectin (Millipore), PPARγ, c-Jun N-terminal kinase (JNK)1, JNK2, phospho-JNK (pJNK) (Thr183/Tyr185) (Santa Cruz), total JNK (Millipore), andβ-actin (Sigma), followed by a horseradish peroxidase-conjugated secondary antibody (Santa Cruz). An enhanced chemilu-minescence (ECL) kit (Amersham) was used to reveal positive bands, according to manufactur-er’s instructions. Bands were analyzed quantitatively using the Scion Image Alpha 4.0.3.2
software (Scion Corporation) and normalized toβ-actin levels.
RNA isolation and real-time quantitative polymerase chain reaction
Total RNA was isolated by using the TRIzol reagent (Invitrogen) according to the manufactur-er’s protocol. For real-time quantitative polymerase chain reaction (qPCR), total RNA (2μg) was converted into first-strand cDNA by using the High Capacity cDNA Reverse Transcription Kit (Applied Biosystems, Monza, Italy). The qPCR was performed in an Applied Biosystems 7500 FAST Real Time PCR System by using Taqman Gene Expression Assays for adiponectin, PPARγ, JNK1 and JNK2. All reactions were done in triplicate, and the amount of mRNA was calculated by the comparative critical threshold (CT) method. To account for possiblevaria-tions related to cDNA input or the presence of PCR inhibitors, the endogenous reference gene ribosomal 18 S was simultaneously quantified for each sample, and the data normalized ac-cordingly. Results are expressed as fold increase relative to unstimulated control (= 1).
Preparation of nuclear extracts and measurement of PPAR
γ
DNA
binding activity
Cells were rinsed with ice-cold PBS containing phosphatase inhibitors (pH 7.4), scraped, and collected by centrifugation at 300 × g for 5 min at 4°C. The pellet was then incubated for 30 min in ice-cold hypotonic buffer (20 mmol/L HEPES, 5 mmol/L NaF, 10μmol/L Na2MoO4,
0.1 mmol/L EDTA, 0.5% Nonidet P-40; pH 7.5) and centrifuged at 8000 ×g for 5 min at 4°C. The nuclear pellet was resuspended in ice-cold lysis buffer (20 mmol/L HEPES pH 7.5, 0.35 mol/L NaCl, 20% glycerol, 1% Nonidet P-40, 1 mmol/L MgCl2•6H2O, 0.5 mmol/L EDTA, 0.1
mmol/L ethylene glycol tetraacetic acid (EGTA), 5 mmol/L dithiothreitol (DTT)) containing a protease inhibitor cocktail (Sigma). After 30 min of incubation at 4°C, the lysate was centri-fuged for 10 min at 15,000 × g and the supernatant stored at -80°C. For measurement of PPARγDNA binding activity, a Transcription Factor Assay ELISA kit (Cayman Chemicals, Ann Arbor, MI, USA) was used according to the manufacturer’s instruction. Briefly, nuclear
Targeting silencing of JNK by small interfering RNA
Validated small interfering RNAs (siRNA) against JNK1 or JNK2 and a scrambled negative control siRNA were obtained from Qiagen (Milan, Italy). Two different siRNA sequences were used for targeted silencing of each JNK isoform. SGBS cells were transfected with 45 nmol/L control siRNA, JNK1 and/or JNK2 siRNA using the Lipofectamine RNAi/MAX reagent (Invi-trogen) according to the manufacturer’s instructions. Knockdown of JNK mRNA and protein
was assessed after 72 h post-transfection by qPCR using Taqman gene expression assays for JNK1 and JNK2, and by Western blotting using antibodies against JNK1 and JNK2. After 72 h of transfection, the medium was changed, and cells were stimulated with or without 10 ng/mL TNF-αfor 24 h. Adiponectin release in the culture medium and intracellular protein levels were measured by ELISA and Western analysis, respectively, while adiponectin mRNA levels were determined by qPCR.
Statistical analysis
Results are expressed as means ± SD of at least 3 independent experiments performed in tripli-cate. We used the Student’s t test for comparing means between control group and
compound-treated group. We performed multiple comparisons by one-way analysis of variance (ANOVA). Aplevel<0.05 was considered statistically significant.
Results
HT and OA additively attenuate TNF-
α
-mediated decrease in
adiponectin expression in adipocytes
We studied the effects of HT (0.1–20μmol/L) and OA (1–100μmol/L) separately on total
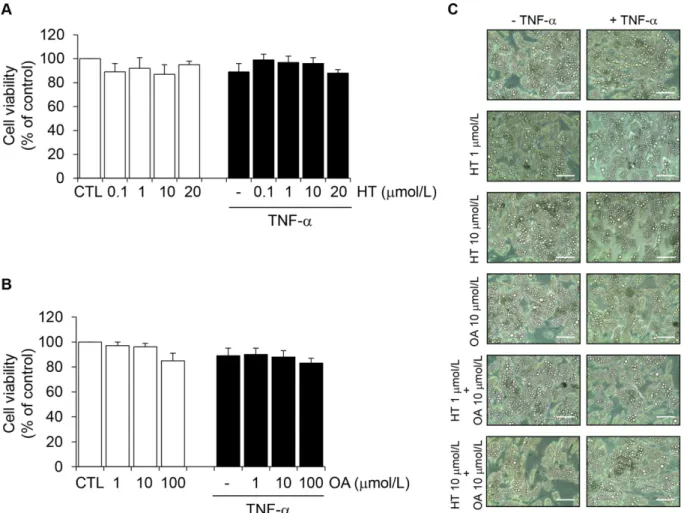
adi-ponectin protein levels in the culture medium of SGBS cells. Cell exposure to TNF-αfor 24 h resulted in a significant reduction of adiponectin protein levels in the culture medium, as as-sessed by ELISA (Fig 1). HT concentration-dependently prevented adiponectin decrease in re-sponse to TNF-α, with a significant effect starting at 1μmol/L (30% ± 5% reversal compared with TNF-αalone) (Fig 1A). At10μmol/L OA was also effective in attenuating TNF-α-in-duced adiponectin downregulation (Fig 1B). As a positive control we used the thiazolidine-dione (TZD) and PPARγagonist RSG, which resulted in a significant increase of adiponectin secretion in the absence or presence of TNF-α(Fig 1B), in agreement with earlier studies [21]. Since in the absence of TNF-αneither HT nor OA significantly influenced adiponectin levels (Fig 1, white bars), we did not further pursue the characterization of HT or OA effects on basal adiponectin expression. Treatment of SGBS cells with HT or OA in the absence or presence of TNF-α, at the concentrations and times used in our assays, did not affect cell viability, as as-sessed by the MTT test (Fig2Aand2B), morphological observation (Fig 2C), protein assay and Trypan blue exclusion (data not shown).
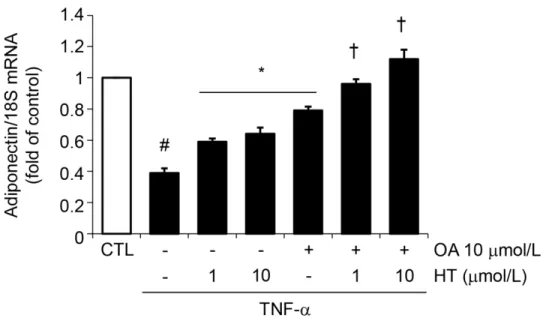
Cell treatment with a combination of physiologically relevant concentrations of OA (10μmol/L) plus HT (1–10μmol/L) before TNF-αrestored intracellular and secreted protein levels (Fig3Aand3B) as well as mRNA levels (Fig 4) of adiponectin in an additive manner compared with single treatments, thus suggesting an important additive effects of these two compounds simultaneously present in virgin olive oil.
To extend the observation made in SGBS adipocytes to other adipocyte-like cells, differenti-ated murine 3T3-L1 adipocytes were also used. As in SGBS cells, HT and OA, alone and—
addi-tively in combination—restored adiponectin release in the culture medium (S1andS2Figs), as
adiponectin reduction. The subsequent experiments were performed in SGBS cells, although validation of each essential findings was done with 3T3-L1 adipocytes.
To further confirm and expand findings of HT and OA modulating effect on adipocyte dys-function, we analyzed whether HT and OA—besides improving adiponectin—affected the pro-duction of leptin, another key adipokine with metabolic and vascular effects opposite to those of adiponectin; and of the leptin-to-adiponectin ratio, a recently recognized predictor of adipo-cyte dysfunction-related cardiometabolic risk [4]. To this aim, the release of leptin in the cul-ture medium and the leptin-to-adiponectin ratio were measured in SGBS adipocytes after HT Fig 1. Attenuation by HT and OA of TNF-α-induced inhibition of adiponectin protein release in human adipocytes.Human SGBS adipocytes were pretreated with HT (1 h) (A), OA (48 h) or RSG (24 h) (B) at the concentrations indicated and then either treated with 10 ng/mL TNF-α(black-filled bars), or left untreated (open white bars), for 24 h. Adiponectin levels in the culture medium were determined by ELISA, and expressed as percent of unstimulated control (CTL). Bars represent means±SD (n = 3). #p<0.05 versus CTL.*p<0.05 versus TNF-α.**p<0.01 versus TNF-α.
or OA treatment in the absence or presence of TNF-α. As shown inS3 Fig, HT, at all the con-centrations tested (0.1–10μmol/L), and OA at 10 and 100μmol/L significantly decreased leptin
release compared with untreated control. The combination of HT and OA did not here result in any significant additive effect compared with single treatments (not shown). TNF-α treat-ment for 24 h at 10 ng/mL reduced leptin secretion by about 40% compared with unstimulated control, but neither HT nor OA alone or in combination (not shown) affected leptin levels in response to TNF-α.
As a consequence of the reducing effect on leptin and of the neutral effects on adiponectin in basal unstimulated control, the leptin-to-adiponectin ratio significantly decreased, by about 25 ± 3%, in the presence of HT at all the concentrations tested or of OA at 10 and 100μmol/L compared with untreated control (S3 Fig). TNF-αdid not significantly change the leptin-to-adiponectin ratio compared with unstimulated control, but both HT and OA significantly de-creased the leptin-to-adiponectin ratio (by 38 ± 4%) compared with TNF-αalone, and this oc-curred in an additive manner for OA plus HT treatment (S3 Fig). These results suggested that adiponectin restoration by HT and OA is accompanied by the reduction of leptin release and, more importantly, the concomitant improvement of the leptin-to-adiponectin ratio.
Fig 2. The effect of HT and OA treatment on cell viability.SGBS adipocytes were treated with HT (1 h) (A) or OA (48 h) (B) at the concentrations indicated, and then either treated with 10 ng/mL TNF-α(black-filled bars), or left untreated (open white bars), for 24 h. Cell viability was assessed by the MTT assay, and expressed as percent of unstimulated control (CTL). Data are means±SD (n = 3). In (C), phase-contrast images of adipocytes treated with HT, OA or HT
+ OA in the absence or presence of TNF-αare presented. Scale bar = 50μm.
Fig 3. Effect of combined treatment with HT and OA on TNF-α-induced inhibition of adiponectin protein release and expression.SGBS cells were pretreated with either HT, OA or cotreated with HT + OA before 10 ng/mL TNF-αstimulation for 24 h. (A) Adiponectin in the culture medium was determined by ELISA, and expressed as percent of unstimulated control (CTL). (B) Adiponectin intracellular protein levels were determined by Western analysis using antibodies against adiponectin. Western analysis under reducing and denaturing condition here reveals the 30 kDa adiponectin monomer. Adiponectin expression was normalized toβ-actin, and expressed as percent of unstimulated control (CTL). Data are means±SD (n = 3). #p<0.05 versus CTL.*p<0.05
versus TNF-αalone.†p<0.05 versus each compound + TNF-α.
HT and OA additively prevent TNF-
α
-induced inhibition of PPAR
γ
expression and binding activity
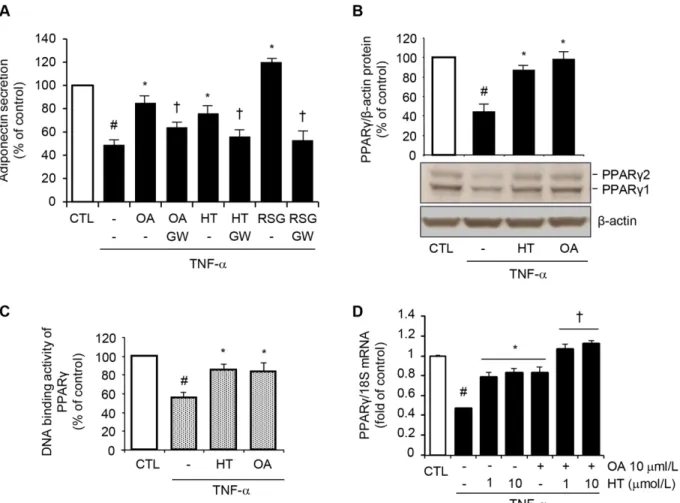
To understand the molecular mechanism(s) responsible for the HT- and OA-mediated restora-tion of adiponectin expression in inflamed adipocytes, we first evaluated the involvement of PPARγ, a master regulator of adiponectin gene expression [21], in the adiponectin upregula-tion by HT and OA. The inducupregula-tion of adiponectin release by 1μmol/L HT and 10μmol/L OA, as well as by RSG, was significantly abolished in the presence of GW9662, a selective PPARγ antagonist (Fig 5A), showing that PPARγis implicated in adiponectin regulation by both HT and OA.
In other experiments, HT or OA significantly reverted TNF-α-induced reduction of both PPARγ1 and PPARγ2 protein expression at Western analysis (Fig 5B), as well as PPARγDNA binding activity in nuclear extracts (Fig 5C). This effect was accompanied by a concomitant HT- or OA-mediated attenuation of the TNF-α-induced inhibition of PPARγmRNA levels (Fig 5D). Again, the combination of OA with HT restored PPARγgene expression in an addi-tive manner compared with treatments with both the here studied olive oil components in iso-lation (Fig 5D). Similar results on PPARγexpression were obtained in 3T3-L1 adipocytes (S4 Fig). These data suggested that HT and OA can prevent the TNF-α-mediated inhibition of adi-ponectin expression at least in part by counteracting TNF-αinhibitory effect on PPARγ ex-pression and activation.
JNK is required for TNF-
α
-induced suppression of adiponectin
In search of the upstream site of interference by HT and OA with the signaling pathway(s) me-diating adiponectin and PPARγsuppression by TNF-α, and given the role of MAPK activation in adipocyte inflammatory responses [22], we examined the involvement of the MAPK JNK, extracellular signal-related kinase (ERK) and p38 in the regulation of adiponectin expression Fig 4. Effect of combined treatment with HT and OA on TNF-α-induced inhibition of adiponectin
mRNA expression.SGBS cells were pretreated with either HT, OA or cotreated with HT + OA before 10 ng/ mL TNF-αstimulation for 24 h. Adiponectin mRNA levels were determined by qPCR and normalized to 18S RNA. Data are expressed as fold induction over unstimulated control (CTL). Data are means±SD (n = 3).
#p<0.05 versus CTL.*p<0.05 versus TNF-αalone.†p<0.05 versus each compound + TNF-α.
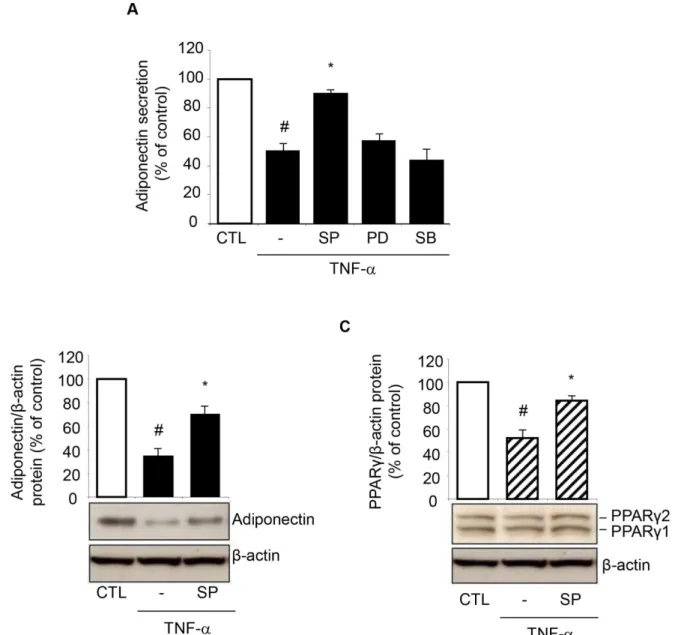
by TNF-αby using specific pharmacological MAPK inhibitors. Preliminary concentration-re-sponse study showed that concentrations of 10μmol/L of the JNK inhibitor SP600125, the ERK1/2 inhibitor PD98059, and the p38 inhibitor SB203580 were effective in blunting TNF-α-induced phosphorylation of the specific target MAPK (not shown). We found that the JNK in-hibitor SP600125, which inhibits the phosphorylation/activation of both JNK1 and JNK2 iso-forms with similar potency [23], reverted the inhibition of adiponectin protein release in the cell culture medium by TNF-α, while PD98059 and SB203580 had no effect (Fig 6A). There-fore, it appeared that TNF-αinhibits adiponectin secretion at least in part by selectively activat-ing JNK. Concordantly, JNK inhibition counteracted the reduction in the intracellular protein expression of adiponectin (Fig 6B), as well as PPARγ(Fig 6C) at Western analysis, suggesting the potential for JNK to be a molecular switch mediating the downregulation of PPARγand the related adiponectin by TNF-α.
Fig 5. Attenuation by HT and OA of TNF-α-induced inhibition of PPARγexpression and activity.(A) SGBS cells were treated with 1μmol/L HT, 10μmol/L OA, or 1μmol/L RSG in the absence or presence of the PPARγantagonist GW9662 at 10μmol/L (GW), and then stimulated with 10 ng/mL TNF-α for 24 h. Adiponectin levels in the culture medium were determined by ELISA, and expressed as percent of unstimulated control (CTL). Data are means±SD
(n = 3). #p<0.05 versus CTL.*p<0.05 versus TNF-αalone.†p<0.05 versus the compound-treated group without GW9662. (B) and (C) SGBS cells were
treated with 1μmol/L HT or 10μmol/L OA before 10 ng/mL TNF-αstimulation for 24 h. (B) Whole-cell lysates were assayed by Western blotting using antibodies against PPARγ1, PPARγ2, and againstβ-actin, this last used as a loading control. Total PPARγ1 and PPARγ2 band intensities were normalized to β-actin, and are expressed as percent of unstimulated control (CTL). (C) Nuclear proteins were analyzed for PPARγDNA-binding activity by ELISA as described in Methods. Data are expressed as percent of unstimulated control (CTL). (D) SGBS cells were treated with 1–10μmol/L HT, or 10μmol/L OA, or co-treated with OA + HT before 10 ng/mL TNF-αstimulation for 24 h. PPARγmRNA levels were determined by qPCR and normalized to 18S RNA. Data are expressed as fold induction over unstimulated control (CTL). Bars represent means±SD (n = 3). #p<0.05 versus CTL.*p<0.05 versus TNF-α.†p<0.05 versus each compound + TNF-α.
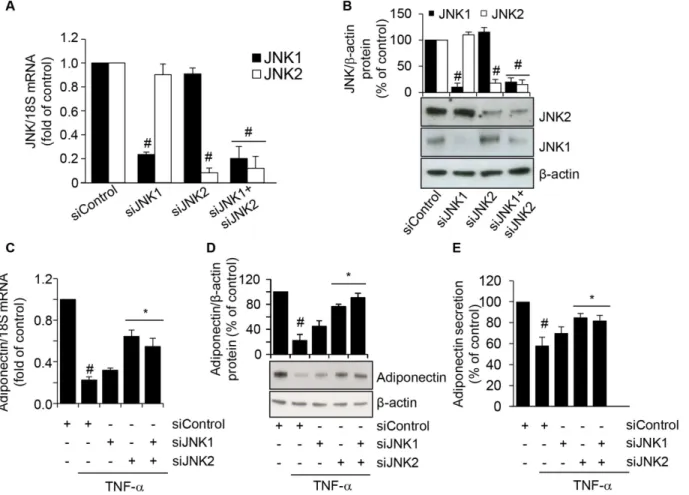
To further verify the involvement of JNK in TNF-α-induced inhibition of adiponectin ex-pression, and to ascertain the relative contribution of each JNK isoform, we transfected SGBS cells with either targeted JNK1 and/or JNK2 siRNA, and then stimulated them with TNF-αfor 24 h. As shown in Fig7Aand7B, compared with transfections with a scrambled negative con-trol siRNA, siRNA-mediated knockdown of JNK1 or JNK2 resulted in a specific and significant reduction in the levels of the targeted JNK1 and JNK2 mRNAs and intracellular protein levels, respectively. We next examined the effect of JNK silencing on the TNF-α-induced downregula-tion of adiponectin expression. While JNK1 siRNA alone had no significant effect on adiponec-tin mRNA, intracellular and secreted protein levels, JNK2 siRNA or co-treatment with JNK1 Fig 6. Involvement of JNK activation in TNF-α-induced PPARγand adiponectin inhibition.SGBS cells were pretreated for 1 h with 10μmol/L of the JNK inhibitor SP600125 (SP), the ERK1/2 inhibitor PD98059 (PD), or the p38 inhibitor SB203580 (SB), and then stimulated with 10 ng/mL TNF-αfor 24 h. Culture media were analyzed for adiponectin by ELISA (A), and whole-cell lysates were assayed by Western blotting using antibodies against adiponectin (B) or PPARγ(C). Adiponectin and PPARγexpression were normalized toβ-actin, and expressed as percent of unstimulated control (CTL). Bars represent means±SD (n = 3). #p<0.05 versus CTL.*p<0.05 versus TNF-α.
and JNK2 siRNA significantly reversed the TNF-α-induced reduction of adiponectin expres-sion and secretion (Fig7C–7E), thus confirming that a JNK-, and, in particular, a
JNK2-depen-dent pathway is required for the TNF-α-induced suppression of adiponectin.
HT and OA additively reduce TNF-
α
-induced activation of JNK
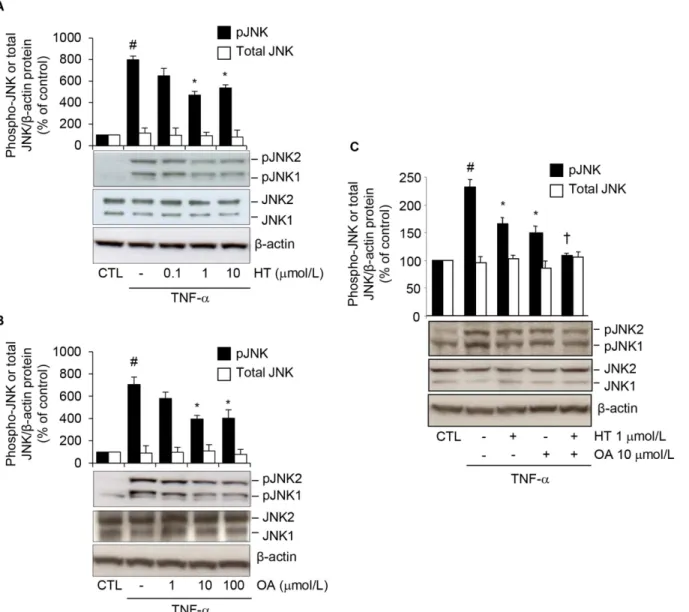
To address the possibility of an interference of HT or OA with JNK activation, we evaluated HT or OA effects on JNK phosphorylation in response to TNF-αin human adipocytes. At Western analysis, HT and OA significantly and concentration-dependently reduced the TNF-α-induced increase of phosphorylated (p) JNK1 and JNK2 (Fig8Aand8B), and this occurred in an additive manner (reduction by about 30 ± 4% for single treatments, and by 55 ± 2% for OA plus HT treatment, compared with TNF-αalone) (Fig 8C). Similar results were obtained in 3T3-L1 adipocytes (S4 Fig).
Fig 7. Attenuation of TNF-α-induced adiponectin downregulation by siRNA-mediated depletion of JNK.SGBS cells were treated with scrambled negative control siRNA (siControl), JNK1 siRNA (siJNK1), JNK2 siRNA (siJNK2), or JNK1 plus JNK2 siRNA, for 72 h. The mRNA expression levels of JNK1 and JNK2 were measured by qPCR, normalized to 18S RNA, and expressed as fold induction over scrambled negative control siRNA (A). JNK1 and JNK2 intracellular protein levels were assayed by Western blotting, normalized toβ-actin, and expressed as percent of scrambled negative control siRNA (B). Bars represent means±SD. #p<0.05 versus siControl. After 72 h of transfection, cells were stimulated with 10 ng/mL TNF-αfor further 24 h. Adiponectin mRNA were determined by qPCR (C), while adiponectin intracellular and secreted protein levels were determined by Western analysis (D) and ELISA (E), respectively. Bars represent means±SD. #p<0.05 versus siControl without TNF-α.*p<0.05 versus siControl with TNF-α.
Discussion
Adiponectin is an adipocyte-specific secretory protein with direct anti-diabetic, anti-athero-genic and anti-inflammatory properties [3]. The increase in adiponectin expression and plasma levels with drugs already existing or with novel therapeutic strategies is therefore considered valuable in the prevention and treatment of obesity-related metabolic and cardiovascular dis-eases in humans. The present study aimed at characterizing the effects of two representative and predominant virgin olive oil components, the MUFA OA and the antioxidant phenol HT, on adiponectin production by adipocytes stimulated with a prototypic inflammatory stimulus. We here demonstrate, for the first time, that both OA and HT, alone and in combination, and Fig 8. Attenuation by HT and OA of TNF-α-induced JNK phosphorylation.SGBS cells were treated with increasing concentrations of HT (A) or OA (B), or with 1μmol/L HT, 10μmol/L OA or co-treated with OA + HT (C) before 10 ng/mL TNF-αfor 20 min. Whole-cell lysates were assayed by Western blotting using antibodies against phosphorylated (p) JNK1/2, total JNK orβ-actin, as a loading control. Band intensities for phosphorylated and total JNK were normalized toβ-actin, and are expressed as percent of unstimulated control (CTL). Bars represent means±SD. #p<0.05 versus CTL.*p<0.05 versus
TNF-α.†p<0.05 versus each compound + TNF-α.
in this latter case additively, prevent TNF-α-induced suppression of adiponectin expression via the attenuation of JNK-mediated PPARγdownregulation.
We chose to determine OA and HT effects on adiponectin in the well-characterized and widely used human SGBS adipocytes as a cell model system closely resembling human native adipocytes [19]. We studied OA and HT effects on adiponectin also in the murine 3T3-L1 cell line, a widely used model for the study of adipocyte biology. In an attempt to reproduce the dysmetabolic and pro-inflammatory milieu causally linked to adipocyte dysfunction, we exam-ined the effects of HT and OA on cultured adipocytes stimulated with the proinflammatory cy-tokine TNF-α, which is elevated in obesity and T2DM and is known to reduce adiponectin expression and secretion [24]. The exposure of adipocytes to TNF-α, as it may occur upon in-filtration of TNF-α-producing leukocytes—mainly monocytes/macrophages—into the adipose
tissue in conditions of obesity, causes adipocyte dysfunction, resulting in the acquisition of a proinflammatory state, accompanied by adiponectin suppression [24]. To our knowledge, this is the first demonstration of the capacity of OA and HT to antagonize TNF-α-induced suppres-sion of adiponectin mRNA expressuppres-sion and protein release in human and murine adipocytes, thus pointing to a novel anti-inflammatory action of these two dietary factors.
These effects occurred for both compounds at nutritionally relevant concentrations. In fact, HT effective concentrations were as low as 1μmol/L, which is in the range of plasma concen-trations of HT and its metabolites (0.01 to 10μmol/L) attainable after dietary consumption of virgin olive oil [25]. OA is one of the most abundant free FA in human serum: its plasma con-centrations, normally ranging from 1 to 50μmol/L, are positively related to chronic olive oil consumption [26]. OA significantly inhibited adiponectin downregulation at 10μmol/L in human SGBS adipocytes, thus supporting the physiological relevance of our findings. In mouse 3T3-L1 adipocytes, OA was effective in counteracting adiponectin downregulation in inflamed adipocytes at a higher concentration (100μmol/L) than in human SGBS adipocytes, reflecting the impact of species differences between human and murine adipocytes. However, we were able to demonstrate a similar favorable regulation of adiponectin in inflamed condition in two adipocyte model systems, thus strengthening our observations and allowing us to reasonably generalize such findings.
Another notable observation of the present study is the additive favorable effect on adipo-nectin expression when OA and HT were given in combination, compared with single treat-ments. In addition to vegetable oils, OA can be found in animal fat, which is however also rich in (presumably less healthy) saturated FAs. Notably, our result suggests that the combination of OA and HT, as peculiarly occurring in virgin olive oil, may be importantin vivo, and indi-cates that the bioactivity of the parental nutrient is better appreciated when the natural food matrix is maintained. This observation is likely key to understand the relevance ofin vitro stud-ies with isolated compounds with thein vivoactivity of Mediterranean diets [5,11,13,27–29].
interfere with the suppressive effect of TNF-αon PPARγexpression levels and/or activity. This was confirmed by the significant recovery we observed in PPARγmRNA and protein expres-sion, accompanied by increased PPARγDNA binding activity, after single treatment with OA or HT, and in an additive manner after combined OA + HT treatment. Therefore, both OA and HT likely attenuate TNF-α–mediated suppression of adiponectin, at least in part, by
re-storing PPARγexpression and activity.
Potential mechanisms by which OA and HT block TNF-α-induced cellular responses in ad-ipocytes include the interference with receptor and/or post-receptor signaling pathways. It is known that TNF-αcauses inflammation by triggering a cascade of serine/threonine kinase phosphorylations that activates MAPKs and transcription factors, such as nuclear factor (NF)-κB and activator protein (AP)-1. These factors act in concert to cause adipocyte dysfunction and insulin resistance directly by decreasing insulin signaling, or indirectly by inducing inflam-matory gene expression and interfering with PPARγactivity [32]. Consistent with earlier stud-ies [33,34], we found that JNK is an obligate mediator of the TNF-α-induced downregulation of both PPARγand adiponectin in human adipocytes, since specific JNK pharmacological or molecular (siRNA) inhibition blunted the TNF-αsuppressive effect on these two proteins. The JNK subgroup of MAPK is encoded by 3 genes. Of these, JNK1 and JNK2 are ubiquitously ex-pressed and play important role in metabolic diseases [35,36]; JNK3 is exex-pressed predominant-ly in the heart, testis and brain [37]. Interestingpredominant-ly, we found that siRNA-mediated depletion of JNK2, but not JNK1, significantly attenuated TNF-α-induced suppression of adiponectin, indi-cating for the first time a role for JNK2-mediated signaling in adiponectin expression in in-flammatory condition. Although previous studies have reported that JNK1—but not JNK2—
deficiency results in reduced adiposity and insulin resistance in mouse models of obesity [35], a role for JNK2 in metabolic regulation [36,38], as well as in atherogenesis [39], has been also appreciated. We here demonstrate for the first time that OA and HT attenuate TNF-α-mediat-ed JNK1 and JNK2 activation, pointing to JNK as a mTNF-α-mediat-ediator of OA- and HT-inducTNF-α-mediat-ed im-provement in adiponectin expression and PPARγactivity. The similarity of effects of OA and HT on these early regulatory steps in adipocyte activation after TNF-αfully accounts for the additive—and not synergistic—nature of the effects described for the two compounds.
JNK activation is an emerging key element in the signaling pathway linking inflammation and metabolism, and represents a potential therapeutic target in obesity and T2DM [22]. JNK is activated by various stress signals, including cytokines and FFAs, leading to inflammatory re-sponses as well as to insulin resistance [22]. Although previous studies have demonstrated JNK modulation by dietary compounds—including HT and OA—in other cellular models [40–42],
ours is the first report of JNK inhibition by OA and HT in adipocytes, with a potential benefi-cial impact on obesity-related adipocyte dysfunction.
TNF-α-triggered intracellular pathways relevant to obesity (such as ceramide biosynthesis, en-doplasmic reticulum stress, and mitochondrial dysfunction), also deserves further evaluation.
Our data on adiponectin regulation by OA further expand recent reports showing a signifi-cant increase in basal adiponectin expression in OA-treated 3T3-L1 adipocytes, and a positive association between serum adiponectin levels and OA content in the rat adipose tissue [29]. Additionally, the OA capacity to improve adiponectin expression in adipocytes may contribute to explaining the beneficial effects of OA-enriched diets on human adiponectin plasma levels [46,47], as well as on inflammation and insulin sensitivity [18,48,49]. The direct effect of OA on adiponectin may support the gene-diet interaction recently found between dietary MUFAs and an adiponectin gene polymorphism modulating body mass index and the risk of obesity [50]. On the other hand, HT has been also shown to inhibit preadipocyte differentiation [51], and to promote mitochondrial function in differentiated 3T3-L1 adipocytes [28] and in obese mice [17], thus suggesting protective effects against the development of obesity. Recent lines of evidence have also reported improvement of insulin sensitivity after supplementation of HT-rich extracts from olive leaves in overweight men [16], and beneficial effects against the devel-opment of the metabolic syndrome in animal models [17]. The present report of HT-mediated restoration of adiponectin gene expression in inflammatory conditions improves our under-standing and prompts to further exploitation of the biological properties of olive oil phenols. To substantiate our observations on favorable modification of adipocytes (dys)function by HT and OA, we determined their effect on the release of leptin, another major adipose tissue-derived adipokine. In addition to serve as an adipose signal for the long-term regulation of food intake, energy expenditure and body weight, leptin may contribute to the metabolic and vascular risk associated with obesity [4]. Unlike adiponectin, plasma leptin levels are increased in obesity and type 2 diabetes, reflecting a state of leptin resistance; and are independently asso-ciated with hypoadiponectinemia, insulin resistance, dyslipidemia, inflammatory markers, and CVD [4]. Moreover, since leptin and adiponectin are associated with opposite metabolic and vascular effects and contribute, usually in an opposite manner, to several components of the metabolic syndrome, the leptin to adiponectin ratio has been shown to reflect compromised adipose tissue function and to be a better predictor of insulin resistance and adverse outcomes, including CVD and mortality, than either leptin or adiponectin alone [52–54]. Therefore, we
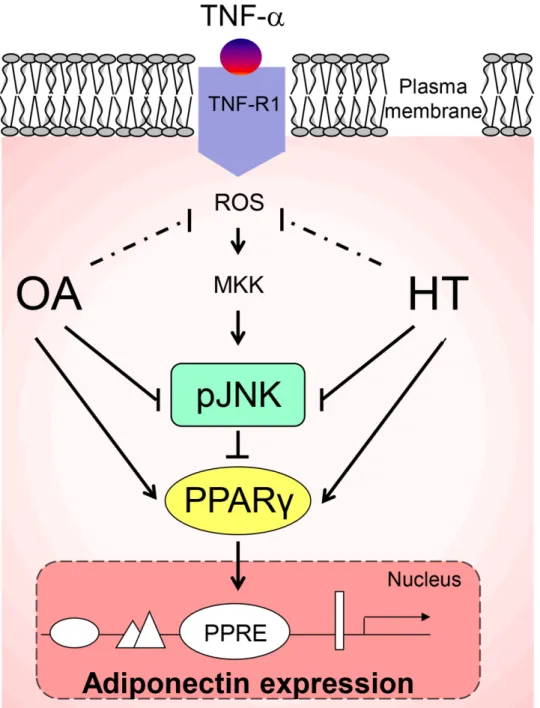
Fig 9. A working model for the HT and OA-mediated increase of adiponectin expression in TNF-α
-stimulated adipocytes.Pre-treatment with HT and OA before TNF-αstimulation prevents JNK activation and restores PPARγexpression and activity and, as a consequence, adiponectin levels. A coherent interpretation of the findings is as follows: upon binding to the cognate receptor, TNF-αinduces reactive oxygen species (ROS) production and triggers an inflammatory signaling cascade involving, among others, the activation of JNK, which mediates the degradation of PPARγ(a transcription factor implicated in adiponectin gene expression through a PPAR-responsive element (PPRE) in its promoter). As a result, adiponectin expression is downregulated. Arrow indicates stimulation. Line indicates inhibition. MKK: MAP kinase kinase; pJNK: phosphorylated JNK.
This is an in vitrostudy, with all limitations in the cellular model here used forin vivo infer-ences. Possible specific limitations include the fact that we did not determine the effect of HT main metabolites (e.g., ortho-methylic derivatives and glucuronides) formed after olive oil in-gestion and detected in human biological fluids along with the free form of HT; and the lack of data on adiponectin oligomers, critical in determining adiponectin systemic actions. Our cur-rent research is curcur-rently focusing on these important aspects. Strengths of our study however include the use of dietarily relevant concentrations of OA and HT; the simultaneous evaluation of the two most representative and chemically different components of virgin olive oil; and, possibly even more interesting, the demonstration of additive effects of HT and OA treatments. Indeed, testing the joint effects of bioactive compounds reproduces the natural food matrix of virgin olive oil more closely than the use of single, isolated components, as done in previous studies. In conclusions, we found that physiological concentrations of two virgin olive oil com-ponents, OA and HT, additively prevented inflammation-induced impairment of adiponectin in human adipocytes. Both compounds appear to exert their beneficial effects by decreasing TNF-α-induced JNK activation and improving PPARγexpression. A model, based on our data, of the mechanism by which OA and HT prevent TNF-α-induced impairment in adipo-nectin expression is shown inFig 9. These results, in association with favorable changes of the leptin-to-adiponectin ratio, contribute to explaining the metabolic and cardiovascular protec-tion provided by olive oil consumpprotec-tion in the context of the tradiprotec-tional Mediterranean diet.
Supporting Information
S1 Fig. Attenuation by HT and OA of TNF-α-induced inhibition of adiponectin protein re-lease in mouse 3T3-L1 adipocytes.3T3-L1 adipocytes were pretreated with HT (1 h) (A), OA (48 h) or RSG (24 h) (B) at the concentrations indicated, and then either treated with 10 ng/mL TNF-α, as a stimulus for adipocyte activation (filled bars), or left untreated (open bars), for 24 h. Adiponectin in the culture medium were determined by ELISA, and expressed as percent of unstimulated control (CTL). Bars represent mean ± SD (n = 3). #p<0.05 versus CTL.p<0.05
versus TNF-α.
p<0.01 versus TNF-α. (TIFF)
S2 Fig. Attenuation by HT and OA of TNF-α-induced inhibition of adiponectin expres-sion.3T3-L1 adipocytes were pretreated with either HT, OA or cotreated with HT + OA before stimulation with TNF-α10 ng/mL for 24 h. (A) Adiponectin in the culture medium were deter-mined by ELISA, and expressed as percent of unstimulated control (CTL). (B) Adiponectin mRNA levels were determined by qPCR and normalized to 18S RNA. Data are expressed as fold induction over unstimulated control (CTL). (C) After treatments, cells were fixed and immunostained for adiponectin protein as described in Methods (x40 magnification). Scale bar = 100μm. Quantification of immunostained adiponectin is shown in (D), and expressed as percent of unstimulated control (CTL). Data are means ± SD (n = 3). #p<0.05 versus CTL.
p<0.05 versus TNF-αalone.†p<0.05 versus each compound + TNF-α.
(TIFF)
versus CTL.
p<0.05 versus TNF-α.†p<0.05 versus each compound + TNF-α.
(TIFF)
S4 Fig. The effect of HT and OA on PPARγexpression and JNK phosphorylation in re-sponse to TNF-α.3T3-L1 adipocytes were treated with HT, OA or co-treated with OA + HT
at the concentrations indicated before 10 ng/mL TNF-αstimulation for 24 h (A), or for 20 min (B). (A) Whole-cell lysates were assayed by Western blotting using antibodies against PPARγ1, PPARγ2, andβ-actin as a loading control. Total PPARγ1 and PPARγ2 band intensities were normalized toβ-actin, and are expressed as percent of unstimulated control (CTL). (B) Whole-cell lysates were assayed by Western blotting using antibodies against phosphorylated (p) JNK, total JNK orβ-actin, as a loading control. Phosphorylated and total JNK band intensities were normalized toβ-actin, and are expressed as percent of unstimulated control (CTL). Bar repre-sent mean ± SD. #p<0.05 versus CTL.p<0.05 versus TNF-α.†p<0.05 versus each compound
+ TNF-α. (TIFF)
Acknowledgments
We thank C. Gerardi (CNR Institute of Sciences of Food Production, Lecce, Italy) for technical assistance in real-time PCR experiments.
Author Contributions
Conceived and designed the experiments: ES MM RDC. Performed the experiments: ES MP. Analyzed the data: ES MM RDC MP. Contributed reagents/materials/analysis tools: MW CS NC MAC. Wrote the paper: ES. Revised the article: RDC. Approved the final manuscript: ES MM MAC MP MW NC CS RDC.
References
1. . Madonna R, De Caterina R. Cellular and molecular mechanisms of vascular injury in diabetes—part II: cellular mechanisms and therapeutic targets. Vascul Pharmacol. 2011; 54: 75–79. doi:10.1016/j.vph. 2011.03.007PMID:21453785
2. Capurso C, Capurso A. From excess adiposity to insulin resistance: the role of free fatty acids. Vascul Pharmacol. 2012; 57: 91–97. doi:10.1016/j.vph.2012.05.003PMID:22609131
3. Kawano J, Arora R. The role of adiponectin in obesity, diabetes, and cardiovascular disease. J Cardio-metab Syndr. 2009; 4: 44–49. doi:10.1111/j.1559-4572.2008.00030.xPMID:19245516
4. Lopez-Jaramillo P, Arbelaez D, Lopez-Lopez J, Lopez-Lopez C, Martinez-Ortega J, Gomez-Rodriguez A, et al. The role of leptin/adiponectin ratio in metabolic syndrome and diabetes. Horm Mol Biol Clin Investig. 2014; 18: 37–45. doi:10.1515/hmbci-2013-0053PMID:25389999
5. Estruch R, Ros E, Salas-Salvado J, Covas MI, Corella D, Aros F, et al. Primary prevention of cardiovas-cular disease with a Mediterranean diet. N Engl J Med. 2013; 368: 1279–1290. doi:10.1056/
NEJMoa1200303PMID:23432189
6. Perez-Martinez P, Garcia-Rios A, Delgado-Lista J, Perez-Jimenez F, Lopez-Miranda J. Mediterranean diet rich in olive oil and obesity, metabolic syndrome and diabetes mellitus. Curr Pharm Des. 2011; 17: 769–777. PMID:21443484
7. Mantzoros CS, Williams CJ, Manson JE, Meigs JB, Hu FB. Adherence to the Mediterranean dietary pattern is positively associated with plasma adiponectin concentrations in diabetic women. Am J Clin Nutr. 2006; 84: 328–335. PMID:16895879
8. Esposito K, Pontillo A, Di Palo C, Giugliano G, Masella M, Marfella R, et al. Effect of weight loss and life-style changes on vascular inflammatory markers in obese women: a randomized trial. JAMA. 2003; 289: 1799–1804. PMID:12684358
10. Fragopoulou E, Panagiotakos DB, Pitsavos C, Tampourlou M, Chrysohoou C, Nomikos T, et al. The as-sociation between adherence to the Mediterranean diet and adiponectin levels among healthy adults: the ATTICA study. J Nutr Biochem. 2010; 21: 285–289. doi:10.1016/j.jnutbio.2008.12.013PMID: 19369051
11. Carluccio MA, Massaro M, Scoditti E, De Caterina R. Vasculoprotective potential of olive oil compo-nents. Mol Nutr Food Res. 2007; 51: 1225–1234. PMID:17912721
12. Richard N, Arnold S, Hoeller U, Kilpert C, Wertz K, Schwager J. Hydroxytyrosol is the major anti-inflam-matory compound in aqueous olive extracts and impairs cytokine and chemokine production in macro-phages. Planta Med. 2011; 77: 1890–1897. doi:10.1055/s-0031-1280022PMID:21830187
13. Scoditti E, Calabriso N, Massaro M, Pellegrino M, Storelli C, Martines G, et al. Mediterranean diet poly-phenols reduce inflammatory angiogenesis through MMP-9 and COX-2 inhibition in human vascular endothelial cells: a potentially protective mechanism in atherosclerotic vascular disease and cancer. Arch Biochem Biophys. 2012; 527: 81–89. doi:10.1016/j.abb.2012.05.003PMID:22595400
14. Scoditti E, Capurso C, Capurso A, Massaro M. Vascular effects of the Mediterranean diet-Part II: Role of omega-3 fatty acids and olive oil polyphenols. Vascul Pharmacol. 2014; 63: 127–134. doi:10.1016/j. vph.2014.07.001PMID:25446163
15. Scoditti E, Nestola A, Massaro M, Calabriso N, Storelli C, De Caterina R, et al. Hydroxytyrosol sup-presses MMP-9 and COX-2 activity and expression in activated human monocytes via PKCalpha and PKCbeta1 inhibition. Atherosclerosis. 2014; 232: 17–24. doi:10.1016/j.atherosclerosis.2013.10.017 PMID:24401212
16. de Bock M, Derraik JG, Brennan CM, Biggs JB, Morgan PE, Hodgkinson SC, et al. Olive (Olea euro-paea L.) leaf polyphenols improve insulin sensitivity in middle-aged overweight men: a randomized, pla-cebo-controlled, crossover trial. PLoS One. 2013; 8: e57622. doi:10.1371/journal.pone.0057622 PMID:23516412
17. Cao K, Xu J, Zou X, Li Y, Chen C, Zheng A, et al. Hydroxytyrosol prevents diet-induced metabolic syn-drome and attenuates mitochondrial abnormalities in obese mice. Free Radic Biol Med. 2014; 67: 396– 407. doi:10.1016/j.freeradbiomed.2013.11.029PMID:24316371
18. Lopez-Miranda J, Perez-Jimenez F, Ros E, De Caterina R, Badimon L, Covas MI, et al. Olive oil and health: summary of the II international conference on olive oil and health consensus report, Jaen and Cordoba (Spain) 2008. Nutr Metab Cardiovasc Dis. 2010; 20: 284–294. doi:10.1016/j.numecd.2009. 12.007PMID:20303720
19. Wabitsch M, Brenner RE, Melzner I, Braun M, Moller P, Heinze E, et al. Characterization of a human preadipocyte cell strain with high capacity for adipose differentiation. Int J Obes Relat Metab Disord. 2001; 25: 8–15. PMID:11244452
20. Covas MI, de la Torre K, Farre-Albaladejo M, Kaikkonen J, Fito M, Lopez-Sabater C, et al. Postprandial LDL phenolic content and LDL oxidation are modulated by olive oil phenolic compounds in humans. Free Radic Biol Med. 2006; 40: 608–616. PMID:16458191
21. Iwaki M, Matsuda M, Maeda N, Funahashi T, Matsuzawa Y, Makishima M, et al. Induction of adiponec-tin, a fat-derived antidiabetic and antiatherogenic factor, by nuclear receptors. Diabetes. 2003; 52: 1655–1663. PMID:12829629
22. Solinas G, Karin M. JNK1 and IKKbeta: molecular links between obesity and metabolic dysfunction. FASEB J. 2010; 24: 2596–2611. doi:10.1096/fj.09-151340PMID:20371626
23. Bennett BL, Sasaki DT, Murray BW, O'Leary EC, Sakata ST, Xu W, et al. SP600125, an anthrapyrazo-lone inhibitor of Jun N-terminal kinase. Proc Natl Acad Sci U S A. 2001; 98: 13681–13686. PMID: 11717429
24. Permana PA, Menge C, Reaven PD. Macrophage-secreted factors induce adipocyte inflammation and insulin resistance. Biochem Biophys Res Commun. 2006; 341: 507–514. PMID:16427608
25. Ruano J, Lopez-Miranda J, de la Torre R, Delgado-Lista J, Fernandez J, Caballero J, et al. Intake of phenol-rich virgin olive oil improves the postprandial prothrombotic profile in hypercholesterolemic pa-tients. Am J Clin Nutr. 2007; 86: 341–346. PMID:17684203
26. Saadatian-Elahi M, Slimani N, Chajes V, Jenab M, Goudable J, Biessy C, et al. Plasma phospholipid fatty acid profiles and their association with food intakes: results from a cross-sectional study within the European Prospective Investigation into Cancer and Nutrition. Am J Clin Nutr. 2009; 89: 331–346. doi: 10.3945/ajcn.2008.26834PMID:19056549
27. Massaro M, Basta G, Lazzerini G, Carluccio M, Bosetti F, Solaini G, et al. Quenching of intracellular ROS generation as a mechanism for oleate-induced reduction of endothelial activation and early ath-erogenesis. Thromb Haemost. 2002; 88: 176–375. PMID:12195684
29. Granados N, Amengual J, Ribot J, Palou A, Bonet ML. Distinct effects of oleic acid and its trans-isomer elaidic acid on the expression of myokines and adipokines in cell models. Br J Nutr. 2011; 105: 1226– 1234. doi:10.1017/S0007114510004885PMID:21208487
30. Kliewer SA, Sundseth SS, Jones SA, Brown PJ, Wisely GB, Koble CS, et al. Fatty acids and eicosa-noids regulate gene expression through direct interactions with peroxisome proliferator-activated re-ceptors alpha and gamma. Proc Natl Acad Sci U S A. 1997; 94: 4318–4323. PMID:9113987
31. Shin DW, Kim SN, Lee SM, Lee W, Song MJ, Park SM, et al. (-)-Catechin promotes adipocyte differenti-ation in human bone marrow mesenchymal stem cells through PPAR gamma transactivdifferenti-ation. Biochem Pharmacol. 2009; 77: 125–133. doi:10.1016/j.bcp.2008.09.033PMID:18951882
32. Ruan H, Miles PD, Ladd CM, Ross K, Golub TR, Olefsky JM, et al. Profiling gene transcription in vivo veals adipose tissue as an immediate target of tumor necrosis factor-alpha: implications for insulin re-sistance. Diabetes. 2002; 51: 3176–3188. PMID:12401708
33. Camp HS, Tafuri SR, Leff T. c-Jun N-terminal kinase phosphorylates peroxisome proliferator-activated receptor-gamma1 and negatively regulates its transcriptional activity. Endocrinology. 1999; 140: 392– 397. PMID:9886850
34. Kim KY, Kim JK, Jeon JH, Yoon SR, Choi I, Yang Y. c-Jun N-terminal kinase is involved in the suppres-sion of adiponectin expressuppres-sion by TNF-alpha in 3T3-L1 adipocytes. Biochem Biophys Res Commun. 2005; 327: 460–467. PMID:15629137
35. Hirosumi J, Tuncman G, Chang L, Gorgun CZ, Uysal KT, Maeda K, et al. A central role for JNK in obesi-ty and insulin resistance. Nature. 2002; 420: 333–336. PMID:12447443
36. Tuncman G, Hirosumi J, Solinas G, Chang L, Karin M, Hotamisligil GS. Functional in vivo interactions between JNK1 and JNK2 isoforms in obesity and insulin resistance. Proc Natl Acad Sci U S A. 2006; 103: 10741–10746. PMID:16818881
37. Davis RJ. Signal transduction by the JNK group of MAP kinases. Cell. 2000; 103: 239–252. PMID: 11057897
38. Ito M, Nagasawa M, Omae N, Ide T, Akasaka Y, Murakami K. Differential regulation of CIDEA and CIDEC expression by insulin via Akt1/2- and JNK2-dependent pathways in human adipocytes. J Lipid Res. 2011; 52: 1450–1460. doi:10.1194/jlr.M012427PMID:21636835
39. Ricci R, Sumara G, Sumara I, Rozenberg I, Kurrer M, Akhmedov A, et al. Requirement of JNK2 for scavenger receptor A-mediated foam cell formation in atherogenesis. Science. 2004; 306: 1558–1561. PMID:15567863
40. Miller TA, LeBrasseur NK, Cote GM, Trucillo MP, Pimentel DR, Ido Y, et al. Oleate prevents palmitate-induced cytotoxic stress in cardiac myocytes. Biochem Biophys Res Commun. 2005; 336: 309–315. PMID:16126172
41. Chuang CC, Martinez K, Xie G, Kennedy A, Bumrungpert A, Overman A, et al. Quercetin is equally or more effective than resveratrol in attenuating tumor necrosis factor-{alpha}-mediated inflammation and insulin resistance in primary human adipocytes. Am J Clin Nutr. 2010; 92: 1511–1521. doi:10.3945/ ajcn.2010.29807PMID:20943792
42. Incani A, Deiana M, Corona G, Vafeiadou K, Vauzour D, Dessi MA, et al. Involvement of ERK, Akt and JNK signalling in H2O2-induced cell injury and protection by hydroxytyrosol and its metabolite homova-nillic alcohol. Mol Nutr Food Res. 2010; 54: 788–796. doi:10.1002/mnfr.200900098PMID:20024934
43. Houstis N, Rosen ED, Lander ES. Reactive oxygen species have a causal role in multiple forms of insu-lin resistance. Nature. 2006; 440: 944–948. PMID:16612386
44. Furukawa S, Fujita T, Shimabukuro M, Iwaki M, Yamada Y, Nakajima Y, et al. Increased oxidative stress in obesity and its impact on metabolic syndrome. J Clin Invest. 2004; 114: 1752–1761. PMID: 15599400
45. Giordano E, Davalos A, Visioli F. Chronic hydroxytyrosol feeding modulates glutathione-mediated oxido-reduction pathways in adipose tissue: a nutrigenomic study. Nutr Metab Cardiovasc Dis. 2014; 24: 1144–1150. doi:10.1016/j.numecd.2014.05.003PMID:24984826
46. Paniagua JA, Gallego de la Sacristana A, Romero I, Vidal-Puig A, Latre JM, Sanchez E, et al. Monoun-saturated fat-rich diet prevents central body fat distribution and decreases postprandial adiponectin ex-pression induced by a carbohydrate-rich diet in insulin-resistant subjects. Diabetes Care. 2007; 30: 1717–1723. PMID:17384344
47. Yeung EH, Appel LJ, Miller ER 3rd, Kao WH. The effects of macronutrient intake on total and high-mo-lecular weight adiponectin: results from the OMNI-Heart trial. Obesity (Silver Spring). 2010; 18: 1632– 1637. doi:10.1038/oby.2009.402PMID:19876001
49. van Dijk SJ, Feskens EJ, Bos MB, Hoelen DW, Heijligenberg R, Bromhaar MG, et al. A saturated fatty acid-rich diet induces an obesity-linked proinflammatory gene expression profile in adipose tissue of subjects at risk of metabolic syndrome. Am J Clin Nutr. 2009; 90: 1656–1664. doi:10.3945/ajcn.2009. 27792PMID:19828712
50. Warodomwichit D, Shen J, Arnett DK, Tsai MY, Kabagambe EK, Peacock JM, et al. ADIPOQ polymor-phisms, monounsaturated fatty acids, and obesity risk: the GOLDN study. Obesity (Silver Spring). 2009; 17: 510–517. doi:10.1038/oby.2008.583PMID:19238139
51. Drira R, Chen S, Sakamoto K. Oleuropein and hydroxytyrosol inhibit adipocyte differentiation in 3 T3-L1 cells. Life Sci. 2011; 89: 708–716. doi:10.1016/j.lfs.2011.08.012PMID:21945192
52. Norata GD, Raselli S, Grigore L, Garlaschelli K, Dozio E, Magni P, et al. Leptin:adiponectin ratio is an independent predictor of intima media thickness of the common carotid artery. Stroke. 2007; 38: 2844– 2846. PMID:17823381
53. Zaletel J, Barlovic DP, Prezelj J. Adiponectin-leptin ratio: a useful estimate of insulin resistance in pa-tients with Type 2 diabetes. J Endocrinol Invest. 2010; 33: 514–518. doi:10.3275/6811PMID: 20142631
54. Kappelle PJ, Dullaart RP, van Beek AP, Hillege HL, Wolffenbuttel BH. The plasma leptin/adiponectin ratio predicts first cardiovascular event in men: a prospective nested case-control study. Eur J Intern Med. 2012; 23: 755–759. doi:10.1016/j.ejim.2012.06.013PMID:22819464
55. Fawcett RL, Waechter AS, Williams LB, Zhang P, Louie R, Jones R, et al. Tumor necrosis factor-alpha inhibits leptin production in subcutaneous and omental adipocytes from morbidly obese humans. J Clin Endocrinol Metab. 2000; 85: 530–535. PMID:10690850
56. Zhang HH, Kumar S, Barnett AH, Eggo MC. Tumour necrosis factor-alpha exerts dual effects on human adipose leptin synthesis and release. Mol Cell Endocrinol. 2000; 159: 79–88. PMID:10687854
57. Cammisotto PG, Gelinas Y, Deshaies Y, Bukowiecki LJ. Regulation of leptin secretion from white adi-pocytes by free fatty acids. Am J Physiol Endocrinol Metab. 2003; 285: E521–526. PMID:12736159