Study on the NaOH/metakaolin Ratio and Crystallization Time for Zeolite a Synthesis from
Kaolin Using Statistical Design
Severino Higino da Silva Filhoa, Lindiane Biesekib, Ana Aurea B. Maiac, Helen Treicheld,
Rômulo Simões Angelicac, Sibele Berenice Castellã Perghera,b*
Received: October 18, 2015; Revised: February 25, 2017; Accepted: March 12, 2017
The NaOH/metakaolin ratio and crystallization time were studied for the synthesis of zeolite NaA from a sample of kaolin from a Capim mine. The tests were carried out by using statistical design with axial points and replication of the central point. The samples obtained were characterized by X-ray
difraction (DRX), scanning electron microscopy and chemical analysis using a microprobe EPMA.
The results showed that there is a relationship between the amount of NaOH added and crystallization
time. The tests carried out using the lowest NaOH/metakaolin ratio (0.5) and the shortest time (4 h)
produced a non-crystalline material. On the other hand, increasing the NaOH/metakaolin ratio and the crystallization time led to the formation of a NaA phase with a high structural level, but with the presence of a sodalite phase as an impurity.
Keywords: Zeolite NaA, metakaolin, statistical design
* e-mail: [email protected]
1. Introduction
Kaolin is a type of clay with various applications such as ceramics, adsorbents, and a source of Si and Al for the synthesis of zeolites. This material is composed mainly of the clay mineral kaolinite, which has a Si/Al ratio close to 1, making it very interesting for the synthesis of zeolite A1,2,3.
Materials synthesized from clays can be applied in both adsorption and catalysis with results comparable to or even better than some commercial materials. Loiola et al
(2012)4 showed that a NaA type zeolite synthesized from
metakaolin (produced from a Brazilian kaolin calcined at 900 °C for 2 h) more eiciently removed Ca2+ from water than commercial zeolite A. Magnetization treatments can be carried out on these materials without a great loss in
eiciency. Liu et al (2013)5 synthesized a zeolite with magnetic properties by adding Fe3O4 from a metakaolin. It was used in the following conditions: SiO2/Al2O3 = 2.3, Na2O/SiO2 = 1.4, H2O/Na2O = 50, and crystallization time
of 8 h at 95 °C, and an eiciency of over 95% was observed
for the removal of lead and copper. Cation exchange with Ca+2 in zeolite NaA synthesized from kaolin, with a cation
exchange capacity of 183.40 meq/100 g, has produced an
adsorbent for arsenic6.
These materials can also be used as supports in catalysis.
Selim and El-Maksoud (2004)7 have carried out tests with
zeolite LTA produced from the hydrothermal treatment of
an Egyptian kaolin with Ni, in which they observed that
the material studied showed high catalytic activity in the
hydrogenation of sunlower oil.
Because of these and other studies that show diferent
potential applications of these materials, the study of the synthesis of zeolites is important because of the variations in the chemical and mineralogical composition of raw materials
(kaolin). These natural products are obtained from diferent regions, and their characteristics inluence the synthesis of zeolitic materials. For this reason, diferent studies have
been or are being conducted on the synthesis procedures to adapt and improve methodologies for the use of regional raw materials.
For example, Alkan et al (2005)8 studied the inluence
of NaOH concentration and the solid/liquid ratio on the
synthesis of zeolite NaA using a metakaolin obtained at
900 °C for 2 h. The synthesis time was ixed at 2 h, with the best concentration of 4 mol/L NaOH used. However, by using a concentration of 6 mol/L, the best solid/liquid ratios
obtained for the synthesis were from 1.25 to 5.0 g in 25 mL at 2 h with a synthesis temperature of 105 °C.
Kaolin can be activated mechanically or by calcination. The use of both types of activated kaolin is interesting for the
production of zeolite A. Cristóbal et al (2010)9 have shown
that a kaolin composed of 47.76% SiO2, 39.68% Al2O3 and
only 5% quartz, treated either by mechanical grinding or a Post-Graduation Program in Chemistry. Institute of Chemistry, Federal University of Rio Grande do
Norte, Laboratory of Molecular Sieves – LABPEMOL, 59078-900, Natal, RN, Brazil
b Post-Graduation Program in Materials Science and Engineering. Federal University of Rio Grande do
Norte, Laboratory of Molecular Sieves - LABPEMOL, 59078-900, Natal, RN, Brazil
by calcination, can provide the formation of zeolite A after activation with NaOH 5 mol/L at 90 °C for 3 h with stirring.
However, in the same study, a sample with a high quartz content, 89%, and only 7% kaolinite was not suitable for
the production of zeolite A due to the higher amount of
quartz present.
In addition to hydrothermal methods, the synthesis of zeolite A can be performed by using an alkaline fusion
pre-step, as used by Rios et al (2009)3, in which kaolin was mixed at a proportion of kaolin/NaOH = 1/1.2 by weight.This process used a non-calcined kaolin and produced a zeolite A with a high structural degree. Some studies have had good results regarding the formation of a pure zeolite A phase with
microwave synthesis. Chandrasekha and Pramada (2008)10 studied the optimization of synthesis conditions by using microwaves. The best conditions observed by the authors for synthesis with metakaolin were exposing the reaction mixture to 2 minutes of microwave irradiation, followed by
aging at room temperature for 20 h and inally heating the mixture in a microwave for 2 h (85 °C).
The amount of NaOH added in the synthesis will also
inluence the formation process of the desired structure.
According to the standard IZA synthesis, the Na/Al ratio used for the synthesis of zeolite A is 1.78. In the study of
Maia et al (2011)11, the Na/Al ratios of 1.26, 1.36 and 1.45
with a synthesis time of 24 h at 110 °C were studied. It was
observed that the Na/Al ratio of 1.36 gave the best results in terms of crystallinity for the zeolite NaA synthesis using
a calcined Amazon kaolin. By changing the Na/Al ratio, it
is possible to indirectly modify the NaOH/kaolin ratio in the synthesis, and vice versa.
This work aims to study diferent ratios of NaOH/
metakaolin according to crystallization time by using
statistical design to deine a domain in which these synthesis
parameters can be optimized.
2. Experimental
2.1. Materials and methods
The kaolin used in this study comes from the Capim
mine located in Pará state, Brazil. The kaolin used in all experiments was calcined at 700 °C for 2 h in a mule furnace
to transform it into the more reactive metakaolin phase.
2.2. Zeolite NaA synthesis
To study the relationship between the parameters of crystallization time and NaOH/metakaolin ratio, a 22 statistical design with 3 central points was used. The design matrix with the studied crystallization time ranges and NaOH/metakaolin ratios are presented in Table 1. The samples were named as
PxZAyH, where x represents the number of the test and y represents the crystallization time used.
The molar composition of the synthesis gel of all procedures
performed was set to be: 0.04 SiO2 : 0.02 Al2O3 : 2.4 H2O: x NaOH, with the value of x equal to 0.046, 0.055, 0.078, 0.1 or 0.11 for procedures in which the NaOH/metakaolin ratio
(g/g) varied from 0.42 to 0.5, 0.7, 0 9 and 0.99. Tests 6 and
7 are replicates of test 5. The standard time for synthesis
of zeolite A is 4 h. Thus, the minimum time used in these studies was from 0 to 4 h, and the maximum values and the
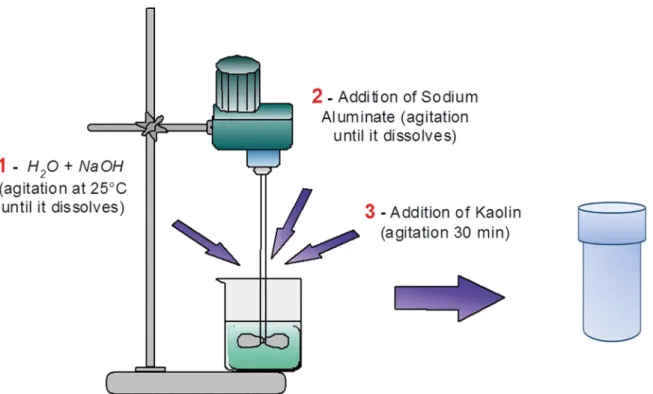
values of the central point were 16, 28 and 33 h. A diagram of the standard zeolite NaA synthesis is presented in Figure 1. A very small amount of sodium aluminate was added so that the Na/Al ratios reached the following values: 1.65, 1.97,
2.75, 3.54 and 3.89 for the samples with NaOH/metakaolin ratios of 0.42, 0.5, 0.7, 0.9 and 0.99, respectively.
2.3 Characterization
The initial metakaolin sample and all samples obtained
from the tests were analyzed by X-ray difraction in a DIFFRAKTOMETER instrument –D2-PHASER Model (Bruker) with a nickel ilter and Cu-Kα radiation (λ = 1.54 Å). The data obtained from this technique were used to calculate
the relative crystallinity of the samples. These results were
statistically analyzed by using Statistica 6.0 software (Statsoft Inc., Tulsa, USA). The results regarding the chemical
composition and morphology of all samples were obtained through scanning electron microscopy and chemical analysis
by using a microprobe EPMA, Model 1720H, Shimadzu, with an accelerating voltage of 15 kV and a BC ranging from 50
Table 1: Matrix of the experimental design and crystallization time ranges and NaOH/metakaolin ratio studied for zeolite A synthesis.
Tests Crystallization time NaOH/kaolin ratio
P1ZA4H -1 -1
P2ZA28H -1 +1
P3ZA4H +1 -1
P4ZA28H +1 +1
*P5ZA16H 0 0
*P6ZA16H 0 0
*P7ZA16H 0 0
P8ZA16H 0 - 1.41
P9ZA16H 0 +1.41
P10ZA0H - 1.41 0
P11ZA33H +1.41 0
Levels Crystallization time (h) NaOH/kaolin ratio
-1.41 0 0.42
-1 4 0.5
0 16 0.7
+1 28 0.9
+1.41 33 0.99
Figure 1: Synthesis diagram for zeolite NaA.
nA to 0.01 nA. For this analysis, the samples were mounted with carbon tape and metallized with gold.
3. Results and Discussion
The non-calcined kaolin showed characteristic relections indicating the presence of kaolinite (Figure 2a). After the calcination process, the difractogram shown in Figure 2b
is characteristic of an amorphous material.
The micrograph images show that the calcined kaolin has an irregular morphology resembling disorganized plates. Calcination promotes the dehydroxylation of kaolinite and thus a change in the environment around the aluminum
atoms, which begin to acquire coordination numbers 4
and 512. Thus, the octahedral aluminum starts to become tetrahedral, making the material amorphous and more reactive. According to the results of chemical analysis, the
kaolin is composed of aluminum (16.27%), silicon (15.75%), titanium (0.27%) and iron (0.5%). The microprobe analysis is semi-quantitative, and the results are in accordance with
those expected for kaolin samples.
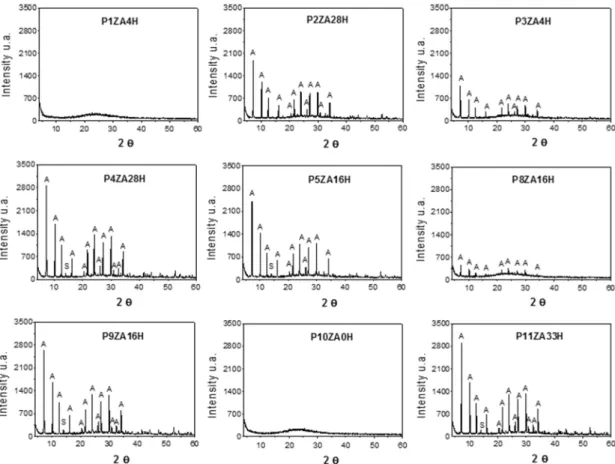
In Figure 3, the difractograms of the samples obtained
from the statistical design show that the synthesized materials are all characterized by the presence of the zeolite A phase.
The difractograms in Figure 3 show the characteristic relections of zeolite NaA, with the peaks identiied from a comparison with a standard (8664 to zeolite A) from the “Inorganic Crystal Structure Database” (ICSD), except for the samples P1ZA4H and P10ZA0H. These samples show
the characteristic difractogram of an amorphous material. At 2θ between 20 and 35°, there is an elevation of the
“background signal”, especially for samples P3ZA4H, P2ZA28H and P8ZA16H. This indicates that a portion of
the metakaolin was not completely converted into zeolite.
In the samples P4ZA28H, P9ZA16H and P11ZA33H, this elevation is lower, indicating a more eicient synthesis.
The relative crystallinity values were calculated for each synthesized sample from the sum of the areas under
the peaks at 2θ equal to 7.2°, 12.5°, 16.1°, 21.7°, 30°, and 34.2°. A sample of zeolite A synthesized by the IZA method was used as the standard. The equation used to calculate the
relative crystallinity is shown below.
%
tan
relative crystallinity
peaks area of s dard sample
peaks area of synthesized sample
=
/
/
The relative crystallinity values of all the samples synthesized by using the experimental design are presented in Table 2.
The samples P4ZA28H, P9ZA16H and P11ZA33H
are the most crystalline compared to the other synthesized samples. Table 3 shows the molar ratios of Na/Al and H2O/ NaO2 for each of the NaOH/metakaolin ratios used.
For the most crystalline samples (P4ZA28H and P9ZA16H), the NaOH/metakaolin ratio was the highest at 0.9 and 0.99, which led to Na/Al ratios of 3.54 and 3.89. For the P11ZA33H synthesis, the NaOH/metakaolin ratio
Figure 2: Difractogram and micrographs of samples of natural kaolin (A) and kaolin calcined at 700 °C for 2 h (B).
Figure 3: Difractograms of the samples obtained from the 22 statistical design with 3 central points for zeolite A from calcined kaolin
Table 2: Percentage of relative crystallinity of the samples synthesized using a 22 statistical design with 3 central points.
Samples Crystallinity Percentage
P1ZA4H 0 P2ZA28H 49.7 P3ZA4H 31.3 P4ZA28H 66.4 P5ZA16H 60.2 P6ZA16H 59.5 P7ZA16H 58.8 P8ZA16H 18.5 P9ZA16H 62.4 P10ZA0H 0 P11ZA33H 65.4
Table 3: H2O/Na2O ratios for the syntheses carried out.
NaOH/metakaolin mass ratio
H2O/Na2O molar ratio
Na/Al molar ratio
0.42 104 1.65
0.5 96 1.97
0.7 60 2.75
0.9 48 3.54
0.99 44 3.89
structural degree. In the synthesis of zeolites, the charge
compensating cation (in this case Na+) can also function as a structural driver13, which may be one of the factors that led to a more crystalline material. In the zeolite synthesis, there are domains in which the interaction between the synthesis
parameters can deine the type of structure formed. In this
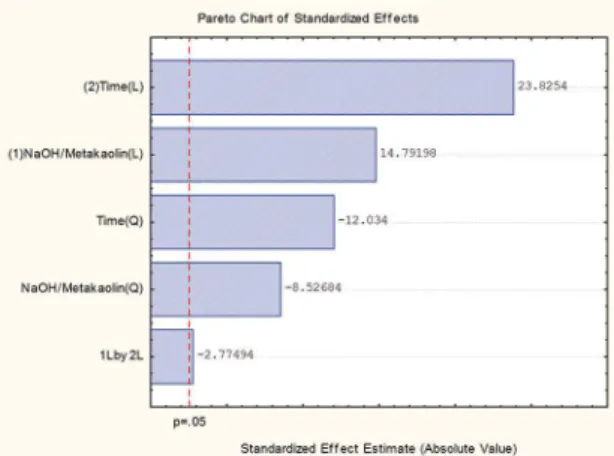
case, the increased amount of NaOH, coupled with a longer crystallization time, led to the formation of a more crystalline NaA phase. The interaction of these two parameters on the
yield of the synthesis is best represented by the Pareto chart shown in Figure 4.
The reaction time and the NaOH/metakaolin ratio each
have a strong inluence, both linear as well as in the quadratic
form, on the synthesis regarding obtaining a product with a
high structural degree. However, the difractograms show that
the increase in crystallinity of the NaA phase is accompanied
by the increased presence of sodalite. The P2ZA28H sample
showed the best values of crystallinity with a pure NaA phase.
Wang et al (2008)14, by using coal ash for the synthesis of zeolite A, found that increasing the concentration of NaOH leads to a reduction of the crystallization time. This is expected because the dissolution rate of the raw material in that study increases with increasing amount of NaOH, as also seen with kaolin. However, the formation of more stable phases, such
as sodalite (which has a more condensed structure), is also
observed, but reducing the amount of NaOH may lead to the formation of amorphous material.
Figure 4: Pareto chart for the synthesis of zeolite A from calcined kaolin.
In Table 4, the proposed model and the analysis of variance
for this study are presented. Although this model was not
suiciently robust for these experimental conditions, it is still possible to evaluate the inluence of the parameters of
crystallization time and NaOH/metakaolin ratio.
In Figure 5, which is a response surface graph, the area where the best results are obtained for the zeolite A crystallinity is in the region of higher temperature and longer crystallization times.
Alkan et al (2005)8 also observed that increasing the
amount of NaOH and decreasing the liquid phase was
associated with an increase in the formation of the sodalite phase. When the metakaolin/H2O ratio was ixed at 0.3, the material produced was all sodalite, while in the range from 0.05 to 0.2, they obtained a mixture of zeolite A and sodalite phases. In this study the metakaolin/H2O ratio was ixed at
0.1 for all experiments to minimize the efect of the liquid
phase on the appearance of the sodalite phase. Changing the NaOH/metakaolin ratio also indirectly changes the H2O/Na2O in the synthesis gels because a decrease in H2O leads to an increase in NaOH concentration. The H2O/Na2O ratios are also listed for each completed synthesis in Table 3.
Liu, X. et al (2013)15, by using tetraethyl orthosilicate with aluminum chloride as a source of aluminum, noted that a decrease in the H2O/Na2O ratio led to the formation of a zeolite NaA and NaX mixture, but when this ratio was
increased from 20 to 30 or 40, only the pure NaA phase
was obtained. In our study, the pure zeolite A phase was synthesized by using a NaOH/metakaolin ratio of 0.5 and a H2O/Na2O ratio of 96. However, higher crystallinity was
obtained when this ratio was decreased to 48 in the synthesis P4ZA28H. This indicates that with H2O/Na2O ratios from
48 to 96, zeolite NaA may be obtained by using metakaolin with high and pure crystallinity. Thus, the use of diferent
sources of Si and Al should be studied to discover the best conditions for the synthesis of these materials.
Table 4: Empirical models that predict the synthesis of zeolite NaA as a function of crystallization time and NaOH/metakaolin ratio and
analysis of variance for the model presented. (NaOH/metakaolin = N and crystallization time = T).
Coded model 59.5 + 6.89.N – 4.74.N
2 + 11.10. T – 6.69. T2 – 3.65. N. T
Sum of squares Degrees of freedom Mean of squares F calculated
Regression 6,688.8 5 1,337.7 193.3
Residues 34,6 5 6.9
Total 6,723.4 10
Listed F5;5;0.95 = 5,05
Figure 5: Response surface for the completed tests.
P1ZA4H sample is not presented because it is an amorphous
material.
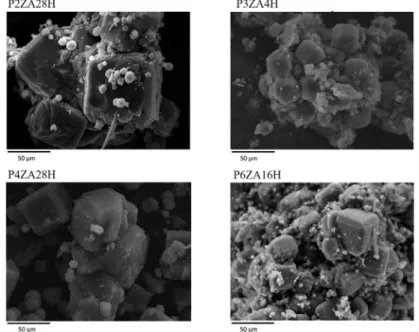
All synthesized samples show crystals with characteristic
morphology for zeolite NaA (i.e., cubic crystals). It can be observed using samples P3ZA4H and P6ZA16H that crystal
growth occurs over clusters of calcined kaolin, and in all samples, the zeolite A phase exhibits intra-crystalline growth. The
Figure 6: Micrographs of the synthesized samples from the statistical design.
sodalite phase identiied by DRX appears as spherical clusters
on the surface of the zeolite NaA crystals, and the size of these
sodalite clusters increased in samples P2ZA4H and P4ZA28H.
4. Conclusion
The increase in the NaOH/metakaolin ratio leads to the formation of a more crystalline zeolite NaA phase, but it also leads to an increase in the sodalite phase. The crystallization
time also has a positive inluence on the increase of crystallinity.
However, working with a low NaOH/metakaolin ratio, the increased time is favorable for the formation of zeolite A without the presence of the sodalite phase, with a relative
crystallinity value of 49.7%. The use of statistical design proved to be a good tool to evaluate diferent synthesis
conditions, determining domains in which the parameters of crystallization time and NaOH/metakaolin ratio can be optimized to obtain a pure NaA phase.
5. Acknowledgments
6. References
1. Costa E, De Lucas A, Uguina MA, Ruíz JC. Synthesis of 4A
zeolite from calcined kaolins for use in detergents. Industrial & Engineering Chemistry Research. 1998;27(7):1291-1296.
2. Rigo RT, Pergher SBC, Petkowicz DI, dos Santos JHZ. Um novo procedimento de síntese da zeólita A empregando argilas
naturais. Química Nova. 2009;32(1)21-25.
3. Rios CA, Williams CD, Fullen MA. Nucleation and growth history of zeolite LTA synthesized from kaolinite by two diferent
methods. Applied Clay Science. 2009;42(3-4):446-454.
4. Loiola AR, Andrade JCRA, Sasaki JM, da Silva LRD. Structural
analysis of zeolite NaA synthesized by a cost-effective hydrothermal method using kaolin and its use as water softener.
Journal of Colloid and Interface Science. 2012;367(1):34-39.
5. Liu H, Peng S, Shu L, Chen T, Bao T, Frost RL. Magnetic zeolite
NaA: Synthesis, characterization based on metakaolin and its application for the removal of Cu2+, Pb2+. Chemosphere.
2013;91(11):1539-1546.
6. Melo CR, Riella HG, Kuhnen NC, Angioletto E, Melo AR, Bernardin AM, et al. Synthesis of 4A zeolites from kaolin for obtaining
5A zeolites through ionic exchange for adsorption of arsenic.
Materials Science and Engineering: B. 2012;177(4):345-349.
7. Selim MM, El-Maksoud IHA. Hydrogenation of edible oil over
zeolite prepared from local kaolin. Microporous and Mesoporous Materials. 2004;74(1-3):79-85.
8. Alkan M, Hopa Ç, Yilmaz Z, Güler H. The efect of alkali concentration and solid/liquid ratio on the hydrothermal
synthesis of zeolite NaA from natural kaolinite. Microporous and Mesoporous Materials. 2005;86(1-3):176-184.
9. San Cristóbal AG, Castelló R, Martín Luengo MA, Vizcayno C. Zeolites prepared from calcined and mechanically modiied kaolins:
A comparative study. Applied Clay Science. 2010;49(3):239-246.
10. Chandrasekhar S, Pramada PN. Microwave assisted synthesis
of zeolite A from metakaolin. Microporous and Mesoporous Materials. 2008;108(1-3):152-161.
11. Maia AAB, Angélica RS, Neves RF. Use of industrial kaolin waste from the Brazilian Amazon region for synthesis of zeolite
A. Clay Minerals. 2011;46(1):127-136.
12. Fabbri B, Gualtieri S, Leonardi C. Modiications induced by the
thermal treatment of kaolin and determination of reactivity of metakaolin. Applied Clay Science. 2013;73:2-10.
13. Giannetto-Pace G, Rendón AM, Fuentes GR. Zeolitas: Características, propiedades y aplicaciones industriales. 2a
ed. Caracas: EdIT- Editora Innovación Tecnológica, Facultad de Ingeniería, UCV; 2000.
14. Wang CF, Li JS, Wang LJ, Sun XY. Inluence of NaOH concentrations on synthesis of pure-form zeolite A from ly
ash using two-stage method. Journal of Hazardous Materials.
2008;155(1-2):58-64.
15. Liu X, Wang Y, Cui X, He Y, Mao J. Inluence of synthesis
parameters on NaA zeolite crystals. Powder Technology.