1. Introduction
Tactical planning is a middle-level activity connecting strategic planning and operations control in which the basic problem to be solved is the allocation of resources (i.e., capacity, workforce availability, storage) over a medium-range planning horizon (Bushuev, 2014). At this planning level, project acceptance or rejection decisions are made (Giebels, 2000; Zorzini et al., 2008; Aslan et al., 2012) and adequate capacity planning methods that assess the consequences of these decisions for the production system are crucial (Giebels, 2000; Gademann & Schutten, 2005; Hans et al., 2007; Sawik, 2009; Montreuil et al., 2013). It is a common practice that organisations accept projects without sufficiently assessing the impact of incoming projects on the resource capacity, leading to the overload of resources and affecting delivery performance and the profitability of the production system (Hans et al., 2007).
The academic literature in this area presents a research–practice gap that translates into a lack of studies on the application of decision support tools to address tactical planning problems in real-world settings. This gap has been a recurrent theme in many papers (Buxey, 2003; 2005; Corti et al., 2006; Ramezanian et al., 2012; Sharda & Akiya, 2012; Jamalnia & Feili, 2013; Lingitz et al., 2013; Liu et al., 2013; Díaz-Madroñero et al., 2014). In a recent literature review, comprising 250 optimisation models for tactical production planning, Díaz-Madroñero et al. (2014) outlined that, although some proposals have been validated in real environments, very few are reported to be
An optimisation approach for capacity planning:
modelling insights and empirical findings from a
tactical perspective
Andréa Nunes Carvalhoa*, Luiz Felipe Scavardab**, Fabricio Oliveirab,c***
aInstituto Nacional de Tecnologia, Rio de Janeiro, RJ, Brasil bPontifícia Universidade Católica do Rio de Janeiro, Rio de Janeiro, RJ, Brasil
cRMIT, Melbourne, Australia
*[email protected], **[email protected], ***[email protected]
Abstract
The academic literature presents a research-practice gap on the application of decision support tools to address tactical planning problems in real-world organisations. This paper addresses this gap and extends a previous action research relative to an optimisation model applied for tactical capacity planning in an engineer-to-order industrial setting. The issues discussed herein raise new insights to better understand the practical results that can be achieved through the proposed model. The topics presented include the modelling of objectives, the representation of the production process and the costing approach, as well as findings regarding managerial decisions and the scope of action considered. These insights may inspire ideas to academics and practitioners when developing tools for capacity planning problems in similar contexts.
Keywords
Engineer-to-order. Aggregate production planning. Decision support system. Mathematical programming. Action research.
How to cite this article: Carvalho, A. N., Scavarda, L. F., & Oliveira, F. (2017). An optimisation approach for capacity planning: modelling insights and empirical findings from a tactical perspective. Production, 27, e20170014. DOI: http:// dx.doi.org/10.1590/0103-6513.001417
implemented and incorporated into the planning systems of the companies considered. This issue is particularly concerning in engineering-to-order (ETO) contexts where customers require reliable due dates as part of the service mix offered (Hans et al., 2007; Grabenstetter & Usher, 2014; Mourtzis et al., 2014).
To contribute to the fulfilment of this research-practice gap, Carvalho et al. (2015) presented the findings of a tactical capacity planning problem solution applied in a real-world ETO production setting using an optimisation model. As an extension of this former research, the current paper raises new insights in an attempt to better understand the practical results that can be achieved when implementing the proposed model. These new issues include the modelling of objectives, the representation of the production process and the costing approach, as well as empirical findings regarding managerial decisions and the scope of action considered when using the model. These insights may inspire ideas to academics and practitioners when developing tools for capacity planning problems in similar contexts. It is not the intention of this paper to discuss the mathematical formulation of the proposed model (which is already displayed in Carvalho et al., 2015), but rather add empirical matter for enriching the literature in this research area, thereby narrowing the gap between theory and practice.
The remainder of the paper is as follows. Section 2 offers an overview in ETO and in tactical planning in ETO. Section 3 briefly describes the planning problem and the research method adopted. Section 4 presents the main characteristics and assumptions of the deterministic model and the additional insights gained from this research project. The conclusions and research agenda are given in Section 5.
2. Theoretical background
This section provides a literature review in ETO, highlighting its main characteristics, and tactical planning in ETO, describing the challenges faced by the planners.
2.1. An overview in ETO
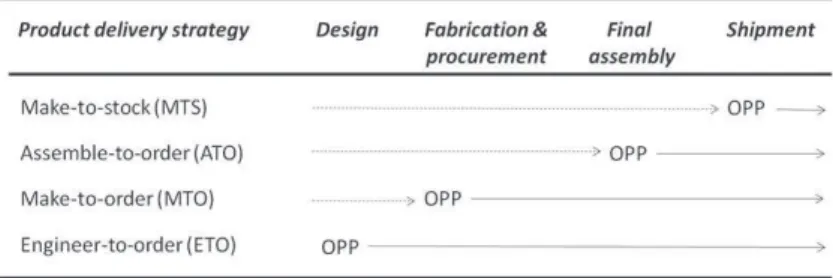
In their literature review, Gosling & Naim (2009) identified a lack of clarity concerning the appropriate terminology used to describe ETO supply chain type. Nevertheless, the authors concluded that the production flow in this context is driven by actual customer orders with the decoupling point (i.e., order penetration point - OPP) located at the design stage, as seen in Figure 1. Other expressions associated to this context are project manufacturing and multi-project organisations (Gademann & Schutten, 2005; Hans et al., 2007; Yang, 2013) where different projects are executed together competing for the same production resources (Herroelen & Leus, 2004; Chtourou & Haouari, 2008; Van de Vonder et al., 2008; Deblaere et al., 2011; Alfieri et al., 2011; 2012; Artigues et al., 2013).
ETO products have deep and complex structures, with many assembly levels, needing coordination with component supply (Hicks & Braiden, 2000; Cameron & Braiden, 2004; Alfieri et al., 2011; Gosling & Naim,
Figure 1. Product delivery strategies (adapted from Olhager, 2003).
main order winning characteristic in this context is fitness for purpose (Little et al., 2000). Hicks & Braiden (2000), Cameron & Braiden (2004), Grabenstetter & Usher (2014) and Willner et al. (2014) also highlighted that price, reduced lead times and delivery performance are important aspects of customer service as most contracts include financial penalties for late delivery.
In the customer enquiry stage, considered the most critical stage in the ETO context, a customer provides an invitation to tender for a specific product to prospective suppliers, requiring the determination of a price and due date (Aslan et al., 2012). These authors highlight that these decisions require: the estimation of lead times; archiving and retrieval of product data; assessment of available design/production skills and facilities; the estimation of costs/profit margins; and effective coordination and communication between all departments involved in the activities listed above. In this stage, there are often several phases of negotiation with suppliers that aim to match the overall project cost and lead-time with anticipated customer and market requirements (Hicks et al., 2000). Zorzini et al. (2008) define this as a multi-stage decision process, involving complex trade-offs and thus requiring inter-disciplinary teamwork, and preparing attractive and reliable bids is only possible with considerable expenditure in terms of time and other resources.
Due to complex production processes and long lead times, production often starts before the overall project design has been completed (Monostori et al., 2010). Management must rely on a rough estimation of the impact of an incoming order on resource utilisation and eventually must adjust capacity, as micro process planning (i.e., detailed technological planning of production activities that result in manufacturing instructions - Giebels, 2000) has not been performed yet (Zijm, 2000; Grabenstetter & Usher, 2014). Additionally, as the pattern of demand (i.e., in terms of the level and mix of work) fluctuates significantly over time, ETO companies cannot accurately forecast demand, neither order materials nor produce in advance (Powell et al., 2014). In this context, it is difficult to balance production due to the dynamic nature of constraints (Hicks & Braiden, 2000). Not surprisingly, the ETO context is associated with chaotic production in high complexity/ high uncertainty situations (Gosling & Naim, 2009). According to Thomé et al. (2016), complexity emerges from internal sources, originated from decisions and internal factors, supply/demand interface sources (e.g., material and information flows) and external sources (e.g., market trends). Moreover, these authors highlight that uncertainty depends on the novelty of projects, the availability of information and the experience of teams.
Nevertheless, project acceptance or rejection decisions must be made and due dates must be set. ETO customers require reliable due dates as part of the service mix offered, so being able to quote tight and reliable due dates is a major competitive advantage in this context (Hans et al., 2007; Grabenstetter & Usher, 2014; Mourtzis et al., 2014). In practice, order acceptance and capacity planning decisions are often functionally separated, according to Ebben et al. (2005) and Huang et al. (2011), since the sales department is responsible for order acceptance and the production department takes care of production and capacity planning. For instance, Monostori et al. (2010) affirm that project planners typically try to sequence activities as early as possible, relying on the conventional wisdom that it can never be wrong to get work done early.
2.2. Tactical planning in ETO
To deal with the planning complexity in ETO organisations, the planning process needs to be broken down into more manageable parts using a model for hierarchical planning and control based on three managerial decision levels (strategic, tactical, and operational - Hans et al., 2007). To adequately perform multi-project planning, projects must be considered simultaneously at all planning levels, while considering that those different levels have different objectives, constraints, degrees of aggregation, and capacity flexibility.
In a positioning framework, Giebels (2000) details these three levels into three categories: technological, company management, and production planning (see Figure 2). The author highlights that there are many different planning functions to be performed on the higher levels of production planning that are denominated capacity planning and distinguishes long-term capacity planning to decide on investments in capacity expansion on the basis of market expectations (e.g., Leiras et al., 2010; Oliveira et al., 2015), capacity planning in the order acceptance phase, and resource loading (e.g., Mestry et al., 2011; Lingitz et al., 2013), thus enabling feasible lower-level schedules, already in the operational level (e.g., Ribas et al., 2012; Carvalho et al., 2014).
In a recent literature review on mathematical models for mid-term capacity planning, Carvalho et al. (2015) identified only seven out of 33 papers explicitly addressing the ETO or multi-project environment. This is in accordance with Gosling & Naim (2009) and Yang (2013) that highlighted that ETO contexts have received much less attention from the researchers when compared to standardised make-to-stock contexts. Moreover, within the revised papers that address the ETO or multi-project context, in Carvalho et al. (2015), only one concerns the order acceptance phase (i.e., workload analysis and due date setting).
Ideally, tactical capacity planning methods should use capacity flexibility (nonregular capacity) to support the planner in making a trade-off between the expected delivery performance and the expected costs of exploiting this flexibility (Hans et al., 2007). In Carvalho et al. (2015)´s review, in terms of the use of nonregular capacity options, only a few papers consider changes in workforce level, whereas changes in production capacity are generally modelled through the use of overtime or subcontracting. Moreover, the research studies that address the ETO or the multi-project context in this review seem not to completely explore this kind of working time flexibility.
When modelling a planning problem at an aggregate level (e.g., tactical level) to achieve a manageable problem, the representation of the production flow may require the aggregation of processing stages and the representation of the precedence relationship among these stages. Under this topic, most of the reviewed research studies in Carvalho et al. (2015) refer to multiple aggregate activities and make use of the finish-to-start precedence constraints. Moreover, the models that adopt variable intensity activities and feeding precedence relationships refer to ETO or project-oriented contexts. Nevertheless, there is always a trade-off between the model complexity and its accuracy in capturing the relevant issues of the production planning environment (Nam & Logendran, 1992) and the way that aggregate activities are built is crucial to the feasibility and quality of the production plans (Monostori et al., 2010).
Finally, there is a research stream that has addressed attention towards increasing the robustness of planning methods by incorporating uncertainties to them. In this direction, robust optimisation approaches have been developed to enhance the planning systems (e.g., Leiras et al., 2010; Alem & Morabito, 2012; Fernandes et al., 2016). In fact, as the problem presented within this paper is characterized by different sources of uncertainty, this action research has been extended in this direction in Carvalho et al. (2016), which presents a robust optimisation formulation of the studied problem.
3. Problem description and research method
This section characterizes the real-world industry problem faced by the manufacturing planning team and the research method adopted by the researchers to solve the tactical capacity planning problem.
3.1. Problem description
The company considered is a medium-sized project-driven organisation that produces high valued customized equipment with complex structures, such as high pressure boilers and sophisticated reactors. The production system is organized into five work centres that correspond to the major manufacturing processes (cutting, stamping, machining, assembly and welding), which require a skilled, dedicated, and expensive human workforce.
In this company’s tactical planning process, customers’ demands, including not-yet-confirmed orders, are confronted with the available shop floor production capacity to balance demand along the planning horizon.
During this process, the manufacturing planning team is faced with questions such as: is it possible to accept a particular set of projects given the burden of already committed orders? How much would it cost to manufacture this set of projects? Can due dates imposed by the customers be met? Would it be necessary to hire personnel? Are overtime hours needed? Which part components could be subcontracted?
In other words, the manufacturing planning team must determine if a new order should/could be accepted based on the available capacity, decide on the usage of nonregular capacity and estimate production costs. Attempting to answer these questions, this team manually creates an aggregate production plan to define what demands will be processed and in which time periods. Since information is not accurate nor detailed in this planning stage, as product designs have not yet been conceived, management makes use of rough data, based on historical information on former projects. This is done to estimate processing times to define milestones and due dates for these potential incoming projects. Moreover, the current planning method adopted is a time-consuming scenario-building process that permits the development of just few alternative plans with no thorough cost analysis. In addition, capacity is not disaggregated among the production processes, making it difficult to define a plan for a specific workforce.
3.2. Research method
The researchers aim to create practical outcomes while confronting existing theory with issues found in real-world industrial contexts. The attempt is to develop solutions that are valuable to those involved in the research and simultaneously generate theoretical knowledge. For instance, the studied problem approach is exploratory in which actions and results interact and are mingled in practice. Therefore, the action research method was considered an appropriate alternative to direct this research study. This method considers more than actions: it is participatory, it occurs simultaneously with the action, and it is a sequence of events and approaches used to solve problems (Coughlan & Coghlan, 2002). The goal is to uncover problems while exploring the process of modelling and implementing a tactical capacity planning solution in an ETO context.
Over an 18-month period, the researchers interacted with the company manufacturing team to gather information and gradually develop the proposed planning model. This was done according to an incremental development approach, as adopted in the action research developed by Carvalho et al. (2014).
During this period, the researchers made four technical visits to the industrial site. In the first visit, the researchers validated assumptions gathered from literature relative to the ETO context and the manufacturing planning team presented their planning methods, from the tactical to the operational level. In between the first and the second visit, a literature review on tactical planning issues was conducted to gain new insights on how to contribute to improve the company’s methods.
The objective of the second visit was to define the problem scope within tactical planning that would be addressed in the action research. A semi-structured interview to identify the core problem to be studied was conducted. This data collection technique offers a balance between the focus of a structured survey and the flexibility of an open-ended interview. This was essential to uncover qualitative data on the personal experience of the manufacturing planning team and to explore and clarify the research domain.
From this second visit, it became clear that the workload analysis (i.e., the planning function that attempts to generate a production plan by levelling demand to the available capacity) in the order acceptance phase was the major issue to be addressed. The studied problem was then formulated as a mixed-integer linear programming (MILP) model. This was useful to gain insights about the structure of the problem, especially to uncover the hard and soft constraints, and to describe it in a common language in mathematical terms. The MILP formulation also enabled a quick prototyping process, as issues could be easily incorporated into the model and validated by the company´s team. Additionally, there are many off-the shelf commercial (and open-source) solvers available that do not demand further knowledge from the users to execute a MILP model. This was considered an advantage by the research team. Therefore between the second and the third visits, a literature review was conducted on mathematical models used for tactical planning problems to gain insights on how to represent the studied planning problem. In parallel, the first version of the proposed mathematical model was developed using Aimms 3.13.
4. The proposed model and its application: characteristics and empirical insights
This section describes the deterministic mathematical programming model that addresses the tactical capacity planning problem described before. The mathematical formulation is described in Carvalho et al. (2015) and presented in a summarised way in the Appendix A of this paper. Herein, the main characteristics and assumptions of the proposed deterministic model and additional insights are presented to enrich the discussion on this real-world industry case.
4.1. Main characteristics and assumptions
The proposed solution is a tactical capacity planning MILP model that can be used as a decision support tool in the order acceptance phase by optimally balancing demand with the available capacity and providing information for an eventual bid preparation. It is a cost minimisation formulation of an ETO production system that provides an optimal production plan, subject to several problem-related constraints.
As this is a multi-project planning problem, demand corresponds to the already committed workload and to new projects that compete for the same resources. In practice, in a rolling horizon approach, the committed workload refers to an existing plan of confirmed orders that is updated and extended with new projects. The committed workload is assigned to the time periods originally planned. Additionally, each new project has its own negotiated release date (the earliest starting time) and the customer’s deadline. As this is a time-driven planning approach, one of the model’s assumptions is that backlogging is not allowed and, therefore, deadlines must be met.
Each project consists of a set of components that have specific time windows defined within the project’s release date and deadline. A component comprises a set of activities and each activity can be regarded as an aggregation of operations or processing steps within the same type of production process. Furthermore, each work center comprehends the production resources (i.e., machines and tools) within a type of production process. Therefore, activities may be allocated to work centres in an aggregate level of production planning that is coherent to the tactical planning level. In this sense, the proposed model admits, even in this aggregate level, the representation of a production flow with multiple processing stages.
An activity usually takes several months to be completed. Furthermore, its execution progress mode varies along the time periods. For instance, in this specific problem, an activity typically starts in a low-intensity level mode that increases to a maximum level and then it decreases until it is finally completed. The fraction of an activity done in a time period t is called the intensity of the activity in time period t. Hence, the intensity of an activity is at most one, and the sum of intensities of an activity sums up to one. Usually, there is a limitation on the maximum intensity that may be completed in a single time period and a minimum intensity to guarantee that a project is executed with no interruptions. To represent this issue, the model makes use of the variable intensity activities formulation, which means that each activity may vary its intensity over time until it is completely done.
Activities are interconnected as they represent a sequence of multiple processing stages. Furthermore, activities overlap in time successively, particularly in the production of complex components. Additionally, each activity has its own pace but depends on the evolution of the others that are interconnected. The cadence (i.e., the rhythm) of the production flow as a whole is determined by milestones (i.e., reference points that indicate the completion of phases within a project’s execution).
In terms of internal capacity, the availability of working hours per period per work centre is proportional to the number of employees allocated in each work centre. Average workforce productivity is considered to define the processing times for the activities. Furthermore, the proposed model admits the use of capacity flexibility by considering nonregular capacity alternatives. In this sense, the availability of working hours may be modified using an overtime working shift or by hiring or firing personnel. To minimize capacity changes though, the model considers a minimum employment period that restricts dismissing personnel before this period of time and associates a capacity change cost proportional to the number of employees hired or fired.
Besides the internal capacity, the model also considers external resources through subcontracting, which may incur in higher production costs. These external resources do not have a capacity limitation. One of the model’s assumptions is that a component is either all subcontracted (all of its activities are performed externally) or all performed internally. Furthermore, not all components may be subcontracted for several reasons, and this restriction is input information in the model.
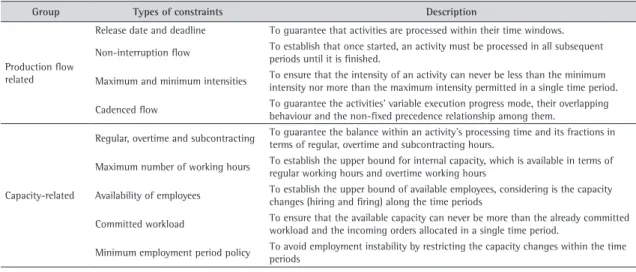
considering the rhythm of the production flow. The second one includes constraints that refer to the bounds for internal and external capacities. Table 1 summarizes these constraints which are detailed in Carvalho et al. 2015.
As this is a cost minimisation optimisation model, several cost parameters are considered to calculate the overall production costs. As there might be a significant variation in terms of costs among the production processes, each work centre has its specific hourly production processing cost (relative to the effective use of
Table 1. Types of constraints.
Group Types of constraints Description
Production flow related
Release date and deadline To guarantee that activities are processed within their time windows.
Non-interruption flow To establish that once started, an activity must be processed in all subsequent periods until it is finished.
Maximum and minimum intensities To ensure that the intensity of an activity can never be less than the minimum intensity nor more than the maximum intensity permitted in a single time period.
Cadenced flow To guarantee the activities’ variable execution progress mode, their overlapping behaviour and the non-fixed precedence relationship among them.
Capacity-related
Regular, overtime and subcontracting To guarantee the balance within an activity’s processing time and its fractions in terms of regular, overtime and subcontracting hours.
Maximum number of working hours To establish the upper bound for internal capacity, which is available in terms of regular working hours and overtime working hours
Availability of employees To establish the upper bound of available employees, considering is the capacity changes (hiring and firing) along the time periods
Committed workload To ensure that the available capacity can never be more than the already committed workload and the incoming orders allocated in a single time period.
Minimum employment period policy To avoid employment instability by restricting the capacity changes within the time periods
production resources, involving energy and lubricant consumption costs) and overtime cost as well as an average salary (which effectively represents the differences between the lower and higher salary values in a specific work centre). On the other hand, for simplification purposes, a fixed capacity change cost is considered to estimate the cost of hiring and firing employees, regardless of the affected employees’ backgrounds (e.g., salary, benefits, rights, employment contract, working shift, etc.).
4.2. New insights on the model’s development and implementation
This subsection offers new insights regarding the development and application of the proposed model in a real-world ETO industrial setting. The aim is to provide useful theoretical guidance for advancing practice. In this action research, the validation of the model by the company’s planning team brought a better comprehension on five relevant issues: (i) the selection and prioritisation of objectives, (ii) the representation of the production process with flexibility, (iii) the marginal costing framework adopted, (iv) the decision process framework and (v) the scope of action of the proposed model. These issues are discussed in the next subsections.
4.2.1. Selection and prioritisation of objectives
An important part of the development of the proposed tactical capacity planning model was the determination and prioritisation of the objectives to be sought, as they were multiple. At the beginning of this research project, the planning team highlighted that they desired a plan that would result in a minimum overall production cost and in the fulfilment of due dates. They were also concerned about the capacity changes, as they agreed that it would be better for the company to retain employees and minimize turnovers. Additionally, there seemed to be some doubt about subcontracting components. They agreed that in some cases it could be an advantageous option, but they also admitted that it could be a risky choice in other cases. Although the planning team knew what was desirable, they were not able to precisely formulate the policies for the planning model.
was included to retain employees for a predefined number of periods. As for subcontracting, sets of constraints were incorporated to represent the company’s policies regarding this issue (e.g., business rules that specified which activities should necessarily be processed in-house).
4.2.2. Representation of the production process with flexibility
In the studied company, the tactical capacity planning process must start before the project design of incoming orders has been completed. Therefore, management must rely on rough data to estimate the impact of these new demands on resource utilisation. In this process, the company’s planning team refers to milestones, which represent reference points that indicate the completion of phases within a project’s execution. In general, the milestones would refer to periods of time (i.e., a milestone was defined for each month). Therefore, a project with an 8 month-time window would have 8 milestones. This is how the planning team dealt originally with the representation of the production process for tactical planning purposes.
On the other hand, when this research project started, new insights were gained concerning how to enhance this representation. It became evident that depending on the shop floor´s overall workload, the intensity of each project would vary in time. Eventually, in some time periods, the activities would be developed in an increased rhythm to compensate some previous delay. In this sense, in the proposed model, milestones were no longer associated with time periods. This modification gave flexibility when balancing demand with the available capacity. To implement and validate the model, the original milestones were used as the starting point. Using linear regression, other milestones were calculated to define the process rhythm in a more accurate form.
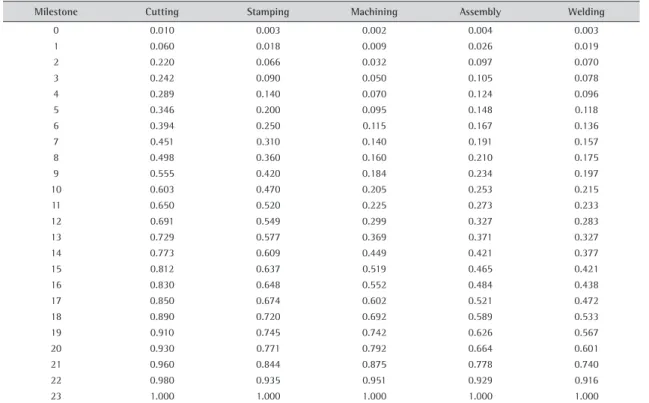
Table 2 presents the historical data relative to the cadence of the production process of one of the company’s former projects. In this example, at each milestone, the accumulated intensity of five interconnected activities (cutting, stamping, machining, assembly and welding) of a given component is displayed. This component had originally eight milestones. The other 15 (i.e., a total of 23 is displayed in Table 2) were included in the real-world database to validate the proposed model. In this example, if the workload processed relative to the cutting stage ranges from 55% to 60% (i.e., between milestones 9 and 10), this means that 42 to 47% of stamping, 18 to 20% of machining, 23 to 25% of assembly and 19 to 21% of welding must be concluded.
Table 2. Cadence data – Accumulated intensities (data provided by the company).
Milestone Cutting Stamping Machining Assembly Welding
0 0.010 0.003 0.002 0.004 0.003
1 0.060 0.018 0.009 0.026 0.019
2 0.220 0.066 0.032 0.097 0.070
3 0.242 0.090 0.050 0.105 0.078
4 0.289 0.140 0.070 0.124 0.096
5 0.346 0.200 0.095 0.148 0.118
6 0.394 0.250 0.115 0.167 0.136
7 0.451 0.310 0.140 0.191 0.157
8 0.498 0.360 0.160 0.210 0.175
9 0.555 0.420 0.184 0.234 0.197
10 0.603 0.470 0.205 0.253 0.215
11 0.650 0.520 0.225 0.273 0.233
12 0.691 0.549 0.299 0.327 0.283
13 0.729 0.577 0.369 0.371 0.327
14 0.773 0.609 0.449 0.421 0.377
15 0.812 0.637 0.519 0.465 0.421
16 0.830 0.648 0.552 0.484 0.438
17 0.850 0.674 0.602 0.521 0.472
18 0.890 0.720 0.692 0.589 0.533
19 0.910 0.745 0.742 0.626 0.567
20 0.930 0.771 0.792 0.664 0.601
21 0.960 0.844 0.875 0.778 0.740
22 0.980 0.935 0.951 0.929 0.916
4.2.3. Variable (marginal) costing for decision-making
The proposed model does not fill the role of a standard costing system, although its objective function refers to costs. It was developed according to a marginal costing framework, where only variable costs are used to make decisions. In this sense, fixed costs are not considered, since they are assumed to be associated with the periods of time in which they were incurred.
In the data gathering process to prepare the real-world database used to validate the model, it was not an easy task to separate all costs into fixed and variable costs when referring to manufacturing overhead costs, especially since in the long run all costs are variable. All direct costs are clearly variable costs. On the other hand, some of the manufacturing indirect costs may be partially fixed and partially variable from a midterm planning perspective. For instance, costs with lubricants for machines were considered as variable costs, whereas the supervisor´s wages were defined as fixed.
Carvalho et al. (2015) present a real-world application case with additional scenarios that were simulated to support the decision making. The marginal costing framework adopted revealed its usefulness for the evaluation of some types of decisions. For instance, it was helpful for deciding whether to manufacture an item in-house or to subcontract it; to accept a new incoming demand or to postpone a particular project.
4.2.4. The decision process
The proposed model permits an iterative and interactive decision process as it allows the planning team to (i) intervene in the construction of the production plans with managerial decisions, (ii) generate alternative scenarios (plans) and (iii) assess these plans in terms of a set of performance measures. The managerial decisions are used to generate concurrent new analysis within the tactical planning process and they affect the generated plans in at least three different ways: in defining how much, where and when to manufacture. When planners adjust the cadence parameters, the decision affects how much to do in a particular time period. When the planners subcontract a component, this modification affects where to manufacture. Finally, when the planners adjust release dates for a particular project, it changes the order of execution of the projects, for example.
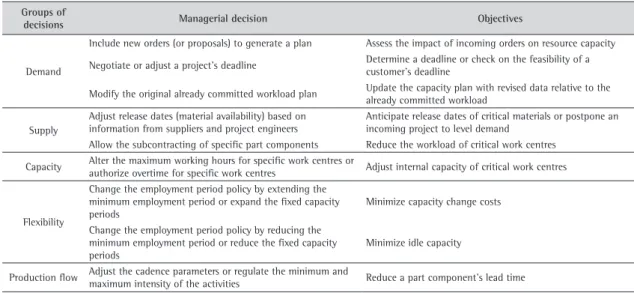
In other words, these decisions reveal how the planners intend to use the available capacity to fulfil demands. More specifically, they represent changes in the input data. In this sense, along with the model’s implementation process, a framework was conceived to clarify the types of decisions to be considered and propose their relationships with a set of objectives. For instance, decisions may refer to actions regarding demand, supply (availability of materials), the usage of capacity, the exploitation of flexibility and the production flow. Table 3 presents this conceptual framework for the managerial decisions considered within this research project.
Table 3. Managerial decisions.
Groups of
decisions Managerial decision Objectives
Demand
Include new orders (or proposals) to generate a plan Assess the impact of incoming orders on resource capacity
Negotiate or adjust a project’s deadline Determine a deadline or check on the feasibility of a customer’s deadline
Modify the original already committed workload plan Update the capacity plan with revised data relative to the already committed workload
Supply
Adjust release dates (material availability) based on information from suppliers and project engineers
Anticipate release dates of critical materials or postpone an incoming project to level demand
Allow the subcontracting of specific part components Reduce the workload of critical work centres
Capacity Alter the maximum working hours for specific work centres or
authorize overtime for specific work centres Adjust internal capacity of critical work centres
Flexibility
Change the employment period policy by extending the minimum employment period or expand the fixed capacity periods
Minimize capacity change costs
Change the employment period policy by reducing the minimum employment period or reduce the fixed capacity periods
Minimize idle capacity
Production flow Adjust the cadence parameters or regulate the minimum and
4.2.5. The scope of action
In former years, the company employed a lead demand strategy (i.e., introducing capacity to meet forecasted demand) and committed to an investment in a higher level of capacity to facilitate later expansion. At the time, there were capital expenditure efficiencies gained by constructing a larger infrastructure and acquiring additional machinery. Clearly, there was some risk involved in committing the necessary capital expenditure before the demand was certain. This strategy is frequently employed in growing markets to ensure that the operation is likely to be able to meet demand.
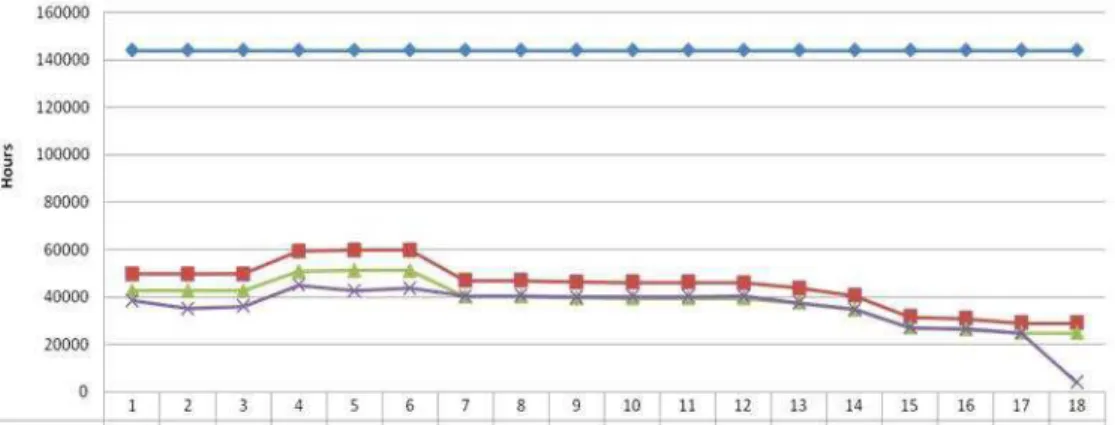
From the results obtained from the proposed model, it was concluded that production resources are now under-utilised when considering the physical facility capacity. This can be seen in Figure 3, which compares the total current demand (i.e., committed workload, committed new projects and proposals) with the total internal capacity, considering the capacity flexibility options inherent to this planning problem. The maximum capacity is the maximum load capacity or physical facility capacity, which represents the potential usage of all infrastructure, machinery and process technology available.
Figure 3. Current demand and the internal capacity option.
Even though the proposed model allows the visualisation of the impact of strategic decisions, it will not be used to solve capacity planning issues that are at higher managerial levels in the studied setting. In this sense, although the expansion of physical facility is an important decision within aggregate capacity planning and that this decision could be supported by the proposed model, the company’s team aimed at a tactical level planning activity. In other words, their scope of action refers to capacity flexibility options such as the usage of overtime and the adjustment of the number of employees.
5. Conclusion
The findings of a tactical capacity planning model, based on optimisation techniques, applied in a real-world ETO production setting are presented in Carvalho et al. (2015). The current paper extends this research study by presenting the main characteristics and assumptions of the proposed model and discussing additional insights gained along its implementation in a real-world context. The objective is to contribute to literature by narrowing the gap between theory and practice with respect to the development and application of decision support tools for tactical capacity planning functions, especially for ETO organisations.
objective function. Another issue refers to the representation of the production process, which was originally realised using milestones corresponding to the periods in time. This representation was enhanced by dissociating milestones from periods in time. This modification gave flexibility when balancing demand with the available capacity. Finally, the third issue concerns the comprehension that although the model´s objective function refers to costs, it did not need to fill the role of a standard costing system. The marginal costing framework adopted revealed its usefulness for the evaluation of the managerial decisions considered within the problem. In this sense, only variable costs should be considered to support decision-making.
Throughout the application of the proposed model, the decision process evolved to an interactive and iterative process where changes could be made to generate alternative scenarios. These changes were organized in a conceptual framework that clarified the relationships among the objectives pursued. Moreover, when assessing the impacts of previous strategic arrangements on the capacity plans, the planning team confirmed the extension or sphere of action to be relative to mid-term decisions. In this sense, it became evident that the model would not be used to solve capacity planning issues that are at higher managerial levels.
The insights gained from this action research may be limited to a certain extent as it provides evidence from a single firm. On the other hand, although there is this limitation, the authors believe that these insights may inspire ideas to academics and practitioners when developing or deploying mathematical models that support decision makers to solve middle-level capacity planning problems in ETO contexts.
5.1. Research agenda
As comparable empirical studies in the literature are still rare, the present study contributes to the still scant body of empirical knowledge on tactical capacity planning in ETO production settings. Future studies may want to make a more systematic and focused investigation to test and expand on our findings to fill the theory and practice gap in this area. This research could be extended in several ways.
For instance, an important question remains as to what extent the proposed solution is applicable in other contexts. It would be interesting to investigate whether it fits other ETO production settings or even the MTO context, particularly in situations that lack information in the order acceptance phase. In this sense, it would be necessary to check if the modelling issues considered in this research adequately represent these contexts or if new relevant aspects need to be analyzed and modelled.
In addition, more efficient MILP formulations could be developed, an issue that was not one of the priorities in this action research. The problem instance analyzed in Carvalho et al. (2015) comprised approximately 30.000 variables (18.000 integer variables) and almost 130.000 constraints and resulted in a solution time of 1000 seconds. If the problems increase in size and complexity, it may be crucial to seek more efficient formulations.
Another aspect which deserves further investigation refers to the choice of the objective goal of the proposed models (which minimize the overall production cost). In the setting under study, the company’s manufacturing planning team has little information on the projects’ prices, which made it difficult to adopt an objective goal that would maximize profit. On the other hand, minimizing costs without precisely knowing which resources are the production system’s bottlenecks may result in profit losses. In this sense, to address this shortcoming, the proposed solution could be extended by adopting the concepts of throughput accounting in the Theory of Constraints (e.g., Sinisgalli et al., 2009).
The development of a user-friendly interface to transform the model into a computational planning system for the company´s manufacturing planning team seems to be another logical next step in further research. Within this direction, one relevant issue refers to the availability, reliability and integrity of information as well as the good use of information technology. For instance, in the studied setting, information is stored in different locations and in different formats and may not be easily available. To ensure the acquisition of all relevant data from these locations, it may be necessary to define communication protocols between information systems.
Acknowledgements
The authors gratefully acknowledge all of the managers and employees of the medium-sized multi-project organisation for their invaluable assistance with this research project. The authors are also very grateful to the anonymous referees for their constructive suggestions, to the Instituto Nacional de Tecnologia (INT) (2011-2015) and to the research agencies Conselho Nacional de Desenvolvimento Científico e Tecnológico (CNPq) (313181/2014-4) and (426395/2016-6), Coordenação de Aperfeiçoamento de Pessoal de Nível Superior (CAPES) and Alexander von Humboldt Foundation (AvH) – (BEX 8221/14-6) for their support.
References
Alem, D., & Morabito, R. (2012). Production planning in furniture settings via robust optimization. Computers & Operations Research, 39(2), 139-150. http://dx.doi.org/10.1016/j.cor.2011.02.022.
Alfieri, A., Tolio, T., & Urgo, M. (2011). A project scheduling approach to production planning with feeding precedence relations. International Journal of Production Research, 49(4), 995-1020. http://dx.doi.org/10.1080/00207541003604844.
Alfieri, A., Tolio, T., & Urgo, M. (2012). A two-stage stochastic programming project scheduling approach to production planning. International Journal of Advanced Manufacturing Technology, 62(1-4), 279-290. http://dx.doi.org/10.1007/s00170-011-3794-4. Artigues, C., Leus, R., & Nobibon, F. (2013). Robust optimization for resource-constrained project scheduling with uncertain activity
durations. Flexible Services and Manufacturing Journal, 25(1-2), 175-205. http://dx.doi.org/10.1007/s10696-012-9147-2. Aslan, B., Stevenson, M., & Hendry, L. (2012). Enterprise Resource Planning systems: an assessment of applicability to Make-To-Order
companies. Computers in Industry, 63(7), 692-705. http://dx.doi.org/10.1016/j.compind.2012.05.003.
Bushuev, M. (2014). Convex optimization for aggregate production planning. International Journal of Production Research, 52(4), 1050-1058. http://dx.doi.org/10.1080/00207543.2013.831998.
Buxey, G. (2003). Strategy not tactics drives aggregate planning. International Journal of Production Economics, 85(3), 331-346. http:// dx.doi.org/10.1016/S0925-5273(03)00120-8.
Buxey, G. (2005). Aggregate planning for seasonal demand: reconciling theory with practice. International Journal of Operations &
Production Management, 25(11), 1083-1100. http://dx.doi.org/10.1108/01443570510626907.
Cameron, N. S., & Braiden, P. M. (2004). Using business process re-engineering for the development of production efficiency in companies making engineered to order products. International Journal of Production Economics, 89(3), 261-273. http://dx.doi. org/10.1016/S0925-5273(02)00448-6.
Carvalho, A. N., Oliveira, F., & Scavarda, L. F. (2015). Tactical capacity planning in a real-world ETO industry case: an action research. International Journal of Production Economics, 167, 187-203. http://dx.doi.org/10.1016/j.ijpe.2015.05.032.
Carvalho, A. N., Oliveira, F., & Scavarda, L. F. (2016). Tactical capacity planning in a real-world ETO industry case: a robust optimization approach. International Journal of Production Economics, 180, 158-171. http://dx.doi.org/10.1016/j.ijpe.2016.07.019.
Carvalho, A. N., Scavarda, L. F., & Lustosa, L. J. (2014). Implementing finite capacity production scheduling: lessons from a practical case. International Journal of Production Research, 52(4), 1215-1230. http://dx.doi.org/10.1080/00207543.2013.848484. Chtourou, H., & Haouari, M. (2008). A two-stage-priority-rule-based algorithm for robust resource-constrained project scheduling.
Computers & Industrial Engineering, 55(1), 183-194. http://dx.doi.org/10.1016/j.cie.2007.11.017.
Corti, D., Pozzetti, A., & Zorzini, M. (2006). A capacity-driven approach to establish reliable due dates in a MTO environment. International Journal of Production Economics, 104(2), 536-554. http://dx.doi.org/10.1016/j.ijpe.2005.03.003.
Coughlan, P., & Coghlan, D. (2002). Action research for operations management. International Journal of Operations & Production Management, 22(2), 220-240. http://dx.doi.org/10.1108/01443570210417515.
Deblaere, F., Demeulemeester, E., & Herroelen, W. (2011). Proactive policies for the stochastic resource-constrained project scheduling problem. European Journal of Operational Research, 214(2), 308-316. http://dx.doi.org/10.1016/j.ejor.2011.04.019.
Díaz-Madroñero, M., Mula, J., & Peidro, D. (2014). A review of discrete-time optimization models for tactical production planning. International Journal of Production Research, 52(17), 5171-5205. http://dx.doi.org/10.1080/00207543.2014.899721.
Ebben, M. J. R., Hans, E. W., & Weghuis, F. M. O. (2005). Workload based order acceptance in job shop environments. OR-Spektrum, 27(1), 107-122. http://dx.doi.org/10.1007/s00291-004-0171-9.
Fernandes, B., Street, A., Valladão, D., & Fernandes, C. (2016). An adaptive robust portfolio optimization model with loss constraints based on data-driven polyhedral uncertainty sets. European Journal of Operational Research, 255(3), 961-970. http://dx.doi. org/10.1016/j.ejor.2016.05.038.
Gademann, N., & Schutten, M. (2005). Linear-programming-based heuristics for project capacity planning. IIE Transactions, 37(2), 153-165. http://dx.doi.org/10.1080/07408170590885611.
Giebels, M. (2000). EtoPlan a concept for concurrent manufacturing planning and control: building holarchies for manufacture-to-order environments (PhD thesis). University of Twente, Enschede.
Gosling, J., & Naim, M. (2009). Engineer-to-order supply chain management: a literature review and research agenda. International Journal of Production Economics, 122(2), 741-754. http://dx.doi.org/10.1016/j.ijpe.2009.07.002.
Grabenstetter, D., & Usher, J. (2014). Developing due dates in an engineer to order engineering environment. International Journal of Production Research, 52(21), 6349-6361. http://dx.doi.org/10.1080/00207543.2014.940072.
Herroelen, W., & Leus, R. (2004). Robust and reactive project scheduling: a review and classification of procedures. International Journal of Production Research, 42(8), 1599-1620. http://dx.doi.org/10.1080/00207540310001638055.
Hicks, C., & Braiden, P. M. (2000). Computer-aided production management issues in the engineer-to-order production of complex capital goods explored using a simulation approach. International Journal of Production Research, 38(18), 4783-4810. http://dx.doi. org/10.1080/00207540010001019.
Hicks, C., McGovern, T., & Earl, C. F. (2000). Supply chain management: a strategic issue in engineer-to-order manufacturing. International Journal of Production Economics, 65(2), 179-190. http://dx.doi.org/10.1016/S0925-5273(99)00026-2.
Huang, S., Lu, M., & Wan, G. (2011). Integrated order selection and production scheduling under MTO strategy. International Journal of Production Research, 49(13), 4085-4101. http://dx.doi.org/10.1080/00207543.2010.496797.
Ishii, N., Takano, Y., & Muraki, M. (2014). An order acceptance strategy under limited engineering man-hours for cost estimation in Engineering-Procurement-Construction projects. International Journal of Project Management, 32(3), 519-528. http://dx.doi. org/10.1016/j.ijproman.2013.07.009.
Jamalnia, A., & Feili, A. (2013). A simulation testing and analysis of aggregate production planning strategies. Production Planning & Control. The Management of Operations, 24(6), 423-448.
Leiras, A., Elkamel, E., & Hamacher, S. (2010). Strategic planning of integrated multirefinery networks: a robust optimization approach based on the degree of conservatism. Industrial & Engineering Chemistry Research, 49(20), 9970-9977. http://dx.doi.org/10.1021/ ie100919z.
Lingitz, L., Morawetz, C., Gigloo, D. T., Minner, S., & Sihn, W. (2013). Modelling of flexibility costs in a decision support system for midterm capacity planning. Procedia CIRP, 7, 539-544. http://dx.doi.org/10.1016/j.procir.2013.06.029.
Little, D., Rollins, R., Peck, M., & Porter, J. K. (2000). Integrated planning and scheduling in the engineer-to-order sector. International Journal of Computer Integrated Manufacturing, 13(6), 545-554. http://dx.doi.org/10.1080/09511920050195977.
Liu, J., Lin, Z., Chen, Q., Mao, N., & Chen, X. (2013). A decision support to assign mould due date at customer enquiry stage in computer-integrated manufacturing (CIM) environments. International Journal of Computer Integrated Manufacturing, 26(6), 571-582. http:// dx.doi.org/10.1080/0951192X.2012.749526.
Mestry, S., Damodaran, P., & Chen, C. (2011). A branch and price solution approach for order acceptance and capacity planning in make-to-order operations. European Journal of Operational Research, 211(3), 480-495. http://dx.doi.org/10.1016/j.ejor.2011.01.002. Monostori, L., Erdos, G., Kadar, B., Kis, T., Kovacs, A., Pfeiffer, A., & Vancza, J. (2010). Digital enterprise solution for integrated production
planning and control. Computers in Industry, 61(2), 112-126. http://dx.doi.org/10.1016/j.compind.2009.10.008.
Montreuil, B., Labarthe, O., & Cloutier, C. (2013). Modelling client profiles for order promising and delivery. Simulation Modelling Practice and Theory, 35, 1-25. http://dx.doi.org/10.1016/j.simpat.2013.03.003.
Mourtzis, D., Doukas, M., Fragou, K., Efthymiou, K., & Matzorou, V. (2014). Knowledge-based estimation of manufacturing lead time for complex engineered-to-order products. In Proceedings of the 47th CIRP Conference on Manufacturing Systems; Procedia CIRP 17, Ontario, Canada.
Nam, S. J., & Logendran, R. (1992). Aggregate production planning: a survey of models and methodologies. European Journal of Operational Research, 61(3), 255-272. http://dx.doi.org/10.1016/0377-2217(92)90356-E.
Olhager, J. (2003). Strategic positioning of the order penetration point. International Journal of Production Economics, 85(3), 319-329. http://dx.doi.org/10.1016/S0925-5273(03)00119-1.
Oliveira, F. L. C., Souza, R. C., & Marcato, A. L. M. (2015). A time series model for building scenarios trees applied to stochastic optimisation. Electrical Power and Energy Systems, 67, 315-323. http://dx.doi.org/10.1016/j.ijepes.2014.11.031.
Pandit, A., & Zhu, Y. (2007). An ontology-based approach to support decision-making for the design of ETO (Engineer-To-Order) products. Automation in Construction, 16(6), 759-770. http://dx.doi.org/10.1016/j.autcon.2007.02.003.
Powell, D., Strandhagen, J., Tommelein, I., Ballard, G., & Rossi, M. (2014). A new set of principles for pursuing the lean ideal in Engineer-to-Order manufacturers. In Proceedings of the 47th CIRP Conference on Manufacturing Systems, Procedia CIRP 17, Ontario, Canada. Ramezanian, R., Rahmani, D., & Barzinpour, F. (2012). An aggregate production planning model for two phase production systems:
solving with genetic algorithm and tabu search. Expert Systems with Applications, 39(1), 1256-1263. http://dx.doi.org/10.1016/j. eswa.2011.07.134.
Ribas, G. P., Leiras, A., & Hamacher, S. (2012). Operational planning of oil refineries under uncertainty Special issue: applied stochastic optimization. Journal of Management Mathematics, 23, 397-412.
Sawik, T. (2009). Multi-objective due-date setting in a make-to-order environment. International Journal of Production Research, 47(22), 6205-6231. http://dx.doi.org/10.1080/00207540902810585.
Sharda, B., & Akiya, N. (2012). Selecting make-to-stock and postponement policies for different products in a chemical plant: a case study using discrete event simulation. International Journal of Production Economics, 136(1), 161-171. http://dx.doi.org/10.1016/j. ijpe.2011.10.001.
Sinisgalli, E. S. L., Urbina, L. M. S., & Alves, J. M. (2009). The Activity Based Costing and the throughput accounting in the definition of the production mix in a metalwork firm. Production, 19(2), 332-344. http://dx.doi.org/10.1590/S0103-65132009000200009. Thomé, A. M. T., Scavarda, L. F., Scavarda, A., & Thomé, F. E. S. S. (2016). Similarities and contrasts of complexity, uncertainty, risks,
and resilience in supply chains and temporary multi-organization projects. International Journal of Project Management, 34(7), 1328-1346. http://dx.doi.org/10.1016/j.ijproman.2015.10.012.
Van de Vonder, S., Demeulemeester, E., & Herroelen, W. (2008). Proactive heuristic procedures for robust project scheduling: an experimental analysis. European Journal of Operational Research, 189(3), 723-733. http://dx.doi.org/10.1016/j.ejor.2006.10.061. Wang, X., Xie, X., & Cheng, T. C. E. (2013). Order acceptance and scheduling in a two-machine flowshop. International Journal of
Production Economics, 141(1), 366-376. http://dx.doi.org/10.1016/j.ijpe.2012.08.020.
Yang, L. (2013). Key practices, manufacturing capability and attainment of manufacturing goals: the perspective of project/engineer-to-order manufacturing. International Journal of Project Management, 31(1), 109-125. http://dx.doi.org/10.1016/j.ijproman.2012.03.005. Zijm, W. H. M. (2000). Towards intelligent manufacturing planning and control systems. OR-Spektrum, 22(3), 313-345. http://dx.doi.
org/10.1007/s002919900032.
Appendix A. Mathematical formulation of the optimisation model.
The mathematical formulation of the optimisation model is presented next. It was adapted from Carvalho et al. (2015).
Table 1A. Sets.
a activities
b activity types
g milestones
i components of a project
t,l time periods
w work centres
Table 2A. Parameters. APia 1 if activity a belongs to part i, 0 otherwise
ATba 1 if activity a is classified as activity type b, 0 otherwise Cbg accumulated intensity of activity type b in milestone g CAPw maximum number of working hours per period at work centre w
CC capacity change cost relative to hiring or firing one employee
COw average salary per hour of an employee working an overtime hour at work centre w CRw production processing hourly cost at work centre w
CSw average salary of an employee working at work centre w DLa deadline of activity a
M “big M”, a sufficiently large number ME minimum employment period
MNa minimum intensity of activity a in any time period MXa maximum intensity of activity a in any time period NEw number of employees initially allocated at work centre w
NP number of periods in the planning horizon
OHEw number of overtime hours per employee per period at work centre w PSi price of the subcontracted part i
Qaw processing time of activity a at work centre w RDa release date of activity a
RHEw number of regular working hours per employee per period at work centre w
WHwt number of hours relative to the committed workload allocated to work centre w in period t XSi 1 if part i may be subcontracted, 0 otherwise
Table 3A. Decision variables. ca 1 if activity a is processed in-house, 0 otherwise
di 1 if part i is processed in-house, 0 otherwise
eat 1 if activity a has already started in period t or in an earlier period; 0 otherwise eawt number of employees allocated at work centre w in period t
efltw number of employees hired in period l and fired in period t at work centre w
ehltw number of employees hired in period l and still working in time period t at work centre w eowt number of employees working overtime hours at work centre w in period t
erwt number of employees working regular hours at work centre w in period t fat 1 if activity a is entirely processed by period t; 0 otherwise
nigt 1 if part i has completed at least milestone percentual g in period t; 0 otherwise oat number of overtime hours processing activity a in period t
rat number of regular working hours processing activity a in period t sat number of subcontracted hours processing activity a in period t wat 1 if activity a is processed in period t; 0 otherwise
wrwt number of regular hours relative to the committed workload allocated to work centre w in period t wowt number of overtime hours relative to the committed workload allocated to work centre w in period t
xat intensity of activity a in period t
Minimize
( ) t ( )
w at at w at w wt wt w wt ttw ltw w wt i i
a,w,t w,t l i
[CR (r o ) CO + + o ]+ [CR wr +wo +CO wo CC + (eh + ef ) CS + ea ] PS 1+ −d
∑
∑
∑
∑
a
a
DL at t RD
x 1, a =
= ∀
∑
t
at al a a
l 1
e x a, RD t DL =
≥
∑
∀ ≤ ≤t
at al a a
l 1
f x a, RD t DL =
≤
∑
∀ ≤ ≤at at at
w = e −f a, t∀
at a at a a
x ≥ MN w a, RD t∀ ≤ ≤ DL
at a at a a
x ≤MX w a, RD t∀ ≤ ≤ DL
at bg igt a a ia ba
z ≤C +M n a, g , RD ∀ ∀ ≤ ≤t DL , AP =1, AT =1
at bg igt a a ia ba
z ≥C −M (1 n− ) a, g , RD ∀ ∀ ≤ ≤t DL , AP =1, AT =1
aw at at at at aw
Q x =r +o s a, w, t | Q+ ∀ >0
( )
at aw a aw
t
s Q= 1 c− a, w, t | Q∀ >0
∑
ia
a ia i
a / P 0 a
c ( AP ) d i
>
= ∀
∑
∑
i i
d + XS ≥1 i∀
w wt w wt
RHE er + OHE eo ≤ CAP w, tw ∀
( )
aw at at wt wt wt wt
a a Qaw 0
Q x − s ≤ RHE +OHE NE −WH w, t | t∀ ∀ ≤FC
∑
∑
wt wt
wt w
er ≤ NE w, t | t∀ ≤FC
wt wt
eo ≤ ea w, t t ∀ FC
wt w
eo ≤ NE w, t | t∀ ≤ FC
t wt ltw
l
ea = eh
∑
w, t t FC∀t ltw llw lmw
m
eh = eh − ef
∑
w, l, t | l∀ ≤tl t 1 w ltw
eh + ≤ eh w, l, t∀ <NP
l t 1 w w
eh + ≤ NE w, l, t | l∀ =FC 1, t+ =FC 1+
ltw llw
eh = eh w, l, t | l∀ ≤ ≤ + t l ME
ltw llw
eh ≤ eh w, l, t t∀ l+ME
wt wt wt
wr + wo WH= w, t∀
at wt w wt a
r +wr =RHE er w, t∀
∑
at wt w wt
a
o +wo =OHE eo w, t∀
∑
{ } a
c ∈ 0,1 a∀
{ } i
d∈ 0,1 i∀
{ } at at at
e , f , w ∈ 0,1 a, t∀
{ } igt
n ∈0,1 i, g, t∀
wt
ea ∈Z+ w, t∀
ltw ltw
ef , eh ∈Z+ l, t, w∀