ISSN 0104-6632 Printed in Brazil
www.abeq.org.br/bjche
Vol. 23, No. 01, pp. 125 - 133, January - March, 2006
Brazilian Journal
of Chemical
Engineering
MEASUREMENT OF THE ELECTROSTATIC
CHARGE IN AIRBORNE PARTICLES:
II – PARTICLE CHARGE DISTRIBUTION OF
DIFFERENT AEROSOLS
M. V. Rodrigues
1, W. D. Marra Jr.
2, R. G. Almeida and J. R. Coury
1*1
Departamento de Engenharia Química, Universidade Federal de São Carlos, Phone: (16) 3351-8264, Cx. P. 676, CEP 13565-905, São Carlos - SP, Brazil,
E-mail: [email protected] 2
Departamento de Hidráulica e Saneamento, Universidade de São Paulo Cx. P. 359, CEP 13566-590, São Carlos - SP, Brazil.
E-mail:[email protected]
(Received: December 23, 2004 ; Accepted: July 28, 2005)
Abstract - This work gives sequence to the study on the measurement of the electrostatic charges in aerosols.
The particle charge classifier developed for this purpose and presented in the previous paper (Marra and Coury, 2000) has been used here to measure the particle charge distribution of a number of different aerosols. The charges acquired by the particles were naturally derived from the aerosol generation procedure itself. Two types of aerosol generators were used: the vibrating orifice generator and turntable Venturi plate generator. In the vibrating orifice generator, mono-dispersed particles were generated by a solution of water/ethanol/methylene blue, while in the rotating plate generator, six different materials were utilized. The results showed no clear dependence between electric charge and particle diameter for the mono-dispersed aerosol. However, for the poly-dispersed aerosols, a linear dependence between particle size and charge could be noticed.
Keywords: Electrostatic charges; Charges measurement; Aerosol particles.
INTRODUCTION
Charged aerosol particles have important implications in the aerosol science due to the electrostatic effects in powder production, handling, transport and sampling (Lui & Pui, 1985) and also on the deposition of respirable particles in the human respiratory tract (Vincent, 1995; Johnston et al., 1985). More particularly, a number of works have demonstrated the importance of electrostatic charges in gas cleaning, as it affects particle collection by filters (Coury, 1983; Duarte Filho, 1985; Coury et al. 1991; Duarte Filho et al, 2000).
In order to investigate electrical effects in aerosols studies, information about the magnitude
and distribution of the particle charge is often needed. For this reason, an improved charge classifier (electrical charge classifier - ECC) was designed and built to measure the absolute particle charge magnitude and distribution. These steps were presented in the first paper by Marra and Coury (2000).
wood dust, pyrochlore and diatomite) and a vibrating orifice aerosol generator (TSI Inc., model 3450), for mono-disperse aerosol (methylene blue).
It was noticed that, during particle generation and dispersion, aerosol particles acquired considerable levels of electrical charge and they were of different electrical signs, and these characteristics varied depending on the powder material and the aerosol generation technique utilized (Marra Jr. et al., 2005). The present study compares the different types of materials with respect to their acquired charge distribution and sign.
EXPERIMENTAL SETUP AND PROCEDURES
A full description of the apparatus and techniques used for the measurement of the distribution, magnitude and polarity of charge carried by the airborne particles is given elsewhere (Coury, 1983; Coury at al., 1991; Marra Jr., 2000; Marra Jr. and Coury, 2000) and only a brief account is given here.
Basic Theory
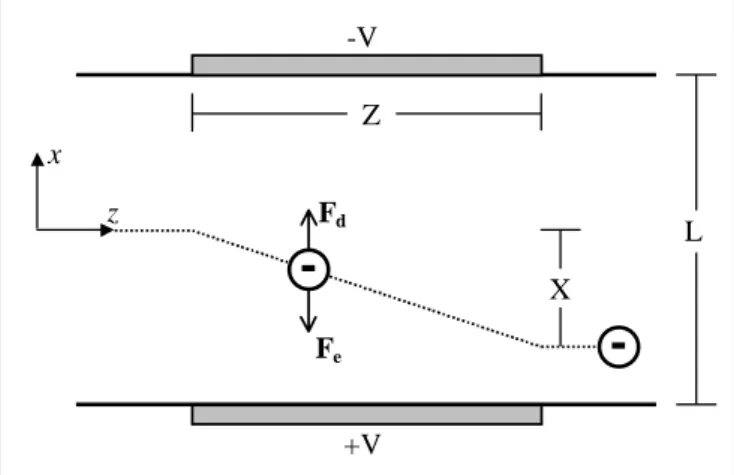
A charged aerosol particle will experience an electrical force, Fe, during transport through a region
under an electrical field and its trajectory can be altered, as observed in Figure 1. The electric force,
Fe, is given by:
Fe = Q E (1)
where Q is the particle charge and E is the applied electric field. As a result of this electric force, the particle moves at velocity Ux in the direction of the
line forces, as shown in the Figure 1. The drag force,
Fd, of the fluid on the particle in the direction x can be expressed by:
p x
S
3 d U
F μπ = d
F (2)
where μ is the gas viscosity, Ux is the particle
velocity in the x direction, dp is the particle diameter
and Fs the Cunningham slip factor.
Assuming that Fe = Fd, the particle charge can be written as:
p 0
S
3 d U XL
Q
Z VF πμ =
Δ (3)
where U0 is the gas velocity, Z is the length of
deflection plates, L is the separation distance between the plates and ΔV is a potential difference applied between them. Equation 3 is valid to all particles crossing all the electrical field lines, in the direction Z, and to an established velocity profile.
Z
L
x
z
X
Fd
Fe
-V
+V
-Figure 1: Deflection of a charged particle under an electric field between parallel plates.
Electrical Charge Classifier
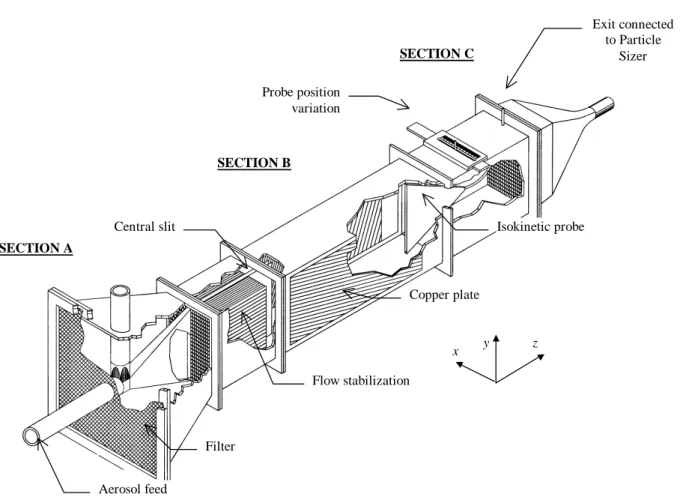
The electrical charge classifier, ECC, was built in transparent acrylic and is shown schematically in Figure 2. The apparatus can be divided in to three sections: A – aerosol insertion and gas flow stabilization section, B – particle deflection section, and C – particle collection section. The present design provides a flat profile for the gas velocity in all the extent of region B, with U0=
0.30±0.04 m/s (see Marra and Coury, 2000). The
classifier is placed in a horizontal orientation with the test aerosol introduced from the central slit in section A.
Copper plate
Flow stabilization
Filter
Isokinetic probe Probe position
variation
Central slit
Aerosol feed
x y z
Exit connected to Particle
Sizer
SECTION C
SECTION B
SECTION A
Figure 2: General view of the Electrical Charge Classifier (ECC).
Aerosol Generators
A vibrating orifice generator (TSI Inc. model 3450), capable of producing aerosols from materials in the form of solution, was used to generate a mono-dispersed aerosol. A solution of water/ethanol/methylene blue was used here. The generation begins with the solution being injected through a small orifice, producing a liquid jet. The orifice is fixed on a device with a piezoelectric crystal, which produces high frequency vibrations when subjected to an electric current. Those vibrations “break” the liquid jet in droplets that are dragged by an air flow, and conducted though a vertical column. In this column, the liquid portion of the droplet evaporates, remaining the non-volatile solute as a solid particle with a uniform and nearly spherical form.
For poly-dispersed aerosol production, a TSI Powder Disperser, model 3433 (DP-3433) was utilized. This is an instrument utilized to disperse small quantities of dry powder with diameters between 1 and 50 μm and uses the Venturi aspiration technique. The powder is spread over the surface of a rotating disc with the use of a brush, forming a uniform layer, which is then aspirated by a Venturi through a capillary tube. The lower and upper
sections of the capillary tube are located very close to the surface of the rotating disc and in the narrow portion of the Venturi, respectively. A low-pressure region is created by the air velocity increase in the narrow portion of the Venturi and, consequently, the particles are aspirated through the capillary tube.
Test Aerosols
Methylene blue, with a density of 1.57 g/cm3 was used in the mono-dispersed aerosol generator, fed as solution in water and ethanol alcohol. After atomization and drying, it resulted in mono-dispersed particles with the diameter adjusted to the desired value.
Table 1: Properties of the test aerosols
Material Density [kg/m3] Median Stokes diameter, dpS
[μm]
Geom. S. Dev., σg
Phosphate rock 3,030 1.95 0.60
Alumina 3,698 1.84 0.49
Dry egg white 1,043 3.15 1.36
Wood dust 1,420 3.04 1.04
Pyrochlore 4,110 1.98 0.65
Diatomite 3,860 1.96 0.68
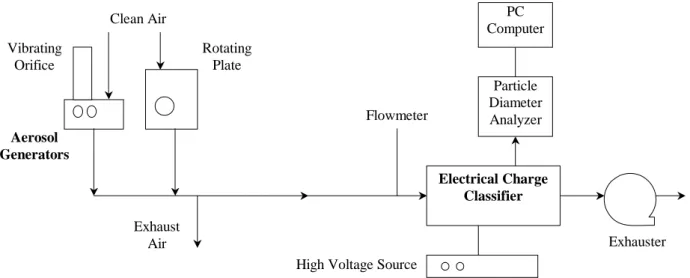
Experimental System
The complete experimental apparatus used in the analysis of the charged particle behavior can be seen in Figure 3. It can be observed that the ECC was directly connected to the powder dispensers used (one at a
time). The dust-laden gas of each test was introduced in the ECC immediately after dispersion. Therefore, the electrostatic charges measured in the tests were those generated in the dispersion technique itself. The particles diameters, after deflection, were measured using the TSI-APS, Model 3320 particle counter.
Particle Diameter Analyzer
PC Computer
High Voltage Source
Electrical Charge Classifier
Exhauster Clean Air
Aerosol Generators
Vibrating Orifice
Rotating Plate
Flowmeter
Exhaust Air
Figure 3: Schematic view of the experimental unit.
RESULTS
Charge Polarity
The charge polarity of the aerosol particles is determined by the peak of their deflection curve within the ECC: if this peak is formed by deflection towards the positive electrode, the particles are predominantly negative, and vice-versa.
Figures 4 and 5 show some typical results of the displacement of charged particles in the deflection zone of the ECC. Figure 4 is relative to 1.93 μm particles of pyroclore, whilst Figure 5 refers to 4.71 μm particles of alumina. Each curve plots the total of collected particles for a specific diameter dp, as a
function of the position x, where x=0 means no deflection. These curves were adjusted to the Gaussian distribution. The displacements of charged
particles are proportional to the level of the charging and to the intensity of the applied electric field. A 10 kV potential difference was applied in all tests, with the negative electrode situated at the right side (relative to the aerosol flow) of the ECC.
It can be noticed in Figure 4 that the displacement peak of the 1.93 μm pyroclore was positioned to the left side, indicating negatively charged particles. The same behavior was observed for the phosphate rock, the wood dust and the diatomite. An opposite behavior was observed for dry egg white and alumina that were attracted to the left side, therefore positively charged. Figure 5 shows the results for the 4.71 μm particles of alumina.
that the exchange of electrons, hence the polarity, depends on the materials involved and their relative position in the triboelectric series (Hinds, 1999).
Charge Level
Mono-Dispersed Aerosol
The results of the tests using the monodispersed aerosol generator are shown in Figure 6, where the
particle charge is plotted as a function of the particle diameter. It can be noticed that the particle charge does not show any specific trend with the diameter. The complexity of the process of particle generation in the vibrating orifice, in which involves atomization of the solution, break-up of a jet to form droplets, evaporation of the droplets, and precipitation/crystallization/agglomeration of the solids, are certainly the cause of this high instability in the electrostatic charging.
-4 -3 -2 -1 0 1 2 3 4 0
30000 60000 90000 120000 150000 180000
N
u
m
b
er
o
f P
art
ic
le
s [
]
Position X [cm]
0 KV -10 KV Gauss (0 KV) Gauss (-10 KV)
-4 -3 -2 -1 0 1 2 3 4 0
3000 6000 9000 12000
15000 0 KV
-10 KV Gauss (0 KV) Gauss (-10 KV)
N
u
m
b
er
o
f P
arti
cle
s
[
]
Position X [cm]
Figure 4: Total of pyrochlore particles as a function
of position x, for dpS = 1.93 μm.
Figure 5: Total of alumina particles as a function of
position x, for dpS = 4.71 μm.
6 7 8 9 10 11 12 13 14
-4.0 -3.0 -2.0 -1.0 0.0 1.0
Char
ge [
1
0
-1
6 C]
Stokes Diameter [10-6 m]
Figure 6: Particle charge as a function of Stokes diameter (monodispersed aerosol).
Polydispersed Aerosols
The results of the particle charge as a function of the diameter, using the rotating disc aerosol generator, are presented in Figures 7 to 12 for the polydispersed materials. The data show a linear dependence between particle diameter and the charge in these particles.
A linear relationship between charge and particle
1 2 3 4 5 -3.0
-2.5 -2.0 -1.5 -1.0 -0.5 0.0
Ch
arg
e [
1
0
-1
7 C]
Stokes Diameter [10- 6m]
2 3 4 5 6 7 8 9
0.0 1.0 2.0 3.0 4.0 5.0 6.0 7.0
Cha
rge
[
1
0
-1
7 C]
Stokes Diameter [10 -6 m]
Figure 7: Particle charge as function of Stokes
diameter for concentrate phosphate rock.
Figure 8: Particle charge as function of Stokes
diameter for dry egg white.
2 3 4 5 6 7 8 9 10 -16.0
-14.0 -12.0 -10.0 -8.0 -6.0 -4.0 -2.0
Ch
arg
e [
1
0
-1
7 C]
Stokes Diameter [10 -6 m]
1 2 2 3 3 4 4 5 5
0.0 1.0 2.0 3.0 4.0 5.0 6.0
Char
ge
[
1
0
-1
7 C]
Stokes Diameter [10 -6 m]
Figure 9: charge as function of Stokes diameter for
wood dust.
Figure 10: Particle charge as function of Stokes
diameter for alumina.
1 2 3 4 5 6 7
-4.0 -3.5 -3.0 -2.5 -2.0 -1.5 -1.0 -0.5 0.0
Ch
ar
ge
[
1
0
-1
7 C]
Stokes Diameter [10 -6 m]
1 2 3 4 5 6
-5.0 -4.0 -3.0 -2.0 -1.0 0.0
Char
ge [
1
0
-1
7 C]
Stokes Diameter [10 -6 m]
Figure 11: Particle charge as function of Stokes
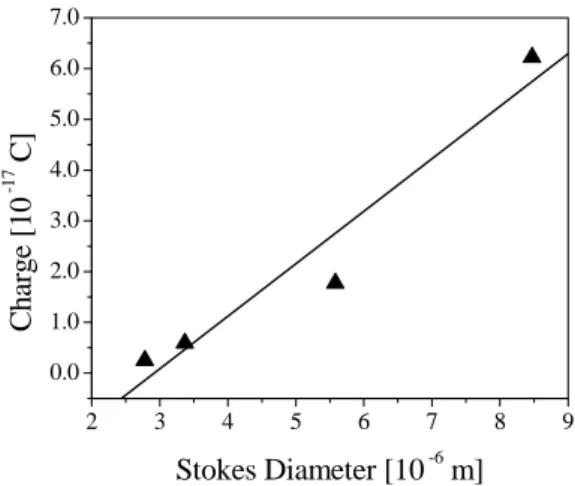
diameter for diatomite.
Figure 12: Particle charge as function of Stokes
Table 2: Equations for particle charge as a functions of diameter
Aerosol Charge (Q) r2
Phosphate rock -0.81×10⁻¹¹dpS+0.95×10⁻¹⁷ 0.986
Alumina 1.69×10⁻¹¹dpS -2.28×10
-17
0.993
Dry egg white 1.03×10⁻¹¹dpS – 3.01×10⁻¹⁷ 0.950
Wood dust -1.88×10⁻¹¹dpS + 2.17×10 -17
0.995
Pyrochlore -0.98×10⁻¹¹dpS + 0.37×10⁻¹⁷ 0.992
Diatomite -0.62×10⁻¹¹dpS +0.29×10⁻¹⁷ 0.995
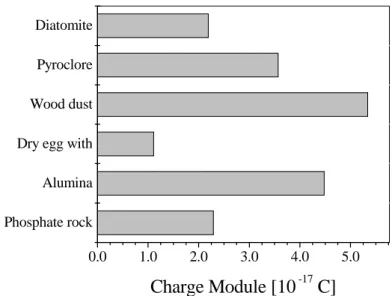
Figure 13 compares the level of charging (in absolute values) relative to particles with 4 μm in diameter under the same experimental conditions. It can be said that the wood dust presents the highest level of charging (5,34x10⁻¹⁷ C) while the dry egg white presents the lowest level of charge (1.11x10⁻¹⁷ C) within the studied range.
Jonhston et al. (1987) proposed a power law
expression for the absolute median particle charge with respect to particle diameter, in the form:
B p
Q/e =Ad (4)
where e is the elementary charge of the electron, A is the median number of elementary charges of magnitude e on a particle of diameter 1 μm. Johnston
found values of B typically in the range 1 to 2, and of A typically in the range 10 to 30. His results are given in Table 3, together with the results of the present work, adjusted to Equation 4. The amount of charge found in all cases was very similar, indicating their consistency. Note the methods of re-suspending dry powders in this Table involve mainly friction between the powder and the apparatus (triboelectrification) and consequently produced similar aerosols.
Table 3 also lists the experimental results obtained by Forsyth et al. (1998) for comparable aerosols obtained from liquids solutions. It can be seen that theirs results show a nearly linear dependence between particle charge and particle diameter. These trends, however, were not found in the present work for the methylene blue, also obtained from a solution.
Phosphate rock Alumina Dry egg with Wood dust Pyroclore Diatomite
0.0 1.0 2.0 3.0 4.0 5.0
Charge Module [10
-17C]
Table 3: Power law fit, Q/e =AdBp, to generated aerosol charge distribution
Aerosol A B R2
Diameter range
(μm)
Results from
From Dust Generator
Phosphate rock (rotating disc) 48.6 1.06 0.97 0.15-8.0 this work
Alumina (rotating disc) 7.83 2.58 0.85 1.4-4.7 this work
Dry egg white (rotating disc) 1.07 2.74 0.98 2.8-8.5 this work
Wood dust (rotating disc) 53.1 1.30 0.99 2.6-9.3 this work
Pyrochlore (rotating disc) 29.79 1.48 0.96 0.9-5.4 this work
Diatomite (rotating disc) 26.45 1.15 0.99 1.0-6.3 this work
Coal (turntable-Venturi) 36.8 1.17 0.99 0.6-7.5 Johnston (1987)
Quartz (turntable-Venturi) 27.8 1.48 0.99 0.6-7.5 Johnston (1987)
Mica (turntable-Venturi) 30.3 1.18 0.99 0.6-7.5 Johnston (1987)
From Liquid Solution
Methilene blue (vibrating orifice) N/A N/A N/A 6.0-14.0 this work
NaCl (collision nebulizer) 4.6 1.32 0.92 0.6-2.1 Johnston (1987)
KCl 0.1% (spray atomizer) 14.15 0.7 0.96 0.15-0.3 Forsyth (1998)
KCl 1% (spray atomizer) 6.7 0.45 0.93 0.15-0.3 Forsyth (1998)
NaCl 0.1%(spray atomizer) 19.1 0.8 0.96 0.15-0.75 Forsyth (1998)
NaCl 10% (spray atomizer) 6.2 0.60 0.89 0.15-0.65 Forsyth (1998)
CONCLUSIONS
The dependence of particle charge to particle diameter were measured for seven different materials. The values of the charge measured in the particles are of the same order of magnitude as the ones reported in the literature, indicating the adequacy of the equipment and of the method employed.
The mean Stokes diameters of the mono-dispersed particles studied range between 6.0x10⁻⁶ m and 1.4x10⁻⁵ m and the electric charges presented values from -3.0x10⁻¹⁶ C to -5.0x10⁻¹⁸ C. No evident dependence between the particle charge with its diameter was observed for the tests with the mono-dispersed aerosol, generated by a liquid solution. For the tests using the poly-dispersed aerosols generated by triboelectrification, a linear dependence between particle charge and diameter was noticed. The analysis of the obtained data showed that the level of charging and polarity is a function of the powder composition: some aerosols were negatively charged (phosphate rock, diatomite, pyrochlore and wood dust) while others were positive (alumina and dry egg white). In the same experimental conditions, dust wood acquired five times more charge than egg white, in absolute values.
NOMENCLATURE
μ Gas viscosity kg.s-1.m-1
ΔV Electrical potential difference V
dp Stokes diameter m
E Electric field V.m-1
Fd Drag force N
Fe Electric force N
Fs Slip factor (-)
L Parallel plane plates distance m
Q Particle charge C
U0 Gas velocity m.s-1
Ux Particle velocity (direction x) m.s-1
X Particle deflection m
Z Length of the deflection plates m
Zp Electromobility of the
particle
m2.V-1.s-1
ACKNOWLEDGMENT
The authors are indebted to FAPESP – Fundação de Amparo à Pesquisa do Estado de São Paulo – (proces. 01/03675-1), PRONEX-FINEP and CNPq – Conselho Nacional de Pesquisa e Desenvolvimento (proj. 462088/00-2) for the financial support provided.
REFERENCES
Almeida, R. G., Determinação da Distribuição de Cargas Eletrostáticas em Aerossóis. MSc. Dissertation, Universidade Federal de São Carlos (2000).
Clift, R.; Grace, J. R; Weber, M. E., Bubbles, Drops, and Particles. Academic Press, (1978).
Coury, J. R., Electrostatic Effects in Granular Bed Filtration of Gases. Ph.D. Thesis, University of Cambridge (1983).
Coury, J. R.; Guang D.;Raper, J. A.; Clift, R., Measuremet of Electrostatic Charge on Gas-Borne Particles and the Effect of Charges on Fabric Filtration. TransIChemE, Vol. 69, part B, p. 97 - 106, (1991).
Duarte Fo., O. B., Filtração de Gases em Leito Fixo Granular: Efeitos da Variação do Nível de Carga Eletrostática nas Partículas. Doctorate Thesis, Escola Politécnica da USP, (1995).
Duarte Fo., O. B., Marra Jr., W. D., Kachan, G. C.; Coury, J. R., Filtration of Electrified Solid Particles, Industrial & Engineering Chemistry Research, 39(10), 3884-3895 (2000).
Guang, D., In-Situ Measurement of Electrostatic Charge and Distribution on Flyash Particles in Power Station Exhaust Stream. Ph.D. Thesis, University of New South Wales (1991).
Hinds,W.C., Aerosol Technology: Properties, Behavior and Measurement of Airborne Particles. 2nd Ed. John Wiley & Sons, NY (1999).
Johnston, A. M; Vincent, J. H.; Jones A. D; Mclachlan, C. Q., Measurements of Electric Charge on
Airborne Dusts in Textile Industry Workplaces. Textile Research Journal, p. 469-477 (1985).
Johnston, A. M.; Vincent, J. H.; Jones, A. D., Electrical Charge Characteristics of Dry Aerosols Produced by a Number of Laboratory Mechanical Dispensers. Aerosol Science and Technology, 6, p. 115-127 (1987).
Liu, B. Y. H. & Pui, D. Y. H., Electrostatic Effects in Aerosol Sampling and Filtration. Ann. Occup. Hyg., Vol. 29, No. 2, p. 251-269 (1985).
Marra Jr., W. D., Desenvolvimento de um Equipamento para a Determinação da Distribuição de Cargas Eletrostáticas em Aerossóis. Doctorate Thesis, Universidade Federal de São Carlos (2000).
Marra Jr., W. D.; Coury, J. R., Measurement of the Electrostatic Charge in Airborne Particles: I- Development of the Equipment and Preliminary Results. Brazilian Journal of Chemical Engineering, 17 (01), 39-50 (2000).
Marra Jr., W. D.; Rodrigues, M.V.; Miranda, R. G. A.; Coury, J.R., The Effect of the Generation and Handling in the Acquired Electrostatic Charge in Airborne Particles, submitted for publication (2005).