Corresponding author: Patrícia S. C. Pereira, Centro Universitário Estadual da Zona Oeste – UEZO, Rua Manuel Caldeira de Alvarenga, 1203, Benjamim do Monte-Campo Grande, CEP 23070-200, Rio de Janeiro, RJ, Brasil, e-mail: [email protected]
Rheological Properties of PET/PC Reactive Blends
Luis C. Mendes
Instituto de Macromoléculas Professora Eloisa Mano-IMA, UFRJ
Patrícia S.C. Pereira
Centro Universitário Estadual da Zona Oeste, UEZO
Abstract: The solid state polymerization (SSP) of PET/PC reactive extrusion blends - with and without cobalt catalyst - at different polymer ratios was studied. Thermal and rheological evaluations were performed. DSC results showed changes in the PET’s Tg, Tch, Tm and Xc. The melt flow rate (MFR) decreased for PET and the blends. The intrinsic viscosity increased. The variation in calorimetric and rheological properties might be attributed to the PET’s chain extension reactions – esterification and transesterification. These reactions led to an increase in the PET’s molar mass, consequently shifting the PET’s Tg to lower temperature and PET’s crystallization, besides reducing the blend miscibility and flowability.
Keywords: Rheology, blends, catalysts, PET/PC, thermal properties.
Introduction
Poly(ethylene terephthalate) (PET) and polycarbornate (PC) are commercial polyesters obtained through polycondensation. Their wide application as commodity and engineering polymers is due to their remarkable thermal and mechanical properties. They are easily processing by extrusion, injection, blow-molding and thermoforming. It is well known that condensation polymers can have their degree of polymerization increased by heating in the temperature range between the glass transition temperature (Tg) and the crystalline melting temperature (Tm). Under these conditions, the polymeric chain end groups have enough mobility to react to each other, generating materials with better physico-mechanical characteristics, due to the increase of the average molar mass. This process is called polymerization/polycondensation in the solid state, or solid state polymerization (SSP). High toughness and modulus nylon-6, nylon-6,6 and bottle grade PET, for instance, are yielded by applying the SSP process[1-5]. SSP’s reactional parameters - temperature,
polymer granules, drag gas or vacuum – still have more influence on the polymerization rate compared with polycondensation in the molten state[6]. In SSP,
the temperature – above Tg and below Tm – controls the mobility of the reactive functional end groups of the pre-polymer to react with each other. The temperature must be high enough to induce chain growth but so high as to lead to cyclization and other side reactions. Additionally, the pre-polymer particles can have a critical crystallinity degree in order to avoid their melting, and also the system needs appropriate application of an inert gas or vacuum to release the reactional byproducts[7-13].
In SSP studies, the temperature and residence time are generally assessed. Lucas et al.[14] evaluated the influence
of both in the SSP to make PET. The study showed that
high intrinsic viscosity and consequently high molar mass was achieved due to the increase of both reactional parameters. Regarding the PET/PC blend, research of the SSP process is scarce. Gowd et al.[15] submitted studied
the SSP process with several PET/PC oligomer blend compositions. First, the blends were extruded at 250 ºC, 100 rpm, at residence time of one minute, in order to minimize the occurrence of transesterification reactions. After that, crystallized blends were subjected to SSP at a range of temperatures and reaction times: 190 ºC (1h), 200 ºC (1.5h), 210 ºC (2.5h), 220 ºC (3.0h) and 230 ºC (12.0h). The authors noted that the intrinsic viscosity varied with composition, temperature and reaction time.
Considering that dearth of research on SSP with PET/PC blends, the aim of this work was to investigate the effect of solid state polymerization the PET/PC reactive blends on their thermal, mechanical and rheological properties.
Experimental
Materials
PET and PC were supplied by Mossi & Ghisolfi Group and GE Plastics South America, respectively. The MFI PET and density of the PET were 33.0 g.10 min–1
and 1.39 g.cm–3, respectively. The MFI and density of
the PC were 2.5 g.10 min–1 and 1.2 g.cm–3, respectively.
Commercial cobalt acetylacetonate ΙΙ, produced by J.T.Baker Chemical Co. was used as catalyst.
Blending
PET/PC reactive blending, at different weight fractions, with and without cobalt acetylacetonate ΙΙ (a transesterification catalyst), was performed in
Extrusão Brasil model DCR 22a, co-rotating twin-screw extruder (L/D = 36 and 22 mm of screw diameter), equipped with a vacuum system, at 190-255 ºC and 150 rpm. In order to homogenize the catalyzed blend, a master containing PET and catalyst, in an appropriate proportion, was prepared and the PET amount in the master was discounted for each blend. Before processing, the water was removed from the precursor polymers by drying at 120 ºC for 8 hours to prevent hydrolysis during melt processing. After blending, the extrudate was cooled in water (30 ºC) and pelletized.
Solid State condensation (SSP)
PET, PC and PET/PC blends were submitted to the SSP process in a stainless steel reactor equipped with heating system, vacuum pump and a manometer, at 180 ºC during 6 hours, at 0.08bar of vacuum. The conditions were adjusted after several preliminary experiments.
Differential scanning calorimetry (DSC)
Calorimetric measurements were carried out with a Perkin-Elmer differential scanning calorimeter (DSC-7). Two cycles of heating and cooling were applied. The first heating cycle was performed from 40 to 300 ºC at a heating rate of 10 ºC/min–1 (1st scan), under nitrogen
atmosphere, kept for 2 minutes in order to eliminate the thermal history, and then cooled (first cooling cycle) to 40 ºC at maximum equipment cooling rate (2nd scan). The
third cycle of heating (3rd scan) was carried out following
the same protocol of the first one. Finally, the fourth cycle was applied, cooling to 40 ºC at 10 ºC/min–1, (4th scan).
The glass transition and melting temperatures, Tg and Tm, respectively, were measured from the curves. The heating and cooling crystallization temperatures, respectively, Tch and Tcc, were determined when it was possible. For each blend, the PET’s degree of crystallization (Xc) was calculated from the ratio of PET endothermic peak area (∆Hm) in the blends and the enthalpy of fusion of 100% crystalline PET (136 J.g–1)[16], taking into account
the weight of PET in each blend.As proposed by Santana et al.[17], the degree of participation (herein called
of effectiveness degree - єd) of each component in the PET-rich phase and PC-rich phase was calculated.
Rheology measurements
The rheological properties were investigated in a Rheometrics model AR2000 dynamic oscillatory rheometer equipped with parallel plates (D=25 mm, gap=1 mm), in the frequency range from 350 to 10 rad.s–1, at 270 ºC, under nitrogen atmosphere. Before
the rheological measurements, all materials were dried at 120 ºC for 8 hours.
Melt flow rate (MFR)
The melt flow rate (MFR) was measured with a Dinateste plastometer, using the ASTM D 1238[18] standard
as guidance. The test conditions were 260 ºC and 1.2 kg and the result was the average of five measurements.
Intrinsic viscosity (η)
The intrinsic viscosity (η) was measured based on the ASTM D 4603 standard[19] using an Ubbelohde
viscometer, with a phenol-TCE mixture (60/40 v/v) as solvent, at 30 ºC. The result was the average of two measurements.
Results and Discussion
Differential scanning calorimetry (DSC)
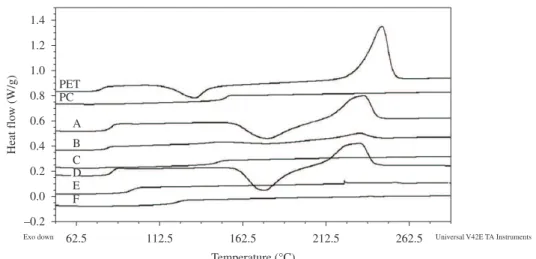
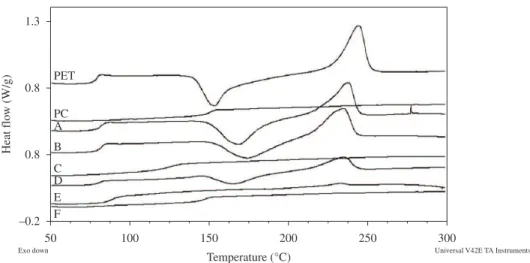
Figure 1and 2 shows the DSC curves of the materials while Table 1 shows the calorimetric properties of the PET, PC and blends before and after SSP. With respect to the precursor polymers, there was an increase in the PET’s Xc – an annealing process happened – and a slight decrease of the PC’s Tg. For the blends, each property is discussed separately.
Glass transition temperature (Tg)
Before SSP, the increase of the PET’s Tg seems to be compositional for both kind of blends, independent on the presence of catalyst. Regarding the PC’s Tg, it decreased
in the blends when it could be calculated. In some cases, it overlapped the PET’s heating crystallization temperature, so it was not possible to determine it. After SSP, there was no tendency concerning a change of the PET’s Tg. This property decreased for the 50/50 blend, with and without catalyst, while it is constant for the blend with the lowest amount of PET. For the PET rich blends, the PET’s Tg showed an increase and remained constant for the uncatalyzed and catalyzed materials, respectively. The catalyst seems not to act during SSP. Because of overlapping of the the PET’s Tch values, the PC’s Tg could not be determined in the majority of the cases.
Heating crystallization temperature (Tch)
For all blends, the values of Tch were shifted to higher temperatures, before and after SSP, independent on the presence of catalyst. The PC’s molecules always retard the PET’s crystallization but their effect is lesser after SSP – lower Tch values were achieved.
Crystalline melting temperature (Tm)
The values of Tm were very similar before and after SSP indicating that the crystal thickness was not affected after the post-condensation process.
Crystallinity degree (Xc)
The SSP showed a strong influence on the PET’s Xc – it increased for all blends – behavior similar that for the neat PET.
The changes of the blends’ calorimetric properties could have occurred for different reasons. During the blending process, the increase of the PET’s Tg along with the decrease of the PC’s Tg, could have been caused by reactions such as transesterification (reaction between PET-ester (-[O=C]-O) and PC- carbonate (-O-[C=O]-O) linkages) and esterification (reactions between PET-carboxyl terminal group (-[C=O]-OH) and PET-hydroxyl terminal group (-OH) with the PC carbonate (-O-[C=O]-O) link), known as acidolysis and alcoholysis reactions, respectively[20].
These reactions are widely recognized as responsible for the changes in PET/PC blend’s miscibility during blending in the molten state. In the SSP process, besides those reactions, PET-carboxyl, hydroxyl and ester (-[C=O]-OCH2CH2OH) terminal groups may react to each other – esterification and transesterification (chain extension reactions), respectively – leading to an increase of the molar mass. The variation of the Tg can be explained in terms of the competition among all feasible reactions cited. In situations where there is a decrease of the PET’s
Figure 2. Second heating DSC curves of the materials after SSP: 80/20 (A-without catalyst; D- with catalyst) 50/50 (B-without catalyst; E- with catalyst), 20/80 (C-without catalyst; F- with catalyst).
Table 1. DSC parameters of PET, PC and blends.
Samples
Tg PET’s phase
(°C)
Tg PC’s phase
(°C)
Tch
(°C)
Tm
(°C)
Xc
(%)
Before SSP
After SSP
Before SSP
After SSP
Before SSP
After SSP
Before SSP
After SSP
Before SSP
After SSP
PET 78 78 - - 137 134 247 245 20 27
PC - - 153 150 - - -
-PET/PC 80/20a 86 93 Nd Nd 178 168 234 238 18 25
PET/PC 50/50a 82 80 145 Nd 172 166 233 235 10 19
PET/PC 20/80a 78 80 149 149 - - - - -
-PET/PC 80/20b 87 87 Nd Nd 186 174 229 235 10 28
PET/PC 50/50b 97 88 Nd Nd - 162 - 236 - 33
PET/PC 20/80b Nd - 138 139 - - - - -
Tg along with an increase of the PC’s Tg, it can be inferred that the chain extension reactions prevailed in detriment of the acidolysis and alcoholysis ones. The uncatalysed 80/20 blend was the only case where the PET’s Tg showed an increase, attributed to the transesterification reaction between PET-ester and PC-carbonate linkages along the polymer chains. As in all other cases, the PET’s Tg either decreased or remained the same, so it can be deduced that the transesterification reaction between PET and PC did not occur during SSP. This indicates that the catalyst was inactive during SSP. Therefore, the variation of the blends’ calorimetric properties – Tg, Tch and Xc – can be attributed to PET’s chain extension reactions. These reactions could have led to the increase of the molar mass of the PET’s chains, the shift of the PET’s Tg to lower temperature and the reduction of the effect of the PC chains inside the PET’s phase on the blend miscibility and PET’s crystallization.
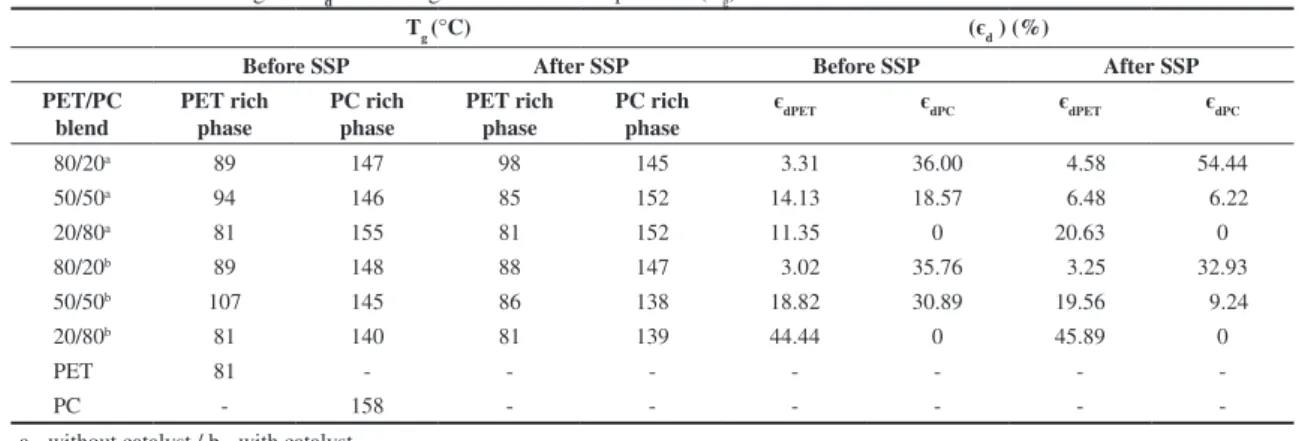
The effectiveness degree - єd - and the glass transition temperature (Tg) of the materials are listed in Table 2 For uncatalysed blends, the єd did not show any tendency, before and after SSP.
The behavior was dictated for each composition. After SSP, blends rich in PET and PC showed increasing
in the єd value as result of the esterification and transesterification reactions between end-groups of PET chains and also end-groups of PET chains with end-groups of copolymer PET/PC. Only the PET/PC 50/50 blend showed decreasing of the єd value which could indicate a demixing process. Concerning the catalysed blends, the PET/PC 50/50 blend showed again anomalous behavior. The єd values for blends rich in PET and PC could be considered similar, before and after SSP. By this form, it would be reasonable to think that the cobalt catalyst did not play any role during SSP.
Rheology measurements
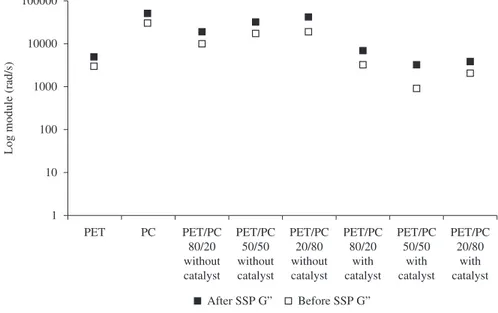
The values of the storage and loss moduli before and after SSP were plotted (Figures 3 and 4, respectively). The curves overlapped, which confirms the inertia of the catalyst in the SSP conditions.
Table 3 shows the G’ and G” as a function of the frequency, before and after SSP. For both precursor polymers, there was a decrease after the post condensation process, which can be attributed to some thermal degradation.
Concerning the blends, before SSP, the G’ value seems to be influenced by the amount of PC – uncatalysed
Table 2. Effectiveness degree - єd - and the glass transition temperature (Tg) of the materials.
Tg (°C) (єd ) (%)
Before SSP After SSP Before SSP After SSP
PET/PC blend
PET rich phase
PC rich phase
PET rich phase
PC rich phase
єdPET єdPC єdPET єdPC
80/20a 89 147 98 145 3.31 36.00 4.58 54.44
50/50a 94 146 85 152 14.13 18.57 6.48 6.22
20/80a 81 155 81 152 11.35 0 20.63 0
80/20b 89 148 88 147 3.02 35.76 3.25 32.93
50/50b 107 145 86 138 18.82 30.89 19.56 9.24
20/80b 81 140 81 139 44.44 0 45.89 0
PET 81 - - -
-PC - 158 - - -
-a - without c-at-alyst / b - with c-at-alyst.
blend – and also by the catalyst. The G’ reached a maximum value for the uncatalysed blend with 50 wt.% of PC. There was marked action of the catalyst on the blends – the G’ value drastically decreased for the
catalyzed blends. Similarly, after SSP, the same influences remained with respect to G’ but a tendency to decrease was observed in the majority of cases. Similar behavior was observed regarding G”.
Figure 4. G” of the materials at 10 rad/s.
Figure 5. Melt flow rate (MFR) of the PET, PC and PET/PC without catalyst before and after SSP.
Table 3. G’ and G” of the materials at 10 rad/s.
Samples BeforeSSP After SSP Before SSP After SSP
G’ G’ G” G”
PET 92,56 88,01 2881 1861
PC 4830 3357 28310 19680
PET/PC 80/20a 1810 1366 10060 8298
PET/PC 50/50a 3780 3276 16710 16280
PET/PC 20/80a 2769 3322 18280 21950
PET/PC 80/20b 677,7 579,1 3252 3233
PET/PC 50/50b 236,7 491,3 901 2407
PET/PC 20/80b 346,6 236,4 2067 1470
Unexpectedly, there was a tendency for reduction of the moduli of the blends after SSP. This can be explained by the occurrence of the reactions –transesterification, acidolysis and alcoholysis – or also thermal degradation due to the test conditions, namely prolonged high temperature (270 ºC) and shearing action. In the molten state, all these reactions contributed to deteriorate the polymers’ molar mass, although there was a gain in miscibility.
Melt flow rate (MFR) and intrinsic viscosity (η)
Figures 5 and 6 show the MFR values of the materials. The PC’s MFR values were similar before and after SSP, indicating that chain extension reaction did not occur with polycarbonate in the conditions applied here.
Concerning the PET and blends, the MFR values decreased. This behavior can be attributed to PET’s esterification and transesterification. These chain extension reactions led to an increase of the molar mass of the PET’s chains, resulting in a decrease of flowability.
Table 4 present the intrinsic viscosity [η] values of the materials, before and after SSP. Similar to MFR, the PC’s [η] did not change, confirming there was no chain
extension reaction for polycarbonate. Regarding the PET and blends, the values of [η] increased, corroborating that PET’s chain extension reactions were effective during SSP. The variation is higher for the catalysed blends on account of the action of the catalyst. During the molten processing, the rate of the transesterification reaction between the PC-carbonate and PET-ester groups along the chain is intensified. This generates an increase of the PET-hydroxyl-terminal groups, which helps the PET’s chain extension reactions.
Conclusion
The post-condensation reaction of poly(ethylene terephthalate)/polycarbonate blends (PET/PC), with and without catalyst, was evaluated. The variation of PET’s Tg, Tch, and Xc indicated that during SSP only PET’s esterification and transesterification reactions happened. A convergent finding was found based on the rheological study. The MFR and intrinsic viscosity of the PET and blends decreased and increased, respectively.
Acknowledgements
The authors wish to thank Conselho Nacional de Desenvolvimento Científico e Tecnológico (CNPq), Fundação Coordenação do Aperfeiçoamento de Pessoal de Nível Superior (CAPES) and Universidade Federal do Rio de Janeiro (UFRJ) for supporting this investigation.
References
1. Thakur, M. – “Encyclopedia of Polymer Science and Engineering”, 2nd ed., New York (1986).
2. Chen, S. - J. Polym. Sci. A Polym. Chem., 25, p.533 (1987).
3. Huang, B. & Walsh, J. J. – Polymer, 39, p.6991 (1998).
http://dx.doi.org/10.1016/S0032-3861(97)10212-9 4. Papaspyrides, C. D. - “Polymeric Material Encyclopedia”,
Salamone, New York (1999).
Figure 6. Melt flow rate (MFR) of the PET, PC and PET/PC without catalyst before and after SSP.
Table 4. Intrinsic viscosity [η] of the materials, before and after SSP, and its variation.
Samples Before SSP [η] (dL/g)
After SSP
[η] (dL/g)
Percentage change
(%)
PET 0,81 0,96 19
PC 1,58 1,57 –1
PET/PC 80/20a 0,61 0,65 7
PET/PC 50/50a 1,03 0,83 –19
PET/PC 20/80a 1,17 1,35 16
PET/PC 80/20b 1,63 1,92 18
PET/PC 50/50b 0,70 1,21 66
PET/PC 20/80b 0,56 0,86 54
5. Garret, W. O.; Stephen, E. L.; Jason, A. S.; Paul, V. G. &
Kenneth, B. W. - Macromolecules, 36, p.539 (2003).
6. Jansen, M. A. G.; Goossens, J. G. P.; Wit, G.; Bailly, C. &
Koning, C. E. - Anal. Chim. Acta., 557, p.19 (2006). http://
dx.doi.org/10.1016/j.aca.2005.05.063
7. Gaymans, R.; Van, U. T. & Schuyer, J. J. - Polym. Sci. A
Polym. Chem., 15, p.537 (1977). http://dx.doi.org/10.1002/
pol.1977.170150303
8. Mallon, F.; Beers, K.; Ives, A. & Ray, W. - J. Appl. Polym.
Sci., 71, p.1791 (1998).
9. Samant, K. D. & Ng, K. M. - AIChE J., 45, p.1808 (1999).
http://dx.doi.org/10.1002/aic.690450816
10. Gross, S.; Roberts, G. D. & Kiserow,
J. – Macromolecules, 33, p.40 (2000). http://dx.doi.
org/10.1021/ma990901w
11. Ma, Y.; Agarwal, U.; Sikkema, P. & Lemstra, P. – Polymer, 44,
p.4085 (2003). http://dx.doi.org/10.1016/S0032-3861(03)00408-7
12. Volokhina, A.; Kudryavtsev, G.; Skuratov, S. & Bonetskaya,
A. - J. Appl. Polym. Sci., 53, p.289 (1961).
13. Gantillon, B.; Spitz, R. & McKenna, T. F. – Macromol.
Mater. Eng., 289, p.106 (2004). http://dx.doi.org/10.1002/
mame.200300290
14. Lucas, B.; Seavey, K. C. & Liu, Y. A. - Ind. Eng. Chem.
Res., 46, p.190 (2007). http://dx.doi.org/10.1021/ie0601955
15. Gowd, E. B. & Ramesh, C. - Polymer, 46, p.7443 (2005).
http://dx.doi.org/10.1016/j.polymer.2005.05.075
16. Algeri, C. & Rovaglio, M. - Ind. Eng. Chem. Res., 43,
p.4253 (2004). http://dx.doi.org/10.1021/ie034323q 17. Santana, O. O.; Jabareen, A. A.; Illescas, S. & Maspoch,
M. L. – J. Mater. Sci., 45, p.6623 (2010). http://dx.doi.
org/10.1007/s10853-010-4753-4
18. American Society for Testing and Materials - ASTM. - “D 1238: Standard test method for flow rates of thermoplastics by extrusion plastometer”, Annual Book of ASTM Standards, Philadelphia (1994). 19. American Society for Testing and Materials - ASTM. - “D 4603:
Standard test method for determining inherent viscosity of poly(ethyleneterephthalate) PET”, Annual Book of ASTM Standards, Philadelphia (1994).
20. Mendes, L. C. & Pereira, P. S. C. - Mater. Sci. Appl., 2,
p.1033 (2011).
![Table 4 present the intrinsic viscosity [η] values of the materials, before and after SSP](https://thumb-eu.123doks.com/thumbv2/123dok_br/18869058.419625/6.765.155.636.85.386/table-present-intrinsic-viscosity-η-values-materials-ssp.webp)
