Article
Printed in Brazil - ©2017 Sociedade Brasileira de Química 0103 - 5053 $6.00+0.00
*e-mail: [email protected]
Synthesis, Characterization, and Photocatalytic Activity of Pure and
N-, B-, or Ag- Doped TiO
2Paula C. S. Bezerra,a Rodrigo P. Cavalcante,a Aline Garcia,b Heberton Wender,c
Marco A. U. Martines,a Gleison A. Casagrande,a Jaime Giménez,d Pilar Marco,d
Silvio C. Oliveiraa and Amilcar Machulek Jr.*,a,b
aInstituto de Química, Universidade Federal de Mato Grosso do Sul,
Av. Senador Filinto Müller, 1555, 79074-460 Campo Grande-MS, Brazil
bFaculdade de Engenharias, Arquitetura e Urbanismo e Geografia and cInstituto de Física,
Universidade Federal de Mato Grosso do Sul, Cidade Universitária, Av. Costa e Silva, s/n, 79070-900 Campo Grande-MS, Brazil
dDepartment of Chemical Engineering, Universitat de Barcelona,
Martí i Franquès, 1, 08028 Barcelona, Spain
This article reports the synthesis and characterization of pure and N-, B-, and Ag-doped TiO2
and the ability of these oxides to photodegrade methylene blue (MB) under sunlight or UV-ABC radiation. The compounds were synthesized using the sol-gel method and characterized by scanning electron microscopy, X-ray diffraction, diffuse relectance spectroscopy, Fourier transform infrared spectroscopy, thermogravimetric analysis, and X-ray photoelectron spectroscopy. Photocatalytic eficiency was signiicantly increased by N-doping, resulting in 98% MB decomposition under UV-ABC irradiation for 180 min. Ag- and B-doped TiO2 lowered MB degradation rates to 52 and
73%, respectively, compared with pure TiO2. The same behavior was observed with exposure to
UV-Vis, with 88, 65, 60, and 42% MB removal with N-doped, pure, B-doped, and Ag-doped TiO2,
respectively. Under visible light alone, N-doped TiO2 exhibited higher photocatalytic eficiency
than commercial P25-type TiO2. Photocatalysis with N-doped TiO2 proved to be a promising
alternative for MB degradation, given the potential of employing solar energy, thus minimizing operating costs.
Keywords: photocatalyst, sol-gel method, N-doped TiO2, UV-ABC irradiation, visible-light
activity
Introduction
Incomplete removal of organic compounds in conventional wastewater treatment plants (WWTPs) has been identified as one of the principal routes whereby anthropogenic pollutants can reach aqueous environments.1 Use of advanced oxidation processes
(AOPs), however, has proved a satisfactory approach to the treatment of wastewater containing biorecalcitrant organic pollutants.2,3
AOPs are based on physical and chemical mechanisms that produce powerful oxidizing species, primarily, but not limited to, hydroxyl radicals (HO•), generated under
atmospheric or sub-supercritical conditions of temperature
and pressure with the aid of catalysts, reactive energy (electrochemical, UV-Vis, ultrasound), both, or neither.4,5
The versatility of AOPs also stems from the availability of several routes for HO• production, imparting high
adaptability to environmental recovery approaches,2,6
including methods based on UV, H2O2/UV, O3/UV,
and H2O2/O3/UV, which rely on UV-C photolysis of
H2O2, ozone, or both to produce active species. UV-Vis
irradiation is employed in methods such as photo-Fenton, in which H2O2 is added to dissolved iron salts
and heterogeneous photocatalysis, while a powder or a supported semiconductor is used as the active material.2
band holes, (h+VB) and conduction band electrons (e–CB) on
the semiconductor surface (equation 1).2,4,7 Photoexcited
electrons can in turn recombine with electron holes, reducing the overall efficiency of the photoprocess (equation 2).8 Unrecombined holes can subsequently
oxidize organic pollutants through redox reactions (equation 3) or react with species adsorbed onto the catalyst surface, such as water or hydroxide ions (HO−), to generate
HO• radicals (equations 4 and 5).4,9 Electrons ejected to the
conduction band can react with electron acceptors, such as molecular oxygen adsorbed onto the catalyst surface, forming superoxide anion radicals, O2•− (equation 6),4
which react with protons to form hydroperoxyl radicals (HO2•). Coupling of these radicals generates H2O2, which,
undergoing photolysis, yield additional HO• radicals.4
During photocatalysis, free electrons/holes and the reactive oxidizing species generated (HO•,O
2•−,h+VB, HO2•)
are the principal species responsible for the degradation of organic pollutants present in the medium (equation 7).10
(1) (2) (3) (4) (5) (6) (7)
Titanium dioxide (TiO2) is the most extensively used
photocatalyst, owing to advantageous properties such as signiicant photocatalytic activity, operation under ambient conditions, thermal and chemical stability, low cost, low toxicity, abundance, and resistance to most chemicals and photocorrosion.10,11 Heterogeneous photocatalysis using
TiO2 has received considerable attention as an AOP for
photodegradation of organic pollutants in water.12-15
Despite being a promising technology, photocatalysis with TiO2 has disadvantages, including low degradation
kinetics and a high probability of electron-hole recombination. Removal of catalysts at the end of the process is a major requirement in photocatalysis, albeit one dificult to meet, as it involves a solid-liquid separation step that adds to the overall capital and running costs in WWTPs.16,17 AOP application to full-scale water treatment
is therefore under development. Combining catalysis with renewable energy resources, however, as in solar photocatalysis, is expected to cut down treatment costs and make AOPs more attractive to the water industry.18
An example of treatment of washing waters from pesticide containers is provided by a plant in Almería (Spain) that uses solar energy.19 Another is the
Mané Garrincha Stadium in Brasília (Brazil), renovated for the 2014 FIFA World Cup and often cited as a sustainable building for its self-cleaning roof consisting of a TiO2-coated polytetraluoroethylene membrane.20
AOPs have proved advantageous even when complete degradation and mineralization of contaminants is not required, since doing so would not be cost-effective. Instead, the process can be aimed at partial degradation, to decrease the toxicity of organic pollutants, increase their biodegradability, or both,21 while letting byproducts of the
reaction be degraded by microorganisms in a biological post-treatment step.22
Investigating the eficiency of TiO2 photocatalysis
can provide a timely contribution to water treatment approaches, particularly in view of water scarcity at the global scale.
In semiconductors, photocatalytic eficiency depends mostly on the ability of the material to generate longer-lived electrons and holes that can lead to generation of reactive species.10 Recombination of electron-hole pairs has
been described as the chief factor limiting photocatalytic reactions.
A number of strategies to improve the photocatalytic activity of TiO2 by modifying its physical and chemical
properties have been explored. These include increasing surface area, reducing particle size, generating structured mesoporous materials, creating a double-phase structure containing anatase and rutile, decreasing bandgap, and extending the light absorption range by incorporating metals or non-metals into a titania matrix.23,24 Since pure
TiO2 absorbs virtually no visible light, or does so only
slightly, incorporation of non-metals can extend absorption to the visible range.23 Doping with non-metals (such as N,
F, S, or B) or metals (among them Ag, Fe, Pd, Pt, Rh, or Ru) has improved the photocatalytic reactivity of TiO2.25
Doping with noble metals such as Ag improves TiO2
photocatalytic activity by modifying its surface properties (e.g., surface area per mass, porosity) and extending the
radiation absorption range to the visible spectrum.14,26
Doping TiO2 with non-metals, such as nitrogen and boron,
has received special attention.20,27,28 The use of these
anionic dopants leads to bandgap narrowing or formation of localized mid-bandgap states, effectively extending the absorption threshold of TiO2 into the visible range29 and/or
causing physical and chemical changes in the particles, including increased surface area, formation of mesoporous structures, uniformity in particle surface size, formation of a double-phase structure of anatase and rutile, and decreased crystal and particle sizes.20
N-doped TiO2 is the most widely investigated
properties similar to those of oxygen, the principal component of TiO2.29 Furthermore, production of the
compound is simple (a controllable synthesis process) and has low cost.27 On the basis of electronic band structure
modiication, the suficient overlapping of N 2p states with O 2p states at maximum valence band provides eficient bandgap narrowing for visible-light absorption.29 S-doping
can produce similar bandgap narrowing, yet sulfur, for its large ionic radius, is not easily incorporated into O sites in TiO2.29 C- or P-doping, on the other hand, can introduce
states too deep within the gap, which might serve as undesired recombination centers.29 Therefore, N-TiO
2
remains the leading visible-light-sensitive photocatalyst. However, Nishijima et al.30 have demonstrated that
S-doping renders TiO2 more eficient than its N-doped
counterpart as a photocatalyst under visible light for H2
evolution. Ivanov et al.31 reported that S- and C-codoped
TiO2 showed excellent photocatalytic performance during
degradation of organic dyes (rhodamine B, methylene blue), gas-phase oxidation of ethanol under visible light, and photocatalytic hydrogen generation from ethanol under UV radiation.
Wang et al.32 reported that doping TiO2 with boron
promotes photogenerated electron-hole separation, improving photocatalytic efficiency. In experiments conducted by Liang et al.,33 B-doped TiO
2 exhibited high
photocatalytic eficiency, attributed to decreased bandgap energy, during rhodamine B degradation under simulated sunlight.
Zaleska et al.34 reported that B-doping a TiO
2 matrix
using the sol-gel method facilitated transformation of the amorphous structure into anatase. Quiñones et al.35
demonstrated that the presence of boron reduced anatase crystal size in TiO2 particles and increased pore volume
and surface area, relative to the pure oxide.
Cavalcante et al.12 demonstrated a substantial
improvement in TiO2 photocatalytic eficiency by B-doping.
Factors responsible for the improved performance included large surface area, mesoporous structure, anatase-rutile crystalline structure, formation of TiIII, introduction of
boron as a B–O–Ti species, uniformity in particle surface size, and decreased crystal and particle sizes.
Elghniji et al.36 synthesized N-doped TiO2 nanoparticles
using the sol-gel reverse micelle method and investigated their visible-light photocatalytic activity in methylene blue (MB) discoloration. Experimental results revealed that N-doped TiO2 with a N/Ti atomic ratio of 0.05 required
shorter irradiation time for complete discoloration of MB than did pure nano-TiO2 or commercial TiO2 P-25
(Degussa). This remarkable photocatalytic efficiency was attributed to synergistic effects of nitrogen species,
high speciic surface area, and a pure anatase crystalline framework.
Using single-step lame spray pyrolysis, Fujiwara et al.37
synthesized Ag-doped TiO2 particles that proved highly
effective catalysts in MB degradation under visible light. Although many advantages have been reported for the incorporation of various elements into titania matrices, few studies have compared the eficiency of the resulting catalysts with that of TiO2 P25 powder, one of the most
eficient commercial photocatalysts. This scarcity warrants comparing the photocatalytic eficiencies of commercial P25-type and laboratory-synthesized TiO2.
Metal doping can have disadvantages: doped materials exhibit low thermal stability, while metal leaching and possible toxicity diminish potential applicability to water treatment. Furthermore, metal centers can act as deep electron traps, reducing photocatalytic eficiency.38 Further
studies are thus necessary to ascertain optimal doping doses and their effect on TiO2 photocatalytic activity.
In this study, X-doped TiO2 synthesis (X = N, B, or
Ag) was examined as a strategy to increase the rate of MB photodegradation under irradiation with visible light. MB was selected as a pollutant model for its relative stability, which hampers its degradation by traditional wastewater treatment methods. Newly developed dyes are typically more resistant to photolysis, oxidation, and biodegradation than traditional counterparts.39 MB is also the most common
compound employed in cotton, wood, and silk dyeing. MB inhalation can lead to breathing problems; direct contact can cause eye damage, local burns, nausea, vomiting, hyperhidrosis, and mental disorders.40
In the present study, the oxides were characterized by thermogravimetric analysis (TGA), X-ray diffraction (XRD), scanning and transmission electron microscopy (SEM and TEM), speciic surface area calculation using the Brunauer-Emmett-Teller (BET) method, Fourier transform infrared spectroscopy (FTIR), diffuse relectance UV-Vis spectroscopy (DR-UV-Vis), and X-ray photoelectron spectroscopy (XPS).
Experimental
Materials
0.45 µm pore size polyethersulfone membrane ilters were employed. Deionized water was used in all experiments.
Synthesis of catalysts
Pure TiO2 and B-, Ag-, and N-modiied TiO2 nanoparticles
were synthesized from titanium(IV) isopropoxide using the sol-gel method, adapted from Cavalcante et al.12
A 19.10 mL volume of titanium(IV) isopropoxide was mixed with 16.10 mL of glacial acetic acid (molar ratio 1:4) under constant stirring until a metal acetate complex was formed. The acid acted as a chelant agent, controlling the hydrolysis process. After homogenization, 19.10 mL of isopropyl alcohol (Ti/alcohol ratio 1:1, v/v) were added and the solution was stirred for 1 h, after which a solution consisting of 30 mL of water and 1 mL of nitric acid was added to the mixture, followed by another 2 h stirring while keeping the molar ratios of H2O/Ti at 25 and H+/Ti
at 0.5. The system was subsequently maintained at 40 °C for around 48 h. The resulting TiO2 solution was then dried
in an oven at 100 °C for 24 h and the powder thus obtained was macerated in a mortar and calcined at 450 °C for 4 h.
Preparation of B-, N-, and Ag-doped TiO2 followed
the same procedure, but employing 1.44 g of boric acid, 1.34 mL of ammonia, and 0.40 g of silver nitrate as the boron, nitrogen, and silver precursors, respectively. Each precursor was dissolved in a solution containing 30 mL of water and 1 mL of nitric acid. These amounts of dopants were calculated to yield catalysts at a 5% ratio (m/m), based on previous investigations by our research group.12,13
Characterization
Surface morphology was examined using a JSM-7100F scanning electron microscope and a JEM-2100 transmission electron microscope (both Jeol). For SEM, the samples were mounted on carbon tape and sputter-coated with gold. For TEM, the samples were dispersed in ethanol with the aid of ultrasound and deposited onto copper grids. Particle diameter was determined using ImageJ software to count the particles seen in TEM images acquired from different ields in each sample.41
The crystal structures of powders were investigated by XRD from 8° to 70° (2θ) at 0.02° increments with
a measuring time of 5 s per step, employing a D2
Phaser diffractometer (Bruker) with a CuKα radiation source (λ = 1.15418 nm). Rietveld42 parameters were
calculated using Von Dreele and Toby’s General Structure Analysis System-II Crystal Structure Reinement package
(GSAS-II).43 Thermogravimetric measurements were
performed on a thermobalance, with samples placed in
an alumina crucible and analyzed on a TGA Q50 device (Shimadzu) at a heating rate of 10 °C min−1 and scan
temperatures from 25 to 900 °C, under a N2 low rate of
50 mL min–1 in the furnace.
UV-Vis diffuse relectance electronic spectra of the powders were obtained using a Lambda 650 UV-Vis spectrometer (PerkinElmer) equipped with an integrating sphere for diffuse relectance. Scans were performed at 200 and 800 nm. The UV-Vis spectra recorded in diffuse reflectance (Rsample) mode were transformed using the
Kubelka-Munk function, which is based on determination of Kubelka-Munk absorption (K) and scattering (S)
coeficients, using equation 8:44,45
(8)
where R∞ is defined as Rsample/Rreference, with Rreference as
the diffuse relectance value obtained for BaSO4 using
equation 9:45
(9)
where C is a constant and m is a constant that depends
on the optical transition mode. Indirect optical bandgap values (Egap; eV) were obtained from a Tauc plot,
(F(R∞)hv)1/2, as a function of photon energy hv, considering the intersection of the linear portion of the curve with the x-axis.45 For FTIR, the samples were shaped into pellets
using potassium bromide and spectra recorded on a PerkinElmer 100 spectrophotometer in the 4000-450 cm–1
range. Elemental composition was determined by XPS. The experiments were performed in a K-Alpha spectrometer (Thermo Scientiic) with a monochromatic X-ray source (AlKα). The carbon contamination C1s peak appearing at 284.80 eV was used as the reference for binding energy calibration. All acquired spectra were treated with CasaXPS software. Specific surface areas were determined via nitrogen adsorption analysis based on BET isotherms. Pore size distribution and total volume, based on Brunauer-Joyner-Hallenda (BJH) isotherms, were determined on a TriStar 300 instrument (Micrometrics).
Photodegradation assays
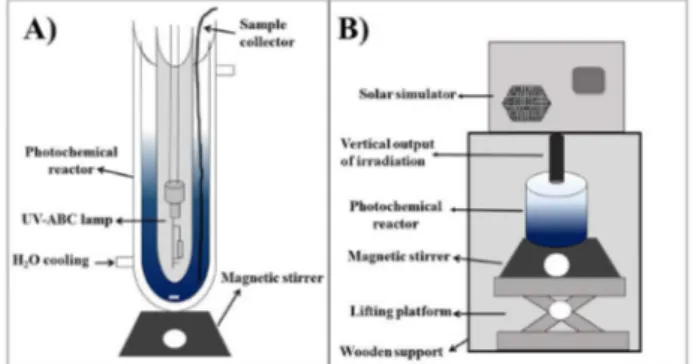
222-578 nm, 254 nm maximum absorbance).46 Photon
lux inside the photoreactor was 3.71 × 10¹⁹ photons s–1,
experimentally determined by chemical actinometry with 0.15 mol L–1 potassium ferrioxalate complex.47 A
magnetic stirrer homogenized the solution throughout the experiment. The jacket temperature (25 °C) of the stirred tank was controlled with the aid of a thermostatic bath. Photodegradation experiments employed a MB aqueous solution (120 mg L−1) containing 0.5 g L−1 of catalyst.
The experiments were performed without pH control (pH ca. 5.0 ± 0.2). Reaction time was 180 min and aliquots were collected at predetermined intervals and iltered with Millipore Millex syringe-driven, 0.45 µm pore-size polyethersulfone membrane ilters to remove the catalyst before the analytical procedures. MB degradation was monitored by UV-Vis absorption, with measurements at 664 nm (the longest wavelength of MB) on a U-3000 UV-Vis spectrophotometer (Hitachi). To monitor MB concentration, a calibration curve was obtained, which obeyed Beer’s law in the 0.25-4.0 mg L–1 range, with
Abs (a.u.) = 0.00509 + 0.32156 [MB, mg L–1], R = 0.9971, SD = 0.036.
Artiicial sunlight irradiation was performed with a solar simulator (Abet Technology; Figure 1B) equipped with a 150 W XOP xenon lamp (Abet Technology). For runs performed under visible light, a 400 nm cutoff ilter was placed between lamp and reactor. The experiments were conducted in a borosilicate glass container positioned immediately below the lamp, at a height adjusted to collect the desired radiation, while the solution was continuously homogenized using a magnetic stirrer. Irradiation intensity was calibrated at 200 mW cm–2 using a 15151 reference
cell (Abet Technologies) with direct incidence of photons on the liquid surface on top of the glass container. A 25 mL volume of solution containing 40 mg L–1 of MB and
12.5 mg of catalyst was photoirradiated. Prior to irradiation, the solution was slurred with an appropriate amount of catalyst and allowed to equilibrate in the dark for 60 min. The experiments were performed without pH control (pH ca. 5.0). Reaction time was 180 min and aliquots were collected at predetermined intervals. MB degradation was monitored by UV-Vis absorption.
Results and Discussion
Characterization results
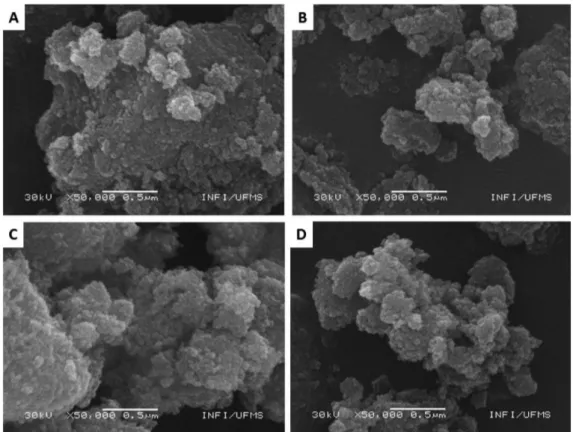
The materials were morphologically characterized to evaluate the inluence of B, N, and Ag incorporation into synthesized TiO2. SEM images of pure and N-, B-, and
Ag-doped TiO2 (Figure 2) revealed oxides constituted of
large aggregate particles, each in the nanometer range, although not individually discernible because of insuficient image resolution.
Representative TEM images and histograms of estimated particle size (Feret diameter) distribution for pure and N-doped TiO2 are shown in Figure 3. TiO2
particles were polydisperse. Their dimensions could not be accurately determined, but most ranged from 5 to 30 mm, in both samples.
The synthesized samples were subjected to TGA to evaluate stability or thermodecomposition (Figure 4). TGA curves for pure, N-doped, and Ag-doped TiO2 revealed a
inal weight loss (up to 900 °C) of only 3-4%. Weight loss was more pronounced between room temperature and ca. 100 °C, a phenomenon attributed to evaporation of water adsorbed onto the catalyst surface. Weight loss in the 200-400 °C range possibly resulted from decomposition of organic solvents and organic matter, organic residues are often present in samples synthesized by the sol-gel method. Above 400 °C, no major weight loss was observed, which demonstrates the stability and purity of the prepared catalysts.
As shown by the thermogravimetric curve for B-doped TiO2, mass loss was greater than for other samples up to
ca. 300 °C. In this range, roughly 10% of the original mass was lost, which can be attributed to thermal decomposition of residual organic groups in B-doped TiO2. Boron may be
incorporated into a TiO2 matrix as a Ti–O–B bond and/or
transformed into a B2O3 phase.12,13 Having only three
valence electrons, boron can behave as a Lewis acid,48
facilitating surface adsorption of water, with subsequent diffusion into the bulk of the material. This may explain the higher weight losses associated with water elimination from this catalyst up to 200 °C.
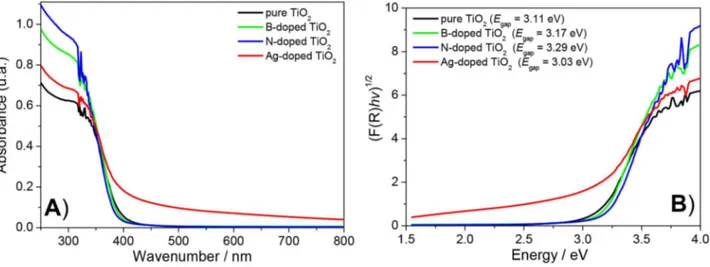
Diffuse relectance spectra of pure and doped TiO2 are
shown in Figure 5A. For the doped samples, the typical absorption edge (due to electronic transitions from valence band to conduction band in TiO2) was modiied by the onset of
Figure 2. SEM images of (A) pure, (B) B-doped, (C) N-doped, and (D) Ag-doped TiO2.
Figure 3. TEM images and particle distribution of (A) pure and (B) N-doped TiO2.
a relatively broad absorption band in the visible region, whose intensity depended on sample type.49 This modiication in the
absorption edge was less pronounced for B- and N-doped samples, and more evident for Ag-doped TiO2. Extrapolation
of tangent lines of Kubelka-Munk functions vs. photon
energy provided Egap values for each oxide (Figure 5B).
For all catalysts, the estimated Egap values remained within
agreement with other studies.35 Ag-doped TiO
2 exhibited
lower Egap than the other catalysts investigated, which is
consistent with a study by Ramos et al.,14 who found E gap
values to decrease with rising amounts of added silver. In our case, it should be noted that the absorption intensity
of Ag-doped TiO2 did not converge to zero beyond
band edge, extending absorption into the visible range. The infrared spectra of pure and doped TiO2 nanoparticles
(Figure 6) showed broad bands in the 3000-3400 cm−1 range
(with a maximum at 3200 cm–1) that probably represent
O–H stretching vibration from adsorbed water. A band in the 1610-1650 cm–1 range corresponded to the OH bending
vibration mode of water adsorbed onto the oxide surface.50
After B-doping, the O–H stretching vibration band became broader, possibly owing to the larger amount of water adsorbed onto the TiO2 surface. This is in accordance with
TGA results.
Absorption bands were also found at 600 cm−1 and
might be attributed to typical Ti–O–Ti vibration.51 After
N-doping, the Ti–O stretching vibration band became broader, possibly as a result of interaction with the doping nitrogen and the hydrogen from the hydroxyl group.50
In the FTIR spectrum of B-TiO2 nanoparticles, the
pronounced intensity observed in the 1300-1500 cm−1
region (with a maximum at 1400 cm–1) was ascribed to
asymmetric B–O stretching on the surface.52 Boric acid
species possibly ascribed to the presence of tricoordinated interstitial boron (in the form of B 3p), as well as outer-sphere boric acid, are potential sources of the peak seen around 1300-1400 cm−1.32,52 The band at 1200 cm−1,
commonly attributed to stretching vibration of B–O bonds, corroborates these indings.32,53
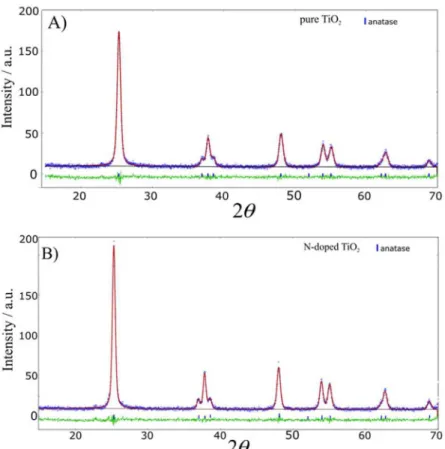
Phase compositions and crystal structures of pure and doped TiO2 were investigated by XRD (Figure 7). All
diffraction peaks of the annealed powders were indexed to the anatase phase of TiO2, with characteristic occurrences
at 25.4, 37.8, 48.1, 54.2, 55.2, and 62.7°,12,33 except for
B-doped TiO2, where a peak characteristic of the rutile
phase was observed at 27.8°,12,33 indicating that boron may
be incorporated into this phase, as observed earlier.13
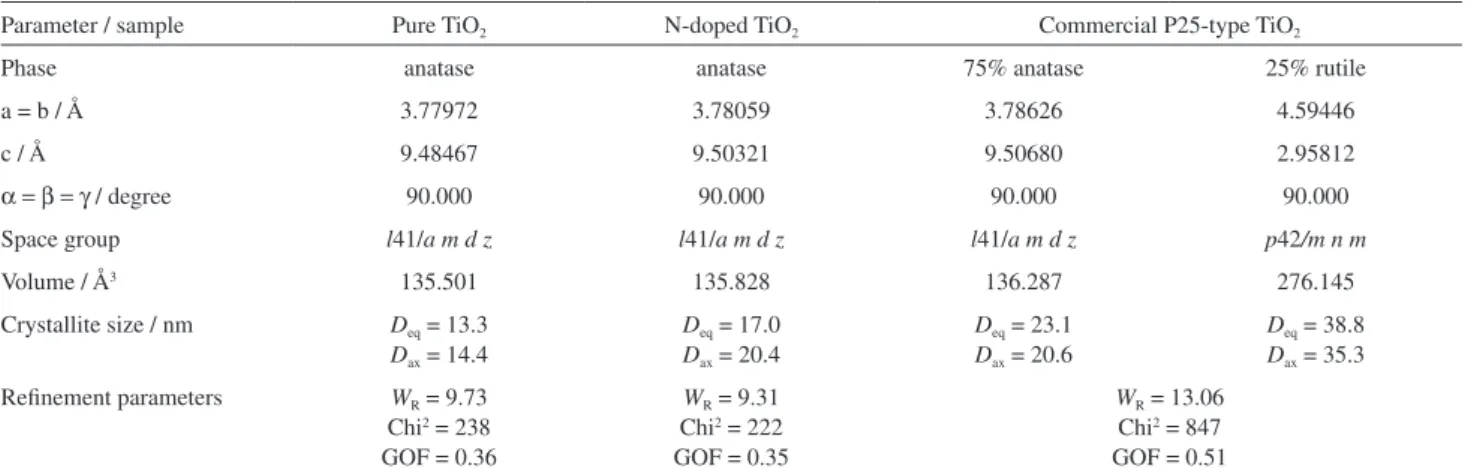
Rietveld reinements were performed for a detailed examination of phase compositions and structural features of pure and N-doped TiO2. For comparison, the procedure
was also applied to commercial TiO2 P25. Refined
parameters that include crystallite size and unit-cell parameters were calculated (Table 1).
Anisotropic equatorial and axial crystal sizes were estimated at 13.3 and 14.4 nm for pure TiO2 and at 17.0 and
20.4 nm for N-doped TiO2, respectively. The synthesized
oxide is therefore constituted of smaller crystals than those of commercial TiO2. This conirms that both pure
and N-doped TiO2 crystallizes in the tetragonal pattern of
anatase. Figure 8 shows the inal Rietveld reinement plots. Figure 4. Thermogravimetric curves of synthesized photocatalysts.
Figure 5. (A) UV-Vis absorption spectra and (B) Tauc plots of the square root of the Kubelka-Munk function R∞ (F(R∞)hv)1/2 vs. photon energy for
Surface chemical compositions and oxidation states of pure and N-doped TiO2 were also analyzed by XPS. In
the XPS spectra shown in Figure 9, Ti, O, and C peaks are evident. The C1s peak located at 284.6 eV results mainly from environmental contamination. For the N-doped
catalyst, an N1s peak is observed (see Figure 9, insert), revealing presence of nitrogen in the sample. Table 2 summarizes the surface chemical compositions.
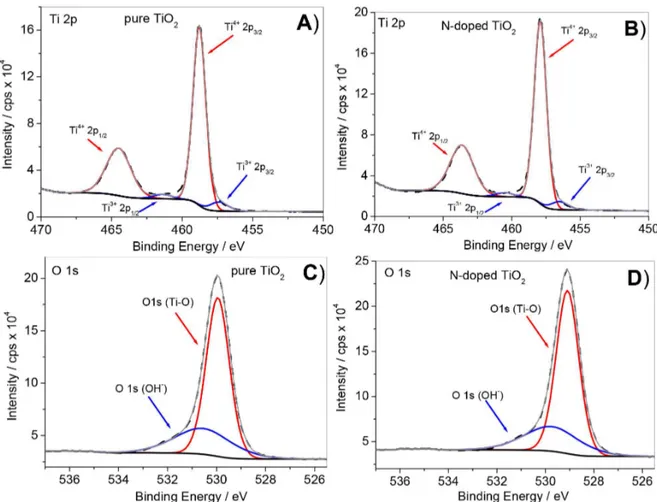
Figures 10A and 10B show Ti2p and O1s high-resolution spectra obtained for pure and N-doped TiO2. The
principal binding energies contributing to the Ti2p3/2 spectra
of pure and N-doped TiO2 appear at 458.77 and 457.91 eV,
respectively. The 5.72 eV distance between Ti2p3/2 and
Ti2p1/2 peaks indicates that titanium is present mostly as
Ti4+,54 corresponding to relative TiO
2 concentrations of
93.44 and 94.12% in pure and N-doped TiO2, respectively
(Table 3). Deconvolution of Ti2p XPS data also revealed presence of Ti3+ in both catalysts. Ti2p
3/2 binding energies
corresponding to Ti3+ are centered at 457.37 and 456.51 eV,
respectively, indicating relative Ti2O355 concentrations of
6.56 and 5.88% for pure and N-doped TiO2, respectively.
Figures 10C and 10D depict the O1s spectra of pure and N-doped TiO2. The O1s regions of both catalysts were
very similar, showing two peaks (see binding energy values in Table 3) corresponding to Ti–O and surface-adsorbed O2/OH groups.55
For N-doped TiO2, N1s appeared at 399.0 eV (Figure 11
and Table 3), which may be ascribed to N-doped TiO2.56,57
Low intensity precluded reliable assignment of the peak at 399.0 eV (only 0.41%, Table 3), which, however, can be attributed to a number of Ti–N bonding environments, such as formation of O–Ti–N (substitutional N) and TiO–N (interstitial N) structures,56 and/or to traces of
surface-chemisorbed ammonium58 residual from sol-gel synthesis.
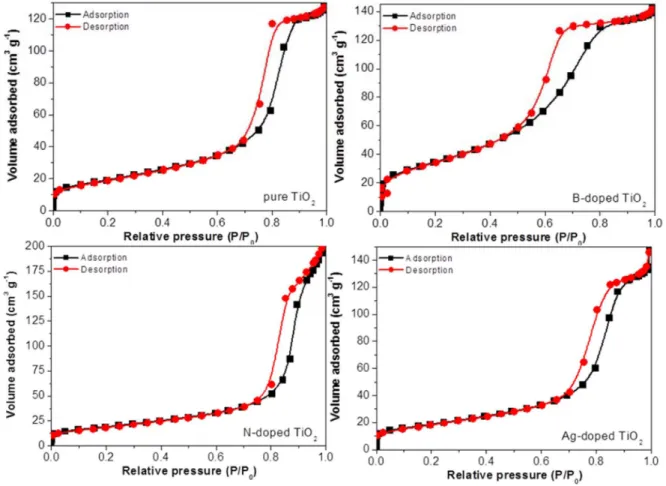
BET surface areas (SBET), pore volumes (Vp) and pore
diameters (Dp) are shown in Table 4. Mean Dp lies within the
18.36-6.96 nm range. B-doped TiO2 exhibits larger speciic
surface areas than the other catalysts, an advantageous trait for photocatalytic performance. These results are in agreement with data from our previous paper12 reporting
Figure 6. FTIR spectra of pure and doped TiO2.
Figure 7. Diffractograms of pure and doped TiO2 calcined at 450 °C.
Table 1. Rietveld reinement parameters of TiO2 samples
Parameter / sample Pure TiO2 N-doped TiO2 Commercial P25-type TiO2
Phase anatase anatase 75% anatase 25% rutile
a = b / Å 3.77972 3.78059 3.78626 4.59446
c / Å 9.48467 9.50321 9.50680 2.95812
α =β =γ / degree 90.000 90.000 90.000 90.000
Space group l41/a m d z l41/a m d z l41/a m d z p42/m n m
Volume / Å3 135.501 135.828 136.287 276.145
Crystallite size / nm Deq = 13.3
Dax = 14.4
Deq = 17.0
Dax = 20.4
Deq = 23.1
Dax = 20.6
Deq = 38.8
Dax = 35.3
Reinement parameters WR = 9.73
Chi2 = 238
GOF = 0.36
WR = 9.31
Chi2 = 222
GOF = 0.35
WR = 13.06
Chi2 = 847
GOF = 0.51
that boron presence increases speciic surface areas. Pore widths between 2 and 50 nm correspond to mesopores, and the standard isotherm (Figure 12) is in good agreement with the typical pattern for mesoporous materials (Type IV in the IUPAC classiication of physical adsorption isotherms).59
For N-doped TiO2, maximum mean pore size
distribution, as derived from the desorption branch (BJH model), was found at 18 nm, larger therefore than for B-doped TiO2 (6.96 nm). Monomodal pore size distribution
in the mesoporous region was mainly associated with primary intra-aggregation of nanocrystals of uniform size.60
SBET values are strongly dependent on nitrogen
source. The surface area of N-doped TiO2 (68.1 m2 g–1)
was significantly smaller than for the B-doped oxide (126.4 m2 g–1), indicating that using ammonia in the
preparation may result in particle aggregation. These results are in agreement with data obtained by He et al.60
Investigation of photocatalytic efficiency
The photocatalytic activities of the synthesized oxides were investigated under UV-ABC radiation (maximum emission at 254 nm) and with a solar simulator, using MB as an organic model compound at natural pH (pH ca. 5.0). For comparisons, experiments were also performed using TiO2
Figure 8. Rietveld reinement plots of (A) pure and (B) N-doped TiO2 prepared using the sol–gel method and calcined at 450 °C. Calculated and observed
patterns are shown as black lines and gray crossings, respectively, with residues as light gray lines. Anatase Bragg peak positions are indicated by black bars
Table 2. Surface chemical compositions of pure and N-doped TiO2
Catalyst XPS surface chemical composition / %
N O Ti O/Ti
Pure TiO2 − 69.72 30.28 2.30
N-Doped TiO2 0.41 70.41 29.18 2.41
XPS: X-ray photoelectron spectroscopy.
Figure 9. XPS survey of pure and N-doped TiO2.
Figure 8. Rietveld reinement plots of (A) pure and (B) N-doped TiO2 prepared using the sol-gel method and calcined at 450 °C. Calculated and observed
P25 (Evonik) having 75% anatase and 25% rutile (Table 1). The photocatalytic activities of pure and doped TiO2 were first investigated under UV-ABC radiation
(120 mg L–1 of MB and 0.5 g L–1 of catalyst) (Figure 13A).
Experiments conducted in the absence of catalyst showed that MB degradation via photolysis was low, relative to Table 3. Binding energies (eV) obtained through XPS for pure and N-doped TiO2
Region / sample Pure TiO2 N-doped TiO2
C1s
C–C, C–H 284.80 284.80
C–OH, C–O–C 286.30 286.30
O–C=O 288.80 288.80
O1s O–Ti 529.95 529.09
Ti–OH 530.55 529.74
Ti2p3/2
TiO2 458.77 457.91
Ti2O3 457.37 456.51
Ti2p1/2
TiO2 464.49 463.63
Ti2O3 461.36 460.50
N1s − − 399.0
XPS: X-ray photoelectron spectroscopy.
Figure 10. High-resolution XPS Ti2p and O1s spectra of pure (A and C) and N-doped TiO2 (B and D).
Figure 11. High-resolution N1s XPS spectrum of N-doped TiO2.
Table 4. Surface area data for pure and doped TiO2
Catalyst SBET / (m2 g–1) Vpa / (cm3 g–1) Dp / nm
Pure TiO2 69.5 ± 0.2 0.197 11.35
N-doped TiO2 68.1 ± 0.14 0.313 18.36
B-doped TiO2 126.4 ± 0.17 0.220 6.96
Ag-doped TiO2 67.4 ± 0.16 0.227 13.47 aObtained from the volume of N
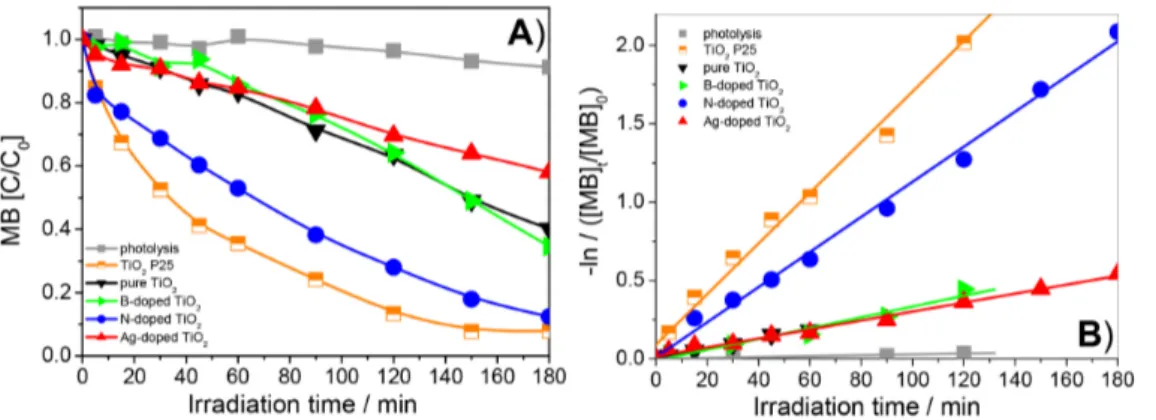
the corresponding photocatalysis, resulting in ca. 37% decomposition with 180 min UV-ABC irradiation (Table 5). In the presence of B- or Ag-doped TiO2, MB
decomposition decreased, compared with pure TiO2.
MB removal using pure TiO2 as a photocatalyst reached
89% at 180 min of irradiation, while only 52 and 73% of MB were decomposed with Ag- and B-doped oxide, respectively, possibly owing to excess dopant, resulting in poorer photocatalytic activity probably consequent to the appearance of new sites for electron-hole recombination. Working with phenol degradation under UV radiation, Zaleska et al.34 reported lower photocatalytic activity of
B-doped TiO2, compared with pure TiO2 synthesized by
the sol-gel method. A higher amount of boron dopant resulted in the appearance of a sassolite phase (H3BO3),
which decreased the photocatalytic activity, depending on the type of organic compound tested.61
Increased adsorption capacity of TiO2 with Ag-doping
has been reported,62,63 but this effect has not been consistently
observed.64,65 For the photocatalysts synthesized in this
present study, a reduction in degradation rate was observed. According to Ramos et al.,14 this possibly occurs because
maximum saturation is reached on the semiconductor surface and excess silver occupies active sites in the catalyst,
decreasing catalytic activity by lowering the incidence of radiation on TiO2 particles and decreasing the number of
active sites for substrate adsorption.
Lin et al.66 prepared TiO2/Ag composites and evaluated
the effect that operational pH of the synthesis process had on the zeta potentials of TiO2 and Ag carrier. Isoelectric
points (pH values at which the compound has a zero net charge) of 4.0 and 6.8 were found for Ag and TiO2,
respectively. Morphological surface analysis via SEM of TiO2/Ag thus prepared revealed that, at pH 3.0, TiO2 and Ag
had the same surface electrical charges, repelling each other and precluding TiO2 nanoparticles from easily attaching to
the Ag surface, although not preventing mutual aggregation of TiO2 nanoparticles. By maintaining the synthesis solution
at pH 5.8, TiO2 and Ag particles exhibited opposite surface
charges with maximum difference, resulting in high TiO2
dispersibility and optimal combination between TiO2 and
Ag, with best performance in photodegrading acetone, the model compound employed. Conversely, TiO2/Ag prepared
at pH 3.0 proved the least eficient. In the present study, synthesis was carried out in acidic medium and TiO2 and
Ag exhibited the same electrical properties, causing TiO2
In the present study, by contrast, N-doping signiicantly improved TiO2 performance (95% degradation for N-doped
TiO2 vs. 74% for pure TiO2 with 90 min irradiation).
Compared with TiO2 P25, the N-doped oxide proved
eficient, completely removing MB with 180 min UV-ABC irradiation (λmax = 254 nm). The high activity of TiO2 P25
results from the optimization of parameters such as phase composition, crystallite size, and surface area.67
Non-metal dopants have been described as more eficient than most metal ions, owing to less pronounced formation of recombination centers.10 Nitrogen in N-doped
TiO2 leads to formation of Ti3+ species, which can trap
photogenerated electrons in the conduction band and prevent recombination of electron-hole pairs.68 Therefore,
formation of Ti3+ species enhances photocatalytic activity,
which is evident from XPS spectra (see Figure 10B). Crystallite size also has a pronounced effect: the enhanced photocatalytic activity of N-doped TiO2 can be attributed
to its smaller crystal size (seen with Rietveld reinement), which accelerates surface charge transfer, decreasing the likelihood of recombination of photoinduced electron-hole pairs.36
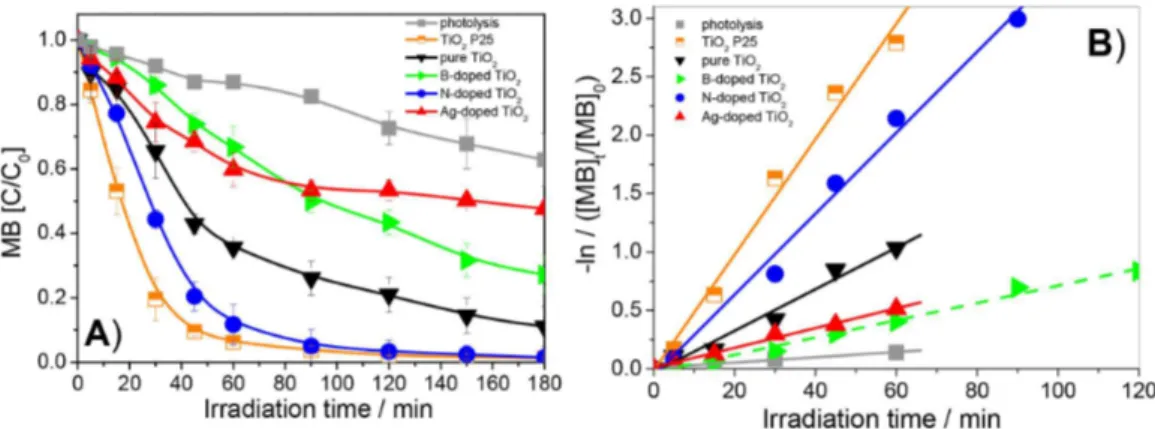
To quantify differences in degradation rates, MB oxidation data were employed to calculate kap, the
pseudo-irst-order kinetic constant (Table 5), from the slope of the regression line representing −ln ([MB]t/[MB]0) vs.
time (Figure 13B), where [MB]0 and [MB]t are the initial
concentration and the concentration after t minutes of irradiation, respectively. The magnitude of kap follows the
order TiO2 P25 > N-doped TiO2 > pure TiO2 > Ag-doped
TiO2 > B-doped TiO2. N-doped TiO2 proved roughly
2.2 times more effective than pure TiO2 in degrading MB.
The photocatalytic eficiency of synthesized N-doped TiO2
was quite similar to that of TiO2 P25.
To investigate photocatalytic activity under visible-light irradiation, experiments were performed in a solar simulator using 40 mg L−1 of MB and 0.4 g L−1 of catalyst
(Figure 14 and Table 6). N-doped TiO2 exhibited the
highest photocatalytic activity (88% of MB removal with 180 min irradiation), with a kinetic constant (calculated from Figure 14B data, using ln (C/C0) vs. time itting) of
1.12 × 10⁻² min–1 (Table 6), roughly 3.6 times that for pure
TiO2 (0.31 × 10⁻² min–1) and similar to the kinetic constant
for TiO2 P25 (1.61 × 10⁻² min–1).
Incorporation of non-metals to the catalyst creates heteroatomic surface structures, modifying the properties and activity of TiO2 under visible light.69 N-doping
accounts for the red shift observed at the light absorption edge, narrowing the bandgap.36 For comparison, simulated
UV-Vis irradiation for 180 min in the absence of photocatalyst failed to degrade MB. Pure and Ag-doped TiO2 led to lower MB degradation, of roughly 60 and
42%, respectively, with 180 min treatment, while for the B-doped oxide this rate reached ca. 65%. Over the same period, ca. 92% degradation was achieved with TiO2 P25.
To investigate catalyst eficiency under visible radiation alone, a 400 nm longpass ilter was employed. As shown in Figure 15, negligible (5%) MB degradation was observed for photolysis (λ > 400 nm) conducted in the absence of catalysts, while N-doped TiO2 proved more eficient
than TiO2 P25. The high activity of N-doped TiO2 under
visible-light irradiation has been attributed to nitrogen Table 5. Methylene blue degradation rates and respective pseudo-irst-order kinetic constants (kap) for experiments conducted under UV-ABC
radiation
Photocatalyst Degradation / % kap / min–1 R
Photolysis 37 0.23 × 10⁻² 0.996
TiO2 P25 99 4.95 × 10⁻² 0.994
Pure TiO2 89 1.78 × 10⁻² 0.988
B-doped TiO2 73 0.74 × 10⁻² 0.994
Ag-doped TiO2 52 0.85 × 10⁻² 0.996
N-doped TiO2 98 3.47 × 10⁻² 0.996
Figure 13. (A) Methylene blue degradation curves: [MB]0 = 120 mg L–1; [catalyst] = 0.5 g L–1 under UV-ABC radiation; (B) pseudo-irst-order kinetic
species responsible for the red shift detected at the light absorption edge.36 Hurum et al.70 reported that presence
of a rutile phase in TiO2 P25 extends photoactivity into
the visible range, which explains why the photocatalytic activity observed under visible light (λ > 400 nm) was low.
Conclusions
In this investigation of novel photocatalysts synthesized using the sol-gel method, TGA and FTIR measurements showed surface water absorption to be most pronounced for Table 6. Methylene blue removal rates and pseudo-irst-order kinetic constants (kap) obtained in a solar simulator device
Photocatalyst Degradation / % kap / min–1 R
None (photolysis) 9 0.03 × 10⁻² 0.990
TiO2 P25 92 1.61 × 10⁻² 0.997
Pure TiO2 60 0.31 × 10⁻² 0.996
B-doped TiO2 65 0.34 × 10⁻² 0.983
Ag-doped TiO2 42 0.29 × 10⁻² 0.995
N-doped TiO2 88 1.12 × 10⁻² 0.997
Figure 14. (A) Methylene blue (MB) degradation in a solar simulator device: [MB]0 = 40 mg L–1; [catalyst] = 0.5 g L–1; (B) pseudo-irst-order kinetic
constant calculation.
Figure 15. Methylene blue (MB) degradation by TiO2 P25 and N-doped
TiO2 in a solar simulator device using a longpass ilter (> 400 nm):
[MB]0 = 40 mg L–1; [catalyst] = 0.5 g L–1.
B-doped TiO2, without major changes to bandgap energy
values. Egap of Ag-doped TiO2 was slightly lower than for
the other catalysts. Rietveld reinement data revealed the powders to have a 100% anatase crystalline structure. XPS data indicated the presence of Ti3+ in pure and N-doped
TiO2.
Degradation eficiency was evaluated by MB removal and pseudo-irst-order kinetic parameters in experiments carried out under UV-ABC and solar light radiation. MB photodegradation results showed that the photocatalytic
efficiency of TiO2 was substantially enhanced by
N-doping, for both radiation sources. Despite its ability to absorb radiation in the visible region, Ag-doped TiO2
exhibited lower photocatalytic performance than the other synthesized catalysts.
Under visible radiation, N-doped TiO2 showed
higher photocatalytic efficiency than TiO2 P25. The
superior activity of N-doped TiO2 relative to pure TiO2
can be attributed to synergic effects of nitrogen species, small crystallite size, and the consequent decrease in photoinduced electron-hole pair recombination.
The results showed synthesis by the sol-gel method to be a simple method to produce eficient photocatalysts for removal of organic compounds. In addition, the eficiency demonstrated by these catalysts under sunlight irradiation allows lowering the cost of photocatalytic processes.
Acknowledgments
References
1. Santiago-Morales, J.; Agüera, A.; Gómez, M. M.; Fernández-Alba, A. R.; Giménez, J.; Esplugas, S.; Rosal, R.; Appl. Catal., B 2013, 129, 13.
2. Malato, S.; Fernández-Ibáñez, P.; Maldonado, M. I.; Blanco, J.; Gernjak, W.; Catal. Today 2009, 147, 1.
3. Cavalcante, R. P.; Sandim, L. R.; Bogo, D.; Barbosa, A. M. J.; Osugi, M. E.; Blanco, M.; Oliveira, S. C.; Matos, M. F. C.; Machulek Jr., A.; Ferreira, V. S.; Environ. Sci. Pollut. Res. 2013,
20, 2352.
4. Klavarioti, M.; Mantzavinos, D.; Kassinos, D.; Environ. Int.
2009, 35, 402.
5. Méndez-Arriaga, F.; Esplugas, S.; Giménez, J.; Water Res. 2010,
44, 589.
6. Andreozzi, R.; Caprio, V.; Insola, A.; Marotta, R.; Catal. Today
1999, 53, 51.
7. Rauf, M. A.; Ashraf, S. S.; Chem. Eng. J. 2009, 151, 10.
8. Banerjee, S.; Dionysiou, D. D.; Pillai, S. C.; Appl. Catal., B
2015, 176-177, 396.
9. Cavalcante, R. P.; Dantas, R. F.; Bayarri, B.; Gonzalez, O.; Giménez, J.; Esplugas, S.; Machulek Jr., A.; Appl. Catal., B
2016, 194, 111.
10. Etacheri, V.; Valentin, C. D.; Schneider, J.; Bahnemann, D.; Pillai, S. C.; J. Photochem. Photobiol., C 2015, 25, 1. 11. Ahmed, S.; Rasul, M. G.; Martens, W. N.; Brown, R.; Hashib,
M. A.; Desalination 2010, 261, 3.
12. Cavalcante, R. P.; Dantas, R. F.; Bayarri, B.; González, O.; Giménez, J.; Esplugas, S.; Machulek Jr., A.; Catal. Today 2015, 252, 27.
13. Cavalcante, R. P.; Dantas, R. F.; Bayarri, B.; González, O.; Wender, H.; Giménez, J.; Esplugas, S.; Machulek Jr., A.; Appl. Catal., B 2015, 176-177, 173.
14. Ramos, D. D.; Bezerra, P. C. S.; Quina, F. H.; Dantas, R. F.; Casagrande, G. A.; Oliveira, S. C.; Oliveira, M. R. S.; Oliveira, L. C. S.; Ferreira, V. S.; Oliveira, S. L.; Machulek Jr., A.; Environ. Sci. Pollut. Res. 2015, 22, 774.
15. Castro, D. C.; Cavalcante, R. P.; Jorge, J.; Martines, M. A. U.; Oliveira, L. C. S.; Casagrande, G. A.; Machulek Jr., A.; J. Braz. Chem. Soc. 2016, 27, 303.
16. Sarkar, S.; Chakraborty, S.; Bhattacharjee, C.; Ecotoxicol. Environ. Saf. 2015, 121, 263.
17. The, M.; Mohamed, A. R.; J. Alloys Compd. 2011, 509, 1648.
18. Miranda-García, N.; Maldonado, M. I.; Coronado, J. M.; Malato, S.; Catal. Today 2010, 151, 107.
19. Malato, S.; Maldonado, M. I.; Fernández-Ibáñez, P.; Oller, I.; Polo, I.; Sánchez-Moreno, R.; Mater. Sci. Semicond. Process.
2016, 42, 15.
20. http://www.agenciabrasilia.df.gov.br/2013/02/20/membrana-da-cobertura-do-estadio-foto/, accessed on September 28, 2016.
21. Doorslaer, X. V.; Dewulf, J.; Maerschalk, J. D.; Langenhove, H. V.; Demeestere, K.; Chem. Eng. J. 2015, 261, 9.
22. Malato, S.; Blanco, J.; Vidal, A.; Alarcón, D.; Maldonado, M. I.; Cáceres, J.; Gernjak, W.; Sol. Energy 2003, 75, 329.
23. Devi, L. G.; Kavitha, R.; Appl. Catal., B 2013, 140-141, 559. 24. Henderson, M. A.; Surf. Sci. Rep. 2011, 66, 185.
25. Diebold, U.; Surf. Sci. Rep. 2003, 48, 53.
26. Linsebigler, A. L.; Lu, G.; Yates, J. T.; Chem. Rev. 1995, 95,
735.
27. Li, H.; Hao, Y.; Lu, H.; Liang, L.; Wang, Y.; Qiu, J.; Shi, X.; Wang, Y.; Yao, J.; Appl. Surf. Sci. 2015, 344, 112.
28. Chen, Y.; Liu, K.; Powder Technol. 2016, 303, 176.
29. Zhang, L.; Tan, P. Y.; Lim, C. K.; Guo, X.; Tse, M. S.; Tan, O. K.; Chang, V. W. C.; J. Environ. Chem. Eng. 2016, 4, 357.
30. Nishijima, K.; Kamai, T.; Murakami, N.; Tsubota, T.; Ohno, T.; Int. J. Photoenergy 2008, 2008, 1.
31. Ivanov, S.; Barylyak, A.; Besaha, K.; Bund, A.; Bobitski, Y.; Wojnarowska-Nowak, R.; Yaremchuk, I.; Kus-Li kiewicz, M.; Nanoscale Res. Lett. 2016, 11, 140.
32. Wang, W.-K.; Chen, J.-J.; Gao, M.; Huang, Y.-X.; Zhang, X.; Yu, H.-Q.; Appl. Catal., B 2016, 195, 69.
33. Liang, L.; Yulin, Y.; Xinrong, L.; Ruiqing, F.; Yan, S.; Shuo, L.; Lingyun, Z.; Xiao, F.; Pengxiao, T.; Rui, X.; Wenzhi, Z.; Yazhen, W.; Liqun, M.; Appl. Surf. Sci. 2013, 265, 36.
34. Zaleska, A.; Sobczak, J. W.; Grabowska, E.; Hupka, J.; Appl. Catal., B 2008, 78, 92.
35. Quiñones, D. H.; Rey, A.; Álvarez, P. M.; Beltrán, F. J.; Puma, G. L.; Appl. Catal., B 2015, 178, 74.
36. Elghniji, K.; Ksibi, M.; Elaloui, E.; J. Ind. Eng. Chem. 2012, 18, 178.
37. Fujiwara, K.; Deligiannakis, Y.; Skoutelis, C. G.; Pratsinis, S. E.; Appl. Catal., B 2014, 154-155, 9.
38. Giannakas, A. E.; Seristatidou, E.; Deligiannakis, Y.; Konstantinou, I.; Appl. Catal., B 2013, 132-133, 460.
39. Jian-xiao, L. V.; Ying, C.; Guo-hong, X.; Ling-yun, Z.; Su-fen, W.; J. Water Reuse Desalin. 2011, 1, 45.
40. Mohabansi, N. P.; Patil, V. B.; Yenkie, N.; Rasayan J. Chem.
2011, 4, 814.
41. Abramoff, M. D.; Magalhaes, P. J.; Ram, S. J.; Biophotonics Int. 2004, 11, 36.
42. Rietveld, H. M.; J. Appl. Crystallogr. 1969, 2, 65.
43. Toby, B. H.; Von Dreele, R. B.; J. Appl. Crystallogr. 2013, 46,
544.
44. Shen, J.; Li, Y.; He, J.-H.; Dyes Pigm. 2016, 127, 187.
45. Malengreaux, C. M.; Douven, S.; Poelman, D.; Heinrichs, B.; Bartlett, J. R.; J. Sol-Gel Sci. Technol. 2014, 71, 557.
46. Zoschke, K.; Börnick, H.; Worch, E.; Water Res. 2014, 52, 131. 47. Braun, A. M.; Maurette, M. T.; Oliveiros, E.; Photochemical
Technology; John Wiley: Chichester, 1991.
49. Giannakas, A. E.; Antonopoulou, M.; Daikopoulos, C.; Deligiannakis, Y.; Konstantinou, I.; Appl. Catal., B 2016, 184,
44.
50. Chen, X.; Kuo, D.-H.; Lu, D.; Chem. Eng. J. 2016, 295, 192.
51. Lei, X. F.; Xue, X. X.; Yang, H.; Appl. Surf. Sci. 2014, 321, 396. 52. Simsek, E. B.; Appl. Catal., B 2017, 200, 309.
53. Silverstein, R. M.; Bassler, G. C.; Morrill, T. C.; Identificação Espectrofotométrica de Compostos Orgânicos; Editora Guanabara: Rio de Janeiro, Brazil, 1979.
54. Wagner, C. D.; Naumkin, A. V.; Kraut-Vass, A.; Allison, J. W.; Powell, C. J.; Rumble Jr., J. R.; NIST Standard Reference Database 20, version 3.4 (web version) (http:/srdata.nist.gov/ xps/), 2003.
55. Biesinger, M. C.; Lau, L. W. M.; Gerson, A.; Smart, R. St. C.; Appl. Surf. Sci. 2010, 257, 887.
56. Chen, X.; Lou, Y.; Samia, A.; Burda, C.; Gole, J. L.; Adv. Funct. Mater. 2005,15, 41.
57. Kuznetsov, M. V.; Zhuravlev, Ju. F.; Zhilyaev, V. A.; Gubanov, V. A.; J. Electron Spectrosc. Relat. Phenom. 1992, 58, l. 58. Arienzo, M. D.; Scotti, R.; Wahba, L.; Battocchio, C.;
Bemporad, E.; Nale, A.; Morazzoni, F.; Appl. Catal., B 2009, 93, 149.
59. Sing, K. S. W.; Pure Appl. Chem. 1985, 57, 603.
60. He, F.; Ma, F.; Li, T.; Li, G.; Chin. J. Catal. 2013, 34, 2263.
61. Stengl, V.; Housková, V.; Bakardjieva, S.; Murafa, N;ACS Appl. Mater. Interfaces 2010, 2, 575.
62. Tahir, K.; Ahmad, A.; Li, B.; Nazir, S.; Khan, A. U.; Nasir, T.; Khan, Z. U. H.; Naz, R.; Raza, M.; J. Photochem. Photobiol., B 2016, 162, 189.
63. Kumar, R.; Rashid, J.; Barakat, M. A.; Colloid Interface Sci. Commun. 2015, 5, 1.
64. Tryba, B.; Piszcz, M.; Morawski, A.W.; Open Mater. Sci. J.
2010, 4, 5.
65. Tran, H.; Scott, J.; Chiang, K.; Amal, R.; J. Photochem. Photobiol., A 2006, 183, 41.
66. Lin, Y.-C.; Bai, H.; Lin, C.-H.; Wu, J.-F.; Aerosol Air Qual. Res.
2013, 13, 1512.
67. Gumy, D.; Rincon, A. G.; Hajdu, R.; Pulgarin, C.; Sol. Energy
2006, 80, 1376.
68. Bhosale, R. R.; Pujari, S. R.; Muley, G. G.; Patil, S. H.; Patil, K. R.; Shaikh, M. F.; Gambhire, A. B.; Sol. Energy 2014, 103, 473.
69. Ola, O.; Maroto-Valer, M. M.; J. Photochem. Photobiol., C
2015, 24, 16.
70. Hurum, D. C.; Agrios, A. G.; Gray, K. A.; J. Phys. Chem. B
2003, 107, 4545.
Submitted: September 29, 2016