Article
Printed in Brazil - ©2017 Sociedade Brasileira de Química0103 - 5053 $6.00+0.00*e-mail: [email protected]
High Order Cyclic Voltammograms During Electrooxidation of Ethanol
Catalyzed by Gold
Kaline N. da Silva, Suelen T. Maruyama and Elton Sitta*
Departamento de Química, Universidade Federal de São Carlos, 13565-905 São Carlos-SP, Brazil
Under fixed limits, potential sweeps in some electrochemical systems depict current profile whose shape repeats in every n cycle (with n > 1), receiving the name of high order voltammograms (HOV). HOV have been observed during electrooxidation of organic molecules catalyzed mainly by Pt. The present study shows HOV behavior during ethanol electrooxidation reaction onto gold in alkaline media. Firstly, a strong dependence of HOV with minimum potential is remarkable in this system and has not been considered in previous numeric models. Moreover, due to high sensibility of HOV to surface conditions, it was possible to follow effects caused by cation interactions with adsorbed oxygenated species.
Keywords: high order voltammograms, ethanol electrooxidation, gold catalyst, cation effects
Introduction
In a conventional cyclic voltammetry experiment the applied potential is continuously changed at a fixed rate between two limits (Emin and Eup) while the current
is registered.1 The characteristic current-potential plot is
called cyclic voltammogram and the current value at a given potential and scan direction can depict three behaviors: it becomes unchanged along the cycles; increase or decrease monotonically along the cycles; repeat its profile every set of cycles, that can be periodic, i.e., observed in every n cycle (n > 1) or aperiodic, in which n admits more than one value along the experiment. These voltammograms, periodic or aperiodic, are called high order voltammograms (HOV) and in contrast to the other cases, they are much less explored in the electrochemical field.
Examples of HOV can be found for several small organic molecules electrooxidation reactions catalyzed by Pt in both alkaline and acid media.2-11 Varela and
Krischer12,13 also found HOV during electrooxidation of
hydrogen in acid media. In any case, two conditions are necessary to observe HOV: the reaction should contain an inhibition region at high overpotential, in general connected with oxide formation, giving origin to a peak current; an expressive ohmic drop, given by the product of current (I) and resistance (R), provided by low concentration supporting electrolyte or an external resistance.
Ohmic drop allows the separation of applied potential (E) and the potential at interphase (ϕ) once E = ϕ + IR.14 When E
up is set slightly more negative than
the potential of peak current, the first cycles have almost the same current during positive and negative going scans, (small hysteresis) being classified as S cycles, but along the cycles, the current decreases and ϕ becomes higher and higher until reaching the region of current inhibition. At this point, ϕ quickly increases and oxides cover the surface. This condition makes the current in the negative going scan very distinct from that in the positive, i.e., with a large hysteresis and the cycle being classified as L. If the cycle after the L is the S, the initial condition is restored and the HOV is observed.15
Indeed, to observe HOV the system should contain some parameter weakly connected with the applied potential allowing periodic changes in multiple potential cycles. Strong adsorbed intermediates, surface passivation by (hydro)oxide and changes in surface roughness are possible candidates to act, inhibiting active sites and decreasing the current.13,15,16 The presence of HOV during
H2 electrooxidation and constant mass changes measured
by electrochemical quartz crystal microbalance during methanol oxidation on Pt15 suggest no accumulation of
intermediates along the cycles. Despite several advances in understanding HOV, most studies focus on Pt as catalyst and, to our knowledge, there is only one paper reporting the effect in Pd.11 Thus, to deepen the understanding of
An electrochemical interface in which oxide formation/ reduction is easily controlled by the potential and to a certain extent, inhibits the main reaction, is desired to explore HOV. All these characteristics can be found in gold-electrolyte interfaces.17,18 When applied to electrocatalysis,
gold also tends to be a selective catalyst due to its weak adsorption properties.19
Taking the ethanol electrooxidation reaction (EER) into account, gold is a poor catalyst in pH lower than 8,20
depicting slight activity in potentials higher than 1.00 V only in non-adsorbing anion solution (e.g., HClO4). In the
presence of phosphate ions the ethanol oxidation currents are difficult to discern from those obtained in absence of ethanol. However, in alkaline media, the reaction is notably at potentials higher than 0.60 V and, at this potential, the current increases with ethanol concentration up to 2.0 mol L-1.21
Tremiliosi-Filho et al.22 explored the EER by means
of high performance liquid chromatography (HPLC) and
in situ Fourier transform infrared spectroscopy (FTIR), concluding that acetate is the main product at 1.10 V and in alkaline media. Lima and Varela21 followed the
acetic acid production at 0.60 V by integration of the characteristic band collected in in situ FTIR. The authors found a linear dependence of acetate production with time at fixed potential, indicating no surface poisoning effects. Considering only the acetate pathway, the overall reaction consumes five hydroxyl groups giving four electrons per
ethanol molecule:
CH3CH2OH + 5 OH−→ CH3COO− + 4 H2O + 4 e– (1)
Acetate is also the main product obtained in EER in gold single crystals23 regardless of the surface orientation.
Differences in reactivity in Au(khl) along the potential sweep can be explained in terms of the potential of OH adsorption and the strength of OH-metal interaction characteristic of each surface orientation.
It is expected that ethanol mainly reacts on the surface via an ethoxy intermediate,19,22 followed by the reaction
with OH−. Theoretical calculations suggest that ethoxy is formed by the interaction between adsorbed OH (Au-OHad)
and ethanol near surface. Once formed, ethoxy can interact with OH− by both Eley-Rideal and Langmuir Hinshelwood mechanisms, i.e., involving adsorbed or in solution OH− ions.23
Independent of the form in which ethanol interacts with the hydroxyl, the active intermediate during EER seems to interact with few surface sites and causes a small poisoning effect. This reactive simple mechanism makes the system interesting to deepen knowledge about HOV. Herein, we
study the high order cyclic voltammograms during EER catalyzed by gold and their dependence on potentials limits as well alkali cation present on the electrolyte.
Experimental
The experiments were conducted in a three-electrode glass cell at room temperature (23 ºC). The working electrode was a melted gold wire (0.5 mm) creating a bead of 2.1 mm in diameter with electroactive area of 0.16 cm2. The
area was estimated considering that the reduction charge of gold oxides produces 0.386 mC cm-2 when E
up = 1.60 V.18
The counter and reference electrodes were a 1 × 1 cm gold flag and a reversible hydrogen electrode (RHE), respectively. Alkali solutions were made by dissolution of highly pure KOH, NaOH or LiOH.H2O (Sigma-Aldrich
99.99%) in 18.2 MΩ cm H2O (purified by Milli-Q system).
Ethanol was also provided by Sigma-Aldrich (99%) and directly inserted into the electrochemical cell in sufficient amount to yield 2.0 mol L-1. All the experiments were
conducted in a Metrohm-Autolab Potentiostat/Galvanostati PGSTAT-128N equipped with Scan250 modulus. The ohmic drop was modified by the insertion of a resistance decade (Minipa MDR610) between the working electrode and the potenciostat. Electrolyte resistance was measured by AC techniques and the sum of external + solution resistance was fixed at 910 Ω. The cyclic voltammetry profile at 0.10 V s-1 in the potential windows of 0.40 to
1.50 V in absence of ethanol and external resistance served as a blank curve. Before resistance insertion, 10 cycles in the conditions described above and in the presence of ethanol were employed as pretreatment.
Results and Discussion
General aspects
Figure 1 shows a typical cyclic voltammogram (CV) profile of gold in alkaline media (NaOH) at 0.10 V s-1 in the
absence (dotted black line, ×10) and presence of 2.0 mol L-1
positive going scan, probably due to the weak poisoning effect on the surface at low potential.
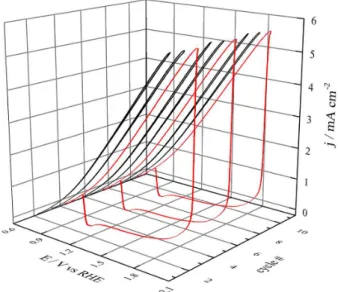
Unless the experimental conditions of Figure 1 are changed, the cyclic voltammograms (CV) are stable for various cycles. The insertion of ohmic resistances in series with the working electrode causes the potential shift due to the IR term. Taking advantage of this phenomenon, it is possible to increase the applied potential (E), maintaining the potential near the interface (ϕ) at a lower value. Figure 2 shows CV in the same experimental conditions as in Figure 1 but in the presence of 910 Ω with Emin and Eup set at 0.80
and 2.05 V, respectively. Eup is located slightly lower than
the peak potential observed in some cycles. In this scenario, the system depicts high order behavior, in which each two cycles with negative going scan showing high current values (S-type), e.g., in cycles 1, 2, 4, 5, 7 and 8 we have one cycle in which the current drops at high potential (L-type) as in cycles 3, 6 and 9. This pattern is repeated along the time.
When the current drops, at high potential, the interphase potential becomes close to the applied potential, and a thicker oxide layer is formed. This process is followed by the increase of surface roughness due to place exchange effects24 and, as a consequence, the formation of a
reactivation peak around 1.00 V is observed. After oxide reduction the process is reset and a new cycle with high current is observed. The two-S one-L HOV dynamic is commonly called an S2L pattern.
It is possible to calculate the potential at the interphase discounting the ohmic drop of the applied potential. At 2.05 V, during the S cycles (high current) ϕ is around 1.30 V in S cycles. When the current drops, the ohmic drop decreases and ϕ reaches 1.80 V. This potential is high enough to induce structural changes on the surface of the
gold, increasing the roughness factor but, the time in which the potential is kept at high values is not sufficient to induce the formation of others types of gold oxide.18 Current, E and
ϕ values along the cycles can be found in Supplementary Information section.
The stability of voltammograms, as well the patterns depicted in terms of Eup, has already been explored for Pt
and Pd electrodes in both alkaline and acid solution, for several alcohols.2,4-6,10,11 In general, when increasing E
up, the
number of S cycles decreases until reaching the condition in which all the cycles become L. Decreasing Eup, the
number of S cycles increase, reaching the condition of monotonically decrease of current. In the case of gold, HOV behavior is restricted to a very low potential region, it means, by changing Eup by a few mV, the system is driven
to the extreme all-L or all-S cycle behavior.
The effect of Emin on high order voltammograms has
been less explored in the literature than Eup. Cai and Schell4
observed a transition from L to S cycles when Emin is set
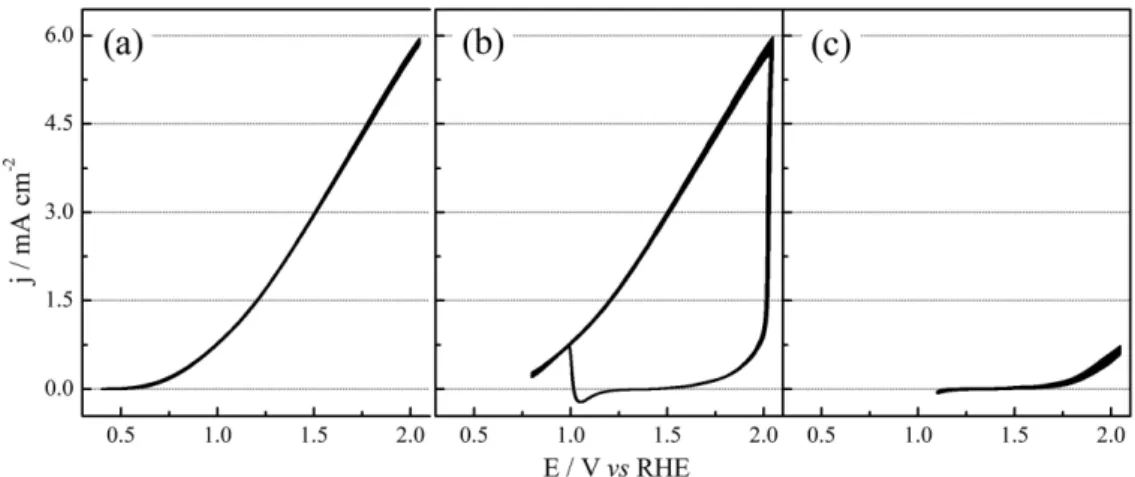
more positive than the reactivation peak, but in this case, the small hysteresis condition is reached covering the surface with oxides. To avoid mistakes we classified this type of cycle as I (Inhibited). Figure 3 shows three kinds of current response depending on Emin applied to EER on gold. The
plane (b) corresponds to the same curves of Figure 2, with the current being dependent on the cycle number. Fixing Eup and increasing Emin to 1.10 V, high order behavior
disappears and after a transition period, the system reaches a condition of low currents along the cycles (I cycles), as already observed for Pt electrodes. Decreasing Emin to
0.40 V (plane (a)) there is only cycles with small hysteresis and high current (S type) above 35 cycles.
Figure 1. Cyclic voltammograms for gold electrode in 0.1 mol L-1 of
NaOH at 0.10 V s-1 in the absence (dotted black line) or presence of
2.0 mol L-1 of ethanol (solid red line). Arrows indicate scan direction.
To compute the transient behavior or to emphasize the HOV stability we classified the cycles into three groups and plotted the evolution of the system along 35 voltammetry cycles. In Figure 4, the cycles as observed in Figures 3a and 3c, are represented as black squares and green triangles, respectively. The cycles in which the current is high on positive going scan but drop at high potential, becoming inhibited on negative going scan (some scans on Figure 3b) are classified as red circles. Using this nomenclature, Emin
was changed from 0.40 to 1.20 V and HOV dynamics are shown in Figure 4. Current and ϕ along the cycles for representative conditions can be found in Supplementary Information section.
If Emin = 0.40 V no changes are observed along the
cycles, as described above. The region between 0.50 and 1.00 V depict high order behavior, being the phenomena observed at 0.50 and 0.60 V only after 20 cycles of induction. Increasing Emin to 0.80 or 1.00 V the induction
is reduced to less than 10 cycles, and the HOV pattern is
S2L with some S3L along the series. At potentials higher
than 1.10 V, after a short number of induction cycles, once the current drops the series are stable and unchanged along the time.
The presence of HOV during EER into gold suggests that the phenomenon is connected with surface relaxation effects, once the reaction is very selective to acetate being the intermediates weakly adsorbed. The model proposed by Varela and Krischer13 to explain HOV on Pt is based on
surface roughening and relaxation processes. Herein, distinct rates of roughening and smoothing in platinum and gold can explain the strong dependency of HOV on Eup on gold
and the absence of patterns SnL with n > 3. Alonso et al.25
estimated the diffusion coefficient of Au and Pt atoms electrochemically roughened by oxide formation in acid media. They observed that under comparable experimental conditions, the rate of change of roughness factor with time for Au is considerably higher than for the Pt. Considering the same tendency in alkaline media, once roughened at high potential, the Au surface roughness is restored to its initial value after one or two excursions at low potential.
For HOV observed on Pt, catalyzing organic molecules oxidation in alkaline media, the interphase potential does not need to exceed 1.20 V (during the current drop in L-type cycle) and it is possible to observed a large number of S-type cycles until the current drops again.15 In the case of Au, we
observed that the interphase potential should be considerably higher than those employed for Pt to obtain that high order effect, i.e., reaching 1.80 V and the number of S-type cycles in around 2 or 3 as shown in Figure 4. The difference is probably connected to the gold diffusion on the surface, decreasing its roughness factor faster than on Pt surfaces.
On the other hand, the inhibition of HOV behavior decreasing Emin is not computed in the Varela-Krischer
model, nor observed on Pt electrodes. The turning
Figure 3. Influence of minimum potential (Emin) on cyclic voltammograms for EER in the presence of 910 Ω. Eup, sweep rate and external resistance were
kept constant (a) Emin = 0.40 V and only high current S-cycles were observed; (b) Emin = 0.80 V depicting both S and L cycles; (c) Emin = 1.10 V with all
cycles in low current.
Figure 4. Evolution of cycle voltammograms for distinct Emin values. The
point, around 0.40 and 0.60 V, corresponds to the region of OH– adsorption/desorption on Au as observed in
CV in the absence of ethanol. Reconstruction effects, commonly found in well-ordered gold surfaces,26 could
be responsible for the changes in surface roughness at low potential, however the effect is difficult to be quantified in polycrystalline structures. We expected a strong influence of species present in the solution affecting the HOV, including non-covalent interaction between adsorbed negatively charged species and cations. In the next section we explore the influence of cations present on supporting electrolyte on HOV dynamics.
Cation effect on high order cyclic voltammograms
Catalytic effects caused by the interactions between cations and O(H)x adsorbed species were recently
reported in literature27-32 for several fuel cell reactions. In
general, small cations, like Li+ and Na+, strongly interact
with adsorbed O(H)x,ad, causing the stabilization of these
species. The effect decreases as the cation radius increases because the charge density depends on the cation size. Interesting, on gold surfaces, the adsorption of hydroxyl ion, as well the initial oxide layer, are weakly influenced by cations producing no apparent changes in the catalysis of oxygen reduction33 or alcohol oxidation reactions.30,32,34
We performed experiments replacing Na+ ions by Li+ or K+
and analyzed the response during EER.
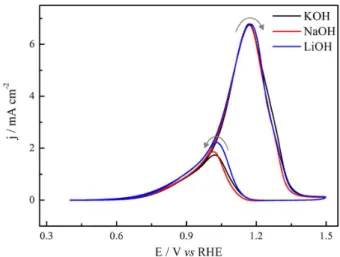
Figure 5 shows the effect of an alkali cation on CV for ethanol electrooxidation. At low potentials and positive going scan, the effect is hardly recognizable, the current being slightly high in the presence of Li+. After the peak
potential, small changes in current can be observed, but the most discernible effect occurs during negative going scan, in which both current and peak potential are cation dependent in the reactivation region. The peak current increases in the order: jK+≈ jNa+ < jLi+. After reactivation
completion the curves converge to the values observed in the positive going scan. This behavior is stable along the cycles indicating the cation apparently acts only in the region of high potentials on gold.
The weak dependence of j-E profile with alkali cations was reported previously23,32,34 for ethanol electrooxidation
in gold single crystals and for ethylene glycol or glycerol electrooxidation on poly-oriented surfaces.30
Nakamura et al.34 observed, by infrared spectroscopy,
the same OH adsorption rate at potentials below 1.30 V on Au(111) surface regardless the cation, however X-ray diffraction reveled a protective effect against surface roughening at high potentials, this protection being more effective in the presence of Li+ than Cs+.
Taking this effect into account, HOV dynamics should be changed by cations because roughening and relaxation will be modified. Thus we performed cyclic voltammogram experiments in the presence of KOH and LiOH, keeping the total resistance (solution + external) and Emax
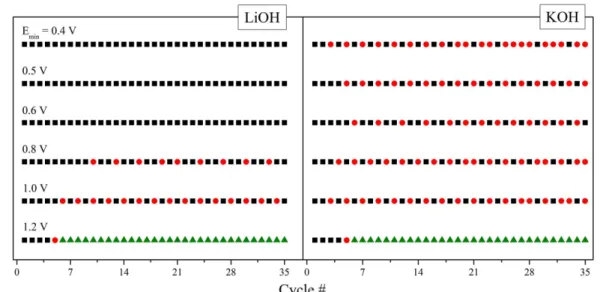
constant. Figure 6 shows the evolution of voltammogram profiles along cycles for distinct conditions of Emin. The
nomenclature employed was the same as in Figure 4. In both Li+ and K+ containing electrolytes we observed a high order
behavior in some Emin values. While in the LiOH electrolyte,
HOV were not observed at potentials below 0.8 V, in KOH, behavior is extended to 0.40 V more negative, this low limit being even lower than that displayed in the NaOH electrolyte (Figure 4). Any case, the potential of oxide reduction restricts the upper HOV limit to around 1.10 V.
Clearly, the changes in the ethanol HOV dynamics show that gold surfaces are affected by alkali cations. On Pt, the interactions occur from the first stages of O(H)x
adsorption, reflecting in the onset potential, peak current and product distribution28,30,31,35 of the reactions catalyzed
by this surface. On the other hand, the presence of cations on Au does not change the onset nor the peak current, but increasing the cation charge density, the Au surface becomes less susceptible to roughening/relaxation effects as observed in all-S cycles.
In alkaline media interactions between OH and Au occur in a wide potential window, i.e., the onset of OHadsorption is below to 0.6 V being extended until oxide formation. On the negative going scan, once Au oxides are reduced, the surface is again covered by OH ions. Although the high potential on the surface, the negative charge of adsorbed species allows that cations interact with the surface. Notably, for Au these interactions are very weak and do not discernible during alcohol electrooxidation under ordinary voltammetry
regime, as cited above. However, under conditions necessary to trigger HOV, small changes on metal/solution interface can completely change the system dynamics. When Emin is
sufficient low to decrease the rate of ethanol electrooxidation, cations should stabilize OHad, minimizing the decreasing of
surface roughness. Thus, as bigger the cation interaction is, smaller will be the relaxation.
When the potential inversion on cyclic voltammetry occurs just after the oxide reduction, the small amounts of free gold sites and the Au-OHad interactions with
ethanol/ethoxy at the end of reactivation process allow the appearance of HOV, regardless the cation present on the electrolyte.
Conclusions
High order voltammograms were observed during ethanol electrooxidation reaction catalyzed by gold. The region in which the phenomenon was observed is very restricted in terms of maximum and minimum potential limits when compared to similar processes catalyzed by Pt or Pd. Although the models employed to describe the process focus on the Emax, the present results showed an
important contribution of Emin on the HOV, extinguishing
the process at sufficiently low potentials. Finally, we also observed interactions between electrolyte cations and Au surface by means of changes in HOV dynamics. These interactions seem to inhibit surface relaxation effects.
Supplementary Information
Supplementary information concerning applied potential (E), current (i) and potential without ohmic drop
(ϕ) along the cycles is free of charge at http://jbcs.sbq.org.br as a PDF file.
Acknowledgments
The authors thank São Paulo State Foundation (FAPESP, No. 2014/23916-3) and CNPq for financial support. K. N. thanks CAPES and S. M. thanks CNPq/PIBIC for scholarships. We also would like to express our gratitude to Prof E. C. Pereira and Prof L. H. Mascaro for laboratory facilities.
References
1. Bard, A. J.; Faulkner, L. R.; Electrochemical Methods, 1st ed.; John Wiley & Sons: New York, USA, 1980.
2. Schell, M.; Cai, X. R.; J. Chem. Soc., Faraday Trans.1991, 87, 2255.
3. Parida, G. R.; Schell, M.; J. Phys. Chem.1991, 95, 2356. 4. Cai, X. R.; Schell, M.; Electrochim. Acta1992, 37, 673. 5. Schell, M.; Cai, X. R.; Electrochim. Acta1993, 38, 519. 6. Schell, M.; Xu, Y. H.; Amini, A.; J. Phys. Chem.1994, 98,
12768.
7. Xu, Y. H.; Amini, A.; Schell, M.; J. Phys. Chem.1994, 98, 12759.
8. Amini, A.; Xu, Y.; Schell, M.; J. Chem. Phys.1995, 102, 3220. 9. Xu, Y.; Zdraveski, Z.; Schell, M.; J. Phys. Chem. Lett.1995,
247, 589.
10. Xu, Y. H.; Amini, A.; Schell, M.; J. Electroanal. Chem.1995,
398, 95.
11. Zdraveski, Z.; Xu, Y. H.; Amini, A.; Schell, M.; J. Chem. Soc.,
Faraday Trans.1996, 92, 395.
12. Varela, H.; Krischer, K.; Catal. Today 2001, 70, 411.
Figure 6. Evolution of cyclic voltammograms profiles along cycles for distinct Emin and electrolyte cations. Colors and symbols have the same meaning
13. Varela, H.; Krischer, K.; J. Phys. Chem. B2002, 106, 12258. 14. Krischer, K.; Varela, H. In Handbook of Fuel
Cells-Fundamentals, Technology and Applications, vol. 2, 1st ed.; Vielstich, W.; Gasteiger, H. A.; Lamm, A., eds.; Wiley: Chichester, UK, 2003.
15. Sitta, E.; Nagao, R.; Santos, A. L.; Varela, H.; Electrochim. Acta
2009, 55, 404.
16. Schell, M.; Xu, Y.; Zdraveski, Z.; J. Phys. Chem. C1996, 100, 18962.
17. Conway, B. E.; Prog. Surf. Sci. 1995, 49, 331.
18. Tremiliosi-Filho, G.; Dall’Antonia, L. H.; Jerkiewicz, G.;
J. Electroanal. Chem.1997, 422, 149.
19. Rodrigues, P.; Koper, M. T. M.; Phys. Chem. Chem. Phys.2014,
16, 13583.
20. Lai, S. C. S.; Kleijn, S. E. F.; Öztürk, F. T. Z.; van Rees Vellinga, V. C.; Koper, M. T. M.; Catal. Today2010,154, 92.
21. Lima, R. B.; Varela, H.; Gold Bull.2008, 41, 15.
22. Tremiliosi-Filho, G.; Gonzalez, E. R.; Motheo, A. J.; Belgsir, E. M.; Leger, J. M.; Lamy, C.; J. Electroanal. Chem.1998, 444, 31.
23. Beyhan, S.; Uosaki, K.; Feliu, J. M.; Herrero, E.; J. Electroanal.
Chem. 2013, 707, 89.
24. Angerstein-Kozlowska, H.; Conway, B. E.; Barnett, B.; Mozota, J.; J. Electroanal. Chem.1979, 100, 417.
25. Alonso, C.; Salvarezza, R. C.; Vara, J. M.; Arvia, A. J.; Vazquez, L.; Bartolome, A.; Baro, A. M.; J. Electrochem. Soc.1990, 137, 2161.
26. Kolb, D. M.; Prog. Surf. Sci.1996, 51,109.
27. Strmcnik, D.; Kodama, K.; van der Vliet, D.; Greeley, J.; Stamenkovic, V.; Markovic, N.; Nat. Chem.2009, 1, 466. 28. Sitta, E.; Batista, B. C.; Varela, H.; Chem. Commun.2011, 47,
3775.
29. Danilovic, N.; Subbaraman, R.; Strmcnik, D.; Paulikas, A. P.; Myers, D.; Stamenkovic, V.; Markovic, N.; Electrocatalysis
2012, 3, 221.
30. Previdello, B. A. F.; Machado, E. G.; Varela, H.; RSC Adv.2014,
4, 15271.
31. Angelucci, C. A.; Varela, H.; Tremiliosi-Filho, G.; Gomes, J. F.;
Electrochem. Commun.2013, 33, 10.
32. Lopes, P. P.; Strmcnik, D.; Jirkovsky, J. S.; Connell, J. G.; Stamenkovic, V.; Markovic, N.; Catal. Today2016, 262, 41. 33. Strmcnik, D.; van der Vliet, D.; Chang, K. C.; Komanicky, V.;
Kodama, K.; You, H.; Stamenkovic, V. R.; Markovic, N. M.;
J. Phys. Chem. Lett.2011, 2, 2733.
34. Nakamura, M.; Nakajima, Y.; Kato, K.; Sakata, O.; Hoshi, N.;
J. Phys. Chem. C2015, 119, 23586.
35. Stoffelsma, C.; Rodriguez, P.; Garcia, G.; Garcia-Araez, N.; Strmcnik, D.; Markovic, N. M.; Koper, M. T. M.; J. Am. Chem.
Soc.2010, 132, 16127.
Submitted: September 9, 2016