Brazilian Journal of Physics, vol. 33, no. 4, December, 2003 705
Mixed-State Transport Characteristics of
Magnesium Diboride Films
M. N. Kunchur, Cheng Wu, D. H. Arcos, G. Saracila,
Department of Physics and Astronomy, University of South Carolina, Columbia, SC 29208, U.S.A.
Eun-Mi Choi, Kijoon H.P. Kim, W. N. Kang, and Sung-Ik Lee
National Creative Research Initiative Center for Superconductivity and Department of PhysicsPohang University of Science and Technology, Pohang 790-784, Republic of Korea
Received on 23 May, 2003.
We have investigated the low-temperature (T < Tc/10) mixed-state current-voltage (IV) response of
magne-sium diboride films beyond the point where the superconductivity is completely destroyed and the system enters the normal state. The resistance-versus-currentR(I)curves are extremely steep and featureless, with a critical current densityjc, marking the onset of dissipation, that is unusually high (jc>jd/10) with respect to the
de-pairing current densityjd. At large flux densitiesHc2/10.B .Hc2, theR(I)curve has a functional shape
that is largely independent ofB, indicating that the rise in resistivity with increasing current occurs mainly due to pair-breaking rather than flux motion. The macroscopic destruction currentI∗, which drives the system normal, has a[1−
p
B/Hc2]flux-density dependence, suggesting that the vortices mainly reduce the effective
cross section over which a current of effective densityj∼jdflows.
1
Introduction and background
When a superconducting state is formed, charge carriers correlate and condense into a coherent macroscopic quan-tum state. The formation of this state is governed princi-pally by a competition between four energies: condensa-tion, magnetic-field expulsion, thermal, and kinetic. The or-der parameter∆, that describes the extent of condensation and the strength of the superconducting state, is reduced as the temperature T, magnetic field H, and electric current densityj are increased. The boundary in theT-H-j phase space that separates the superconducting and normal states is where∆ vanishes, and the three parameters attain their critical valuesTc(H, j),Hc2(T, j), andjd(T, H). jdis the depairing or pair-breaking current density, which sets the
intrinsic upper limiting scale for current transport in any su-perconductor.
In a transport measurement in finite flux densityB, re-sistance appears above a thresholdjcat which flux vortices start to move. In a system with weak flux pinning, jc is much lower than jd and the response goes through alter-nate regimes of Ohmic (homogeneously linear dependence ofV onI) and non-Ohmic behavior [1]. At very low driving forces (lowj) there can be observable resistance due to ther-mally activated flux flow (TAFF) or flux creep. Then one encounters a non-linear response as current driven depin-ning sets in; in effect the number of mobile vortices is rising withj. This is incipient flux flow. At sufficiently largerj,
the vortex motion is effectively free from the influence of pinning and the response becomes Ohmic again. We previ-ously introduced the term free flux flow (FFF) for this linear regime [2]. Here the dissipation and resistivity should cor-respond to the canonicalρf ∼ρnB/Hc2Bardeen-Stephen
expression (sometimes large departures can occur for ex-ceptional situations such as superclean systems and nar-row vortex cores where the internal energy-level spacing ex-ceeds their widths). Beyond FFF, the response can become non-linear because of the heating of the electron gas [3] or changes in the electron distribution function [4]. Finally at yet higher currents, pair-breaking destroys superconductiv-ity and drives the system normal and the resistance again becomes independent of current, being characteristic of the normal state. Our previous review article discusses some of these stages of dissipation. In Y1Ba2Cu3O7, the depinning
critical current is sufficiently weak compared to the pair-breaking value that all of these regimes have be observed.
In MgB2the scenario has turned out to be completey
dif-ferent from the cuprates. The pinning in MgB2films is much
stronger (because of its higher isotropy and ten times larger vortex cross section) and itsTcis intermediate in value (less than half that of Y1Ba2Cu3O7 or Bi2Sr2CaCu2O8). This
boostsjc while inhibiting thermally activated flux motion. On the other handjdhas a much lower value than cuprates (jd(0)∼107
A/cm2
706 M.N. Kunchuret al.
resistance more because of pair-breaking than flux motion. Another distinction between MgB2 and cuprates is its
much lower normal-state resistivityρn(lower than cuprates by 1–2 orders of magnitude). This leads to a much stiffer viscous coefficient η (≈ Φ0Hc2/ρn) and consequently
much lower vortex velocities for comparable values of ap-pliedj. Hence non-equilibrium effects related to changes in the macroscopic electronic distribution function [3, 4] are suppressed. All of these factors combine to produce an ex-tremely steep non-linear IV curve influenced only secondar-ily by the motion of flux vortices, even whenBapproaches Hc2.
2
Experimental details
The samples are 400 nm thick films of MgB2
fabri-cated using a two-step method whose details are described elsewhere[6, 7]. An amorphous boron film was deposited on a (1¯102) Al2O3substrate at room temperature by
pulsed-laser ablation. The boron film was then put into a Nb tube with high-purity Mg metal (99.9%) and the Nb tube was then sealed using an arc furnace in an argon atmosphere. Finally, the heat treatment was carried out at 900◦ C for
30 min. in an evacuated quartz ampoule sealed under high vacuum. X-ray diffraction indicates a highly c-axis-oriented crystal structure normal to the substrate surface with no im-purity phases. The films were photolithographically pat-terned down to narrow bridges. In this paper we show data on three bridges, labelled S, M, and L (for small, medium, and large) with lateral dimensions 2.8 x 33, 3.0 x 61, and 9.7 x 172µm2
respectively. The lateral dimensions are un-certain by±0.7µm and the thickness by±50nm. Fig. 1(a) shows the sample geometry. The horizontal sections of the current leads contribute a small (∼15%) series resistance to the resistance of the actual bridge whenB&Hc2(T)and
the entire material is normal. At lowBin the mixed state, this extra contribution is frozen out because the current is spread out in these wider lead areas and hence its density is too low to cause dissipation. Thenjis high only within the bridge itself and the leads do not contribute to the measured resistance.
The non-linear electrical transport measurements were made using a pulsed signal source with pulse durations rang-ing from 0.1 to 4µs and a duty cycle of about 1 ppm. A con-ventional continuous DC method was employed for the very low currents (I= 1.4µA). Fig. 1(b) shows pulse waveforms under the especially severe conditions ofj = 9.7MA/cm2, E= 83V/cm, andp=jE= 803MW/cm3. The resistance rises to 90% of its final value in about 50 ns from the 10% onset ofI. From a knowledge of the thermal conductivities and specific heat capacities of the film and substrate mate-rials, and their mutual thermal boundary resistance, one can calculate the total thermal resistanceRthfor any pulse du-ration [1, 8]. Also ifR(T)has enough variation, the film’s
Figure 1. (a) Sample geometry used for resistance measurement. At low values ofjthe wide lead areas add a constant resistance of about 15% of the total value. At highjthis contribution is frozen out. (b) Pulse waveforms under worst-case conditions (j = 9.7
MA/cm2
, E = 83V/cm, andp = jE = 803MW/cm3
on the plateaus). The resistance rises to (90% of) its final value in about 50 ns from the (10%) onset ofI.
own resistance can be used as a thermometer to measure Rth. For films of Y1Ba2Cu3O7(YBCO) on LaAlO3, which
were used for most of our previous work, we foundRth ∼ 1–10 nK.cm3
/W at microsecond timescales [3, 1, 9]. In the case of our MgB2 films, we expectRthto be smaller
be-cause of sapphire’s very high conductivity. However the five parameters required to calculateRthfrom first principles are not all known for this film-substrate combination and MgB2
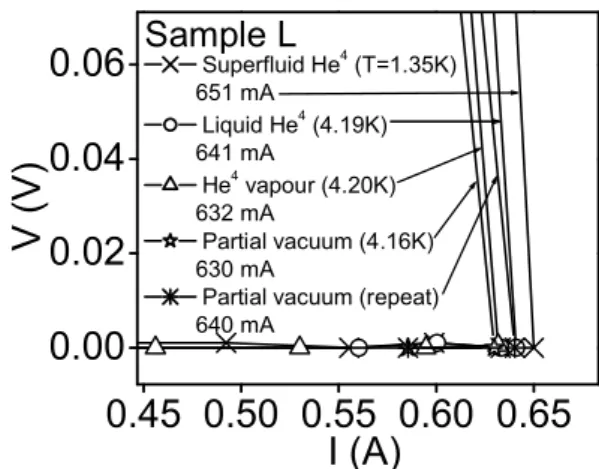
has a very flatR(T)below 50 K, so one can’t measureRth as was done for YBCO. We can, however, obtain an upper bound onRthin the following way: Fig. 2 showsIV curves for sample L in zero field (This is the largest sample with the lowest surface-to-volume ratio, so that it represents the worst case thermal scenario.). The curves were measured with the sample in different thermal environments. Above some threshold currentId ∼650 mA, the system abruptly switches into the normal state. The value ofIdis not sensi-tive to the thermal environment contacting the exposed sur-face of the film, confirming that the highly conductive sap-phire, together with the greatly reduced heat input during the short pulse, prevents the film’s temperature from rising significantly (It has been shown by Stoll et al. [10] that if there is sample heating, the thermal environment makes a significant difference because it will provide an additional path for the heat to flow through.). We show elsewhere [5] that this jump to the normal state occurs due to pairbreaking by the current1. At the point the system is driven normal, the power density reachesp= jE = 1.01GW/cm3. This sets a gross upperbound ofRth ∼7 nK.cm3/W. Note that the main bottle neck of heat conduction is the film-substrate boundary resistance which is not strongly temperature de-pendent [8]. In the present work, typicalpvalues are two orders of magnitude lower than the critical 1 GW/cm3
and so we expect the temperature rise to be a small fraction (∼1 %) ofTc. A value ofjd(0) ≈2×10⁷
A/cms was obtained 1
The value of the current density at which this jump occurs,∼2×10⁷
A/cm2
, is roughly comparable to the theoretical estimate ofjd(0) =
Brazilian Journal of Physics, vol. 33, no. 4, December, 2003 707
from such zero-field IV curves [5]. The corresponding val-ues for the zero-field pair-breaking currents are 240 mA, 257 mA, and 700 mA for samples S, M, and L respectively [5].
The magnetic field is applied normal to the film (parallel to the c axis) and the self field of the current is much lower than the applied fields used in this work. Further details of the measurement techniques have been published in a previ-ous review article [1] and other recent papers [9, 3].
Figure 2. IV curves in zero field for sample L in different ther-mal environments. The resistance is driven to its norther-mal-state value (top parts of curves lie outside the panel) by currents of pair-breaking magnitudes. The absence of a significant systematic de-pendence on the thermal environment shows the paucity of sample heating.
3
Results and analysis
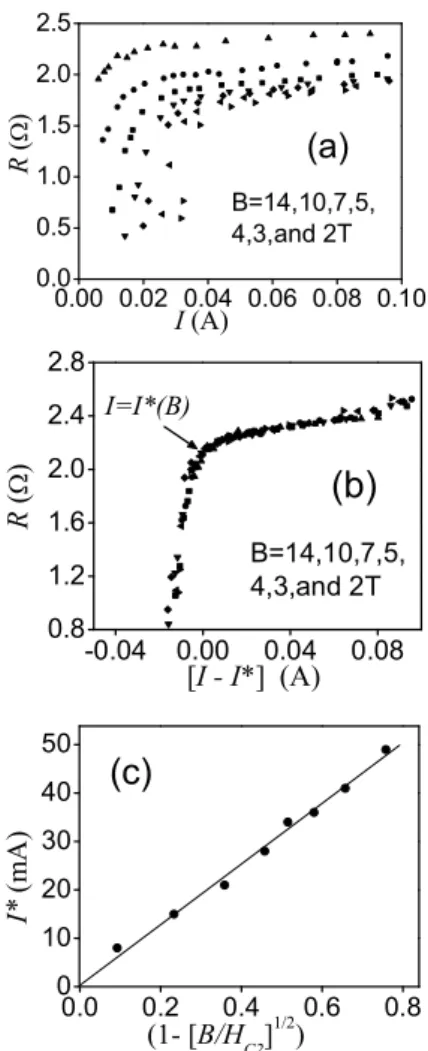
Fig. 3(a) shows the R(I) curves for sample M at different val-ues ofBin theHc2/10.B .Hc2range. After the onset
of dissipation, the resistance quickly rises to the full normal-state value. It should be noted that the plateaus do not corre-spond to FFF but to the normal state. Accordingly the resis-tance value changes very little with the appliedB(the slight shift in plateau resistance at the highest flux densities can be understood in terms of spreading of resistance outside the bridge area into the current-lead areas as explained in the experimental section; fields approaching Hc2 start driving
the whole film normal so that the resistance of the wider current-lead areas is not frozen out). It is interesting to note that the overall shapes of the curves are almost independent of B. The curves of panel (a) can be made to overlap, as shown in Fig. 3(b), by merely shifting them vertically and horizontally by constant amounts. For a dissipation curve in-fluenced by flux motion, one expects the function to depend onB. The vertical shift is not crucial as explained above. The horizontal shift corresponds to substracting an amount I∗fromI. I∗, which we call the destruction current, is the
elbow point (arrow in Fig. 3(b)) below whichRstarts to fall below its normal-state value. In panel (c), thisI∗is plotted
versus the function[1−pB/Hc2], the meaning of which
is explained below. It is seen that most of the data obey a roughly linear dependence that extrapolates back to the ori-gin, consistent with the pinch-off model. Also we note that
at the current scale of this phenomenonI∗∼50 mA is of the
order of the pair-breaking current (257 mA) for this sample (ForB <2T, the sample resistance becomes lower than the source impedance of the pulsed voltage source. As a result the relevant portion of theR(I)curve is inaccessible. This external circuit issue is discussed elsewhere [5]).
Figure 3. (a) Resistance versus current curves for sample M. Flux densities are indicated from left to right. (b) The same data now plotted with simple vertical and horizontal shifts to produce a sin-gle collapsed curve. The horizontal shifts are by the amountI∗, the destruction current, defined at the elbow of the curve as indi-cated by the arrow. (c) Plot of the destruction current versus the pinch-off function(1−
p
B/Hc2).
708 M.N. Kunchuret al.
“pinch off” the cross section by adding more vortices. At highB ∼Hc2, there will be some additional corrections
as the field approaches its critical value, but for lower fields let’s assume that the localjdis unaffected byB, but only the macroscopic averagejdis reduced because of loss of cross-sectional area. In this case the destruction currentI∗ will
equaljdtimes the available cross section which is given by the factor[1−pB/Hc2].
Figure 4. Data plots for sample S. (a) Resistance versus current curves. Flux densities are indicated from left to right. (b) The col-lapsed data plotted after simple vertical and horizontal shifts. (c) The destruction current (defined at the elbow of theR(I)curve in above panel) plotted versus the pinch-off function[1−
p
B/Hc2].
Fig. 4 shows a similar set of curves for sample S (sample L also looks similar). In all cases, theR(I)curves at dif-ferent flux densities collapse when shifted. AndI∗, which
amounts to the horizontal shift along the current axis, is pro-portional to the pinch-off function consistent with our sim-ple model of vortices choking of the current-carrying cross
section (other effects like pair-breaking by the field and rise inRdue to vortex motion seem to be secondary).
4
Summary
We have investigated the low-temperature (T ≪Tc) in-field transport behavior of MgB2 and present the first
measure-ment of the full dissipation curves (i.e., 0 . j . jd and 0≤R(T = 0).Rn) for this system. MgB2films made by
the two-step laser-ablation process have intrinsically strong pinning, leading to ususually steep IV andR(I)curves. The onset of dissipation is within an order of magnitude of the pairbreaking current, even at flux densities of a few Teslas, and the resistance quickly rises to the full normal-state value as the current is increased beyondjc. The dissipation curve seems to be controlled mainly by the pair-breaking action of the current, the vortices merely serving to reduce the effec-tive cross section over which the transport current is able to flow. Such a “pinch-off” model provides a first-order expla-nation of the relative horizontal (current-axis) displacements of theR(I)curves at different flux densities.
Acknowledgements
The authors acknowledge useful discussions with J. M. Knight and B. I. Ivlev. This work was supported by the U. S. Department of Energy through grant number DE-FG02-99ER45763 and by the Ministry of Science and Technology of Korea through the Creative Research Initiative Program.
References
[1] M. N. Kunchur, Mod. Phys. Lett. B. 9, 399 (1995).
[2] M. N. Kunchur, D. K. Christen, and J. M. Phillips, Phys. Rev. Lett. 70, 998 (1993).
[3] M. N. Kunchur, Phys. Rev. Lett. 89, 137005 (2002).
[4] A. I. Larkin and Yu. N. Ovchinnikov, Zh. Eksp. Teor. Fiz. 68, 1915 (1975) [Sov. Phys. JETP 41, 960 (1976)].
[5] M. N. Kunchur et al., Phys. Rev. B, 68, 064516 (2003).
[6] W. N. Kang et al., Science 292, 1521 (2001).
[7] W. N. Kang et al., Physica C 385, 24 (2003).
[8] S. K. Gupta et. al., Physica C 206, 335 (1993) and references therein; and M. Nahum et. al., Appl. Phys. Lett. 59, 2034 (1991) and references therein.
[9] M. N. Kunchur, B. I. Ivlev, D. K. Christen, J. M. Phillips, Phys. Rev. Lett. 84, 5204 (2000).