Psychometric properties of the Brazilian version
of the Stroke Specifi c Quality of Life Scale:
application of the Rasch model
Propriedades psicométricas da versão brasileira da escala de qualidade de vida
específi ca para acidente vascular encefálico: aplicação do modelo Rasch
Lima RCM1,2, Teixeira-Salmela LF3, Magalhães LC4, Gomes-Neto M5
Abstract
Background: Stroke results in important defi cits, which reduce individuals’ quality of life (QOL). Specifi c QOL measurements are necessary to understand and quantify the impact of this pathological condition. Objective: The aim of this study was to make a transcultural adaptation of the Stroke Specifi c Quality of Life Scale (SSQOL) into Brazilian and to assess its psychometric properties. Methods: The SSQOL was translated and adapted in accordance with standardized procedures and was subjected to test-retest reliability analysis (with 10 hemiplegic subjects). The psychometric properties were investigated using Rasch analysis on 50 hemiplegics. Results:
Reliability coeffi cients of 0.92 were found for items and subjects. The separation index for the hemiplegics was 3.34, while, for the items, it was 3.36. These results indicated that the items separated the subjects into at least three levels of QOL: low, medium and high QOL. Of the 49 items, four did not fi t into the model, which partially invalidated the construct validity of the instrument, although the erratic patterns of these items could also be explained in the present sample. Conclusions: The instrument was shown to be clinically useful for the assessed population and other studies in populations with other characteristics are now underway.
Key words: stroke; quality of life; transcultural adaptation; Rasch analysis.
Resumo
Contextualização: O acidente vascular encefálico (AVE) produz défi cits importantes na qualidade de vida (QV) dos indivíduos. Medidas específi cas de QV são necessárias para compreender e quantifi car o impacto dessa patologia. Objetivo: O objetivo desse estudo foi adaptar transculturalmente o Stroke Specifi c Quality of Life Scale (SSQOL) para o Português (Brasil) e avaliar suas propriedades psicométricas. Materiais e métodos: O SSQOL foi traduzido e adaptado seguindo instruções padronizadas e submetido a exame de confi abilidade teste-reteste (com 10 hemiplégicos). As propriedades psicométricas foram investigadas pela análise Rasch em 50 hemiplégicos. Resultados: Foram detectados coefi cientes de confi abilidade de 0,92 para itens e indivíduos. O índice de separação dos hemiplégicos foi 3,34 e dos itens, 3,36, ou seja, os itens separaram as pessoas em pelo menos três níveis de QV e em três níveis de QV – baixa, média e alta. Dos 49 itens, quatro não se enquadram no modelo, o que compromete a validade de constructo do instrumento, embora o padrão errático dos itens se justifi que na amostra examinada. Conclusões: O instrumento mostrou-se clinicamente útil na população avaliada. Novos estudos em populações com outras características já estão em andamento.
Palavras-chave: acidente vascular encefálico; qualidade de vida; adaptação transcultural; análise Rasch.
Received: 29/06/2007 – Revised: 19/11/2007 – Accepted: 24/01/2008
1 Physical Therapy Undergraduate Program, Centro Universitário Newton Paiva 2 Centro Universitário Metodista Izabela Hendrix – Belo Horizonte (MG), Brazil
3 Department of Physical Therapy, Universidade Federal de Minas Gerais (UFMG) – Belo Horizonte (MG), Brazil 4 Department of Occupational Therapy, UFMG
5 Graduate Program in Rehabilitation Sciences, UFMG
Correspondence to: Prof. Luci Fuscaldi Teixeira-Salmela, Department of Physical Therapy – Universidade Federal de Minas Gerais: Avenida Antônio Carlos, 6627 – Campus Pampulha, CEP 31270-010, Belo Horizonte – MG, e-mail: [email protected] / [email protected] / [email protected]
149
Introduction
h e growing number of ill and chronically-impaired individu-als has generated major social repercussions. Within the scope of these conditions, stroke is the disease1-3 that causes the most
impairments and causes signii cant harm to the quality of life (QOL) of these individuals4-6. Most studies involving hemiplegics
in Brazil have used generic instruments to measure QOL, such as the Medical Outcomes Short-Form Health Survey – SF-365,7-10, and
the Nottingham Health Proi le4,11,12. h ey are less accurate when it
comes to mapping the ef ects of impairments caused by a specii c disease in peoples’ lives13-16. Studies have shown that these generic
instruments may underestimate the impact of stroke7,17 and in
Brazil, specii c instruments to evaluate QOL in hemiplegics did not exist whatsoever.
h e Stroke-Specifi c Quality of Life – SS-QOL14 was originally
developed to measure QOL of individuals who demonstrated the consequences of stroke. It contains 49 items distributed into 12 domains (energy, family role, language, mobility, hu-mor, personality, self-care, social role, reasoning, upper-limb functions, vision, and work/productivity) made up from interviews with hemiplegics, who identii ed the areas most severely af ected by stroke14. h ere are three response
pos-sibilities on a 1-to-5 scale: the amount of help needed to perform specii c tasks; the amount of diffi culty experienced when it is necessary to carry out a task; the degree of agree-ment with stateagree-ments about functionality. h eir reference point for the answers is the previous week, it is applied by means of an interview, and demonstrates suitable psycho-metric properties14,15.
Since the SS-QOL was developed in English, it was neces-sary to carry out a transcultural adaptation of the questionnaire (i.e., a literal translation is not enough), as well as an evaluation of the psychometric properties of the population where it was supposed to be used18-20. h e aims of this study were: 1) to carry
out the translation and cultural adaptation of the SS-QOL to speakers of Brazilian Portuguese / Brazilian culture; 2) to ex-amine the validity of the scoring standards of the items and of the individuals’ responses; 3) to pinpoint the drawbacks of the instrument and, if necessary, to propose revisions or the exclusion of items which did not present suitable psychometric qualities, in order to make it clinically feasible in Brazil.
Methods
Translation and transcultural adaptations
According to the guidelines put forward by Beaton et al.18, the SS-QOL was translated into Portuguese by two
bilingual translators, whose mother tongue was Portuguese. One of them was aware of the aims and concepts that were being evaluated by the instrument, whereas the other did not work in health related areas, nor had any previous knowledge of the instrument’s intentions or concepts. They worked separately, so that neither of them would influence the other’s translation. The synthesis of the two versions was made by comparing the original version and the two translations, and was carried out by both translators and by the researcher. Stemming from this final version, a retro-translation was made by two other qualified translators, whose native language was English, in which the original instrument had been written, both living for many years in Brazil as English teachers. None of them had previous knowledge of the intentions nor concepts of the materials, and independently made the retro-translations. At this point we checked whether the translated version maintained the same content as the original. Following the translation and retro-translation process, the final version of the instrument was submitted to revisions by a committee of specialist judges, composed of a physical therapist (a university pro-fessor who mastered both the subject matter of the research and the two languages), two English teachers who learned how to read and write in English and who spoke Portuguese fluently, and the author of this project. This committee dis-cussed the clarity, pertinence, and equivalence between the translated and the retro-translated versions and the origi-nal version of the instrument. In the translated format, the Stroke Specific Quality of Life (SS-QOL) scale demonstrates a possible resulting score of between 245 to 49 points, with the lower the score indicating higher dependence and dif-ficulty to perform the tasks(Table 1).
Test-retest reliability
The translated version (SS-QOL) was administered to 10 adult hemiplegics recruited from the Belo Horizonte community, following the recommendations suggested by Beaton et al.18, and repeated twice, within a five day interval,
in order to investigate the reliability of the test-retest proce-dures. Coefficients of the intra-class correlations (ICC) were calculated using SPSS for Windows (version 13.0) software, in which the 12 domains were evaluated.
SS-QOL application
Participants
Following the recommendations provided by Beaton et al.18, 50 hemiplegics were then recruited in Belo Horizonte/
MG, from hospitals, out-patient clinics, practices, and research
151 Table 1. Stroke Specifi c Quality of Life (SS-QOL).
Scoring: each item shall be scored with the following key
Total help – Couldn’t do it at all - Strongly agree 1
A lot of help - A lot of trouble - Moderately agree 2
Some help – Some trouble - Neither agree nor disagree 3 A little help - A little trouble - Moderately disagree 4 No help needed - No trouble at all - Strongly disagree 5
Item Score
1. Energy
1. I felt tired most of the time. 2. I had to stop and rest during the day. 3. I was too tired to do what I wanted to do. 2. Family Roles
1. I didn’t join in activities just for fun with my family. 2. I felt I was a burden to my family.
3. My physical condition interfered with my personal life. 3. Language
1. Did you have trouble speaking? For example, get stuck, stutter, stammer, or slur your words? 2. Did you have trouble speaking clearly enough to use the telephone?
3. Did other people have trouble in understanding what you said? 4. Did you have trouble fi nding the word you wanted to say? 5. Did you have to repeat yourself so others could understand you? 4. Mobility
1. Did you have trouble walking? (If patient can’t walk, go to question 4 and score questions 2-3 as 1.) 2. Did you lose your balance when bending over to or reaching for something?
3. Did you have trouble climbing stairs?
4. Did you have to stop and rest more than you would like when walking or using a wheelchair? 5. Did you have trouble with standing?
6. Did you have trouble getting out of a chair? 5. Mood
1. I was discouraged about my future.
2. I wasn’t interested in other people or activities. 3. I felt withdrawn from other people.
4. I had little confi dence in myself 5. I was not interested in food. 6. Personality
1. I was irritable.
2. I was inpatient with others. 3. My personality has changed. 7. Self Care
1. Did you need help preparing food?
2. Did you need help eating? For example, cutting food or preparing food?
3. Did you need help getting dressed? For example, putting on socks or shoes, buttoning buttons, or zipping? 4. Did you need help taking a bath or a shower?
5. Did you need help to use the toilet? 8. Social Roles
1. I didn’t go out as often as I would like.
2. I did my hobbies and recreation for shorter periods of time than I would like. 3. I didn’t see as many of my friends as I would like.
4. I had sex less often than I would like.
5. My physical condition interfered with my social life. 9. Thinking
1. It was hard for me to concentrate. 2. I had trouble remembering things. 3. I had to write things down to remember them. 10. Upper Extremity Function
1. Did you have trouble writing or typing? 2. Did you have trouble putting on socks? 3. Did you have trouble buttoning buttons? 4. Did you have trouble zipping a zipper? 5. Did you have trouble opening a jar? 11. Vision
1. Did you have trouble seeing the television well enough to enjoy a show? 2. Did you have trouble reaching things because of poor eyesight? 3. Did you have trouble seeing things off to one side?
12. Work / Productivity
projects. h ere were no restrictions as far as gender was con-cerned; however, the individuals had to be over 18, suf ered from a post-stroke period of at least three months, without the presence of apparent understanding dei cits. Due to the probability that some of the individuals were illiterate or semi-illiterate, and in order to avoid misinterpretations, the ques-tionnaire was verbally administered by means of an interview by a single trained examiner.
Statistical analyses
As in other studies involving translations and adaptations of instruments into Portuguese21-23, the i nal translated version
of the instrument was evaluated by using Rasch’s model. h is analysis allows one to calibrate the diffi culty of the items and the level of ability of the individuals on the same simple linear continuum, at equal intervals, along which each item and each individual are aligned 24,25.
h e basic assumption of the Rasch analysis, in this case, was that the better a person’s QOL perception, the greater the possibility of him/her achieving high scores for all the items on the scale, whether they were easy or diffi cult. On the other hand, the easier the item, the greater was the probability of any person to get a high score on it26. When all the items of a
test fuli lled these expectations, the test was then i tted into a measurement model26 and those individuals with greater
com-petence in the domain of a given function, in this case QOL, were more likely to receive higher scores than those having less competence. h ese principles are only applicable if the set of items measures a unidimensional skill27.
In this study, the analysis of the calibration of the SS-QOL items was carried out by using the WINSTEPS 200528 program,
which calculates values such as MnSq and the “t” values asso-ciated with this estimate, that indicate whether the relation between the individual’s ability and the item’s diffi culty fuli ll the model’s assumptions. Linacre and Wright28 suggested MnSq= 1±0.3, with an associated t=±2 as reasonable values to indicate the suitability of the items. A very high MnSq value indicates that the scores on this item were too variable or er-ratic28. In other words, people unexpectedly who had a poor
QOL perception received higher scores on the diffi cult items or vice-versa26. h is either suggests that the item does not
combine with the others to dei ne a skill continuum, or else that there exist problems in the dei nition of the item, which must then go under a revision so that the framing can take place24,26. On the other hand, a very low MnSq value, <0.7,
indi-cates little variability of scores on that item, i.e., the response pattern was predictable or deterministic24,26. h e i rst result
represents a greater threat for the test’s validity, whereas the second indicates that the item does not discriminate between individuals with dif erent QOL levels.
Since erratic scores indicate a greater problem in the dei -nition of the item, those with higher MnSq values, in its two formats, “Infi t” and “Outfi t”, were indicated for revisions. It is generally assumed that when more than 5% of the total num-ber of items do not i t the model, the items of the scale do not combine to measure a unidimensional concept24.
In addition, the Rasch model provides an error value asso-ciated with the calibration of the items and of the individuals, which underlines the precision of the measurements obtained. h e error value is used to calculate the index of separation of the items by their level of diffi culty and of individuals by QOL level. h is allows the calculation of an estimate of the test’s ca-pacity to divide the sample into dif erent QOL levels. A test is supposed to divide the participants into at least three levels of ability (low, average, and high) 25.
h e study was approved by the Ethics Committee in Re-search of the Universidade Federal de Minas Gerais, under protocol n° ETIC 171/05. h e participants were made aware of the purposes of the study and invited to sign a term of free agreement and participation form.
Results
Sample characterization
Of the 10 individuals who took part in the CCI analysis, they were on average 61.56 (± 9.74) years old; six were female, suf ered the same lateral impairments for both sides (50% R and 50% L); seven had suf ered a hemorrhagic stroke; seven did not use ortheses or aids; nine were taking medications; and seven were undergoing physical therapy treatment. h e 12 domains of the scale were evaluated and obtained CCI values ranging from 0.80 (Personality and Self-Care) to 0.98 (Work/Productivity), and a Grand Total of 0.97.
Fifty hemiplegics took part in the testing of the instru-ment, being 58.64 (± 13.92) years old on average (18 to 89) and having an average post-stroke evolution time of 4.07 (± 3,85) years (three months to 15 years). Out of these, 48% were female, 54% hemiplegics to the right, 14% used orthe-ses, and 30% had some walking; 43 were undergoing physical therapy treatments due to their neurological condition; 94% were taking medications, mainly antihypertensive drugs; 90% reported some associated disease; 28% of them did not complete primary school, and only three had graduated; 26 were married, 11 single, eight were widows/widowers and i ve were separated/divorced; 33 were retired or took retire-ment due to disabilities, 12 were already retired by the time of the stroke, three had never worked, and two were profes-sionally active.
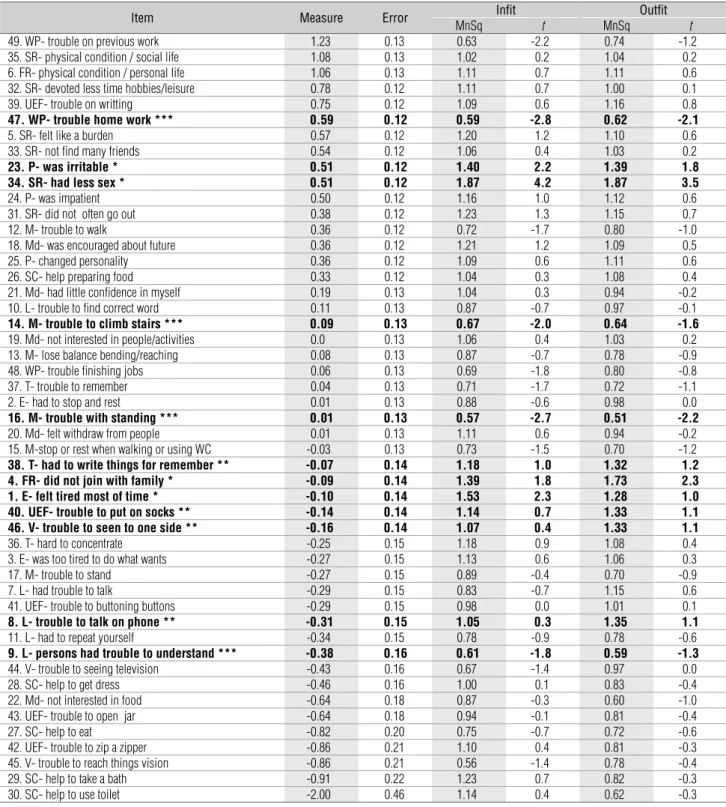
Rasch analysis
h e results of Rasch’s analysis are presented in Table 2, in which the MnSq and t (“infi t” e “outfi t”) calibration values were discriminated for each item. For example, Item 49–3) “Did you have trouble doing the work you used to do?” was the most diffi cult
(lowest gross score – 121); and 30–5), “Do you need help to use the toilet?” was the easiest (highest gross score – 246). Out of the 49 items of the questionnaire, four (8.16%) did not fuli ll the ex-pectations of the model: numbers 1, 4, 23, and 34 demonstrated MnSq> 1.3 and t> 2. h e examination of the score use indicates that categories 2 and, especially, 3 and 4 had little dif erence
153 Table 2. SS-QOL Calibration Items.
Item Measure Error Infi t Outfi t
MnSq t MnSq t
49. WP- trouble on previous work 1.23 0.13 0.63 -2.2 0.74 -1.2 35. SR- physical condition / social life 1.08 0.13 1.02 0.2 1.04 0.2 6. FR- physical condition / personal life 1.06 0.13 1.11 0.7 1.11 0.6 32. SR- devoted less time hobbies/leisure 0.78 0.12 1.11 0.7 1.00 0.1 39. UEF- trouble on writting 0.75 0.12 1.09 0.6 1.16 0.8
47. WP- trouble home work *** 0.59 0.12 0.59 -2.8 0.62 -2.1
5. SR- felt like a burden 0.57 0.12 1.20 1.2 1.10 0.6
33. SR- not fi nd many friends 0.54 0.12 1.06 0.4 1.03 0.2
23. P- was irritable * 0.51 0.12 1.40 2.2 1.39 1.8
34. SR- had less sex * 0.51 0.12 1.87 4.2 1.87 3.5
24. P- was impatient 0.50 0.12 1.16 1.0 1.12 0.6
31. SR- did not often go out 0.38 0.12 1.23 1.3 1.15 0.7
12. M- trouble to walk 0.36 0.12 0.72 -1.7 0.80 -1.0
18. Md- was encouraged about future 0.36 0.12 1.21 1.2 1.09 0.5
25. P- changed personality 0.36 0.12 1.09 0.6 1.11 0.6
26. SC- help preparing food 0.33 0.12 1.04 0.3 1.08 0.4 21. Md- had little confi dence in myself 0.19 0.13 1.04 0.3 0.94 -0.2 10. L- trouble to fi nd correct word 0.11 0.13 0.87 -0.7 0.97 -0.1
14. M- trouble to climb stairs *** 0.09 0.13 0.67 -2.0 0.64 -1.6
19. Md- not interested in people/activities 0.0 0.13 1.06 0.4 1.03 0.2 13. M- lose balance bending/reaching 0.08 0.13 0.87 -0.7 0.78 -0.9 48. WP- trouble fi nishing jobs 0.06 0.13 0.69 -1.8 0.80 -0.8 37. T- trouble to remember 0.04 0.13 0.71 -1.7 0.72 -1.1 2. E- had to stop and rest 0.01 0.13 0.88 -0.6 0.98 0.0
16. M- trouble with standing *** 0.01 0.13 0.57 -2.7 0.51 -2.2
20. Md- felt withdraw from people 0.01 0.13 1.11 0.6 0.94 -0.2 15. M-stop or rest when walking or using WC -0.03 0.13 0.73 -1.5 0.70 -1.2
38. T- had to write things for remember ** -0.07 0.14 1.18 1.0 1.32 1.2
4. FR- did not join with family * -0.09 0.14 1.39 1.8 1.73 2.3
1. E- felt tired most of time * -0.10 0.14 1.53 2.3 1.28 1.0
40. UEF- trouble to put on socks ** -0.14 0.14 1.14 0.7 1.33 1.1
46. V- trouble to seen to one side ** -0.16 0.14 1.07 0.4 1.33 1.1
36. T- hard to concentrate -0.25 0.15 1.18 0.9 1.08 0.4 3. E- was too tired to do what wants -0.27 0.15 1.13 0.6 1.06 0.3
17. M- trouble to stand -0.27 0.15 0.89 -0.4 0.70 -0.9
7. L- had trouble to talk -0.29 0.15 0.83 -0.7 1.15 0.6 41. UEF- trouble to buttoning buttons -0.29 0.15 0.98 0.0 1.01 0.1
8. L- trouble to talk on phone ** -0.31 0.15 1.05 0.3 1.35 1.1
11. L- had to repeat yourself -0.34 0.15 0.78 -0.9 0.78 -0.6
9. L- persons had trouble to understand *** -0.38 0.16 0.61 -1.8 0.59 -1.3
44. V- trouble to seeing television -0.43 0.16 0.67 -1.4 0.97 0.0 28. SC- help to get dress -0.46 0.16 1.00 0.1 0.83 -0.4 22. Md- not interested in food -0.64 0.18 0.87 -0.3 0.60 -1.0 43. UEF- trouble to open jar -0.64 0.18 0.94 -0.1 0.81 -0.4
27. SC- help to eat -0.82 0.20 0.75 -0.7 0.72 -0.6
between them, however, the re-analysis with combined catego-ries did not improve the quality of the scale.
h e individuals’ index of separation was 3.34, indicating that the items divided the people into at least three QOL levels, and the items’ index of separation was 3.36 (three levels of diffi culty – low, average, and high). Some analyses involving combined cat-egories were carried out, but this did not improve the indices of separation nor the reliability, hence they were not reported. h e estimate of internal consistency or stability of item calibrations and of the individuals’ was 0.92. Since the results indicated that the explained variance was of 64% and there was no evidence of item organization in a second factor (unexplained variance of the i rst factor was of only 4.6), this data was considered irrelevant.
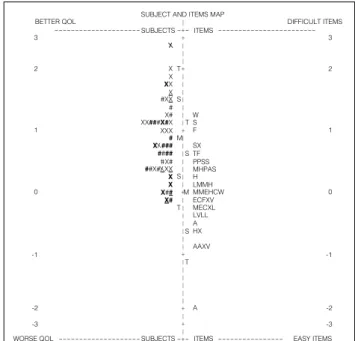
Figure 1 shows a map that represents the level of diffi culty of the items in relation to the QOL of the individuals of this sample. h is map illustrates the QOL continuum of the sample on the left, and the diffi culty of the items on the right. On top of the continuum, one can observe the presence of some individuals without the presence of items aligned on the right. In the lower part, one can observe that some items were very easy, as well as the absence of people with such a low QOL in the sample. h is i gure dif erentiates the individuals according to stroke type, age, and phase; and the items according to the domains.
Discussion
h e global coeffi cient of SS-QOL calibration reliability was 0.92, which indicates stability in the items’ calibration. For the individuals, this coeffi cient was also 0.92, which means that the individuals’ answers were also quite reliable; thus, the mea-surements can be reproduced in subsequent applications.
h e value found for the index of separation of the sample’s individuals (3.34) indicates that they were divided into three levels of QOL: low, average, and high. What would be expected from a test analysis like the SS-QOL is that there will be a small number of individuals in the upper part of the continuum, i.e., few people with high QOL, and also a small number in the lower part of the continuum, i.e., few highly impaired people, with low QOL. Most of them must be distributed along the middle third of the continuum, which characterizes a moderate QOL, a behaviour that, as observed in Figure 1, was reproduced.
h e Rasch analysis detected four items (8.16%) with erratic behaviors (numbers 1, 4, 23, and 34)., which was superior to what is recommended (5%) to indicate that the instrument measured a unidimensional concept. In regards to item 1 (“I felt tired most of the time”), considering that the individuals of the sample had a light or moderate impairment, one would expect them not to be tired most of the time. By examining the punc-tuation for this item, it was observed as an unexpected answer from only one individual, a very functional 71-year-old lady who had chronic consequences for six years and who had gone on a trip to Aparecida do Norte in the week previous to the test, which made her very tired. Even though, her tiredness did not prevent her from doing what she wanted and/or needed to do.
Likewise, for item 4 (“I did not take part in the activities with my family just for fun / leisure”), because of their inde-pendent or semi-deinde-pendent condition, these individuals were not supposed to have difficulty taking part in leisure activities with their families. The act of having fun, besides involving religious issues, depends on people’s habits23. So,
not having fun, in this case, may not reflect the lack of abil-ity to do so, but a lack of this habit or interest. For this item, the individuals who demonstrated the most unexpected answers were those numbered 9 and 44, both tending to have more lonesome, although functional, habits. Upon analyzing item 23 “I was irritable (on the verge of a nervous breakdown)”, one can perceive that any individual, regard-less of his/her physical, functional, or QOL conditions, can experience irritability.
Another problem-item was number 34 - “I had less sex than I would like to”. Maybe due to age or to the fact that many of them did not have a partner, one can notice that the sexual issue was not fundamental in their lives. Only two individuals – numbers 7 and 36 – showed an unexpected response pattern
154
Figure 1. Representative map of subjects and item distributions related to QOL levels.
X ITEMS SUBJECTS BETTER QOL
SUBJECT AND ITEMS MAP
DIFFICULT ITEMS 3 X 3 T 2 2 X XX -2 -3 -1 0 1 WORSE QOL T AAXV A ITEMS SUBJECTS SX TF PPSS MHPAS H LMMH MMEHCW ECFXV MECXL LVLL A HX M S S S T # X# XX###X#X XXX
# XX### #### #X#
##X#XXX
X X X## X# X #XX T W S F EASY ITEMS -2 -3 -1 0 1 S M
in this item. h e former was single, 49 year old did not have a partner, and looked after her ill elderly mother, but had physi-cal conditions to have a sexual intercourse, and would like to do so. h e latter, in turn, was a 65-year-old male, married, who reported not having sexual relations because his wife did not want it anymore. In future studies, the behavior of erratic items must be monitored in order to check if the problems detected in this study still persist. If so, one should consider the possibil-ity of revising them, or even leaving them out. For this sample, they were duly justii ed.
Some inferences may be drawn upon observing the individu-als along the continuum in Figure 1. With regard to the stroke type (isquemic or hemorrhagic), one can observe that both were distributed along all of the continua, but there was a greater con-centration of individuals isquemic stroke on the top of the scale. In general, the consequencessuf ered by the hemorrhagic pa-tients are more severe, when the same characteristics are taken into account (location and extension of the lesion, sex, age)29.
Nevertheless, as QOL impairment is not evaluated based only on physical parameters, there were isquemic individuals who showed worse QOL than the hemorrhagic ones, which reinforces the complexity of the term QOL, involving emotional, physical, and social issues.
Most of the sample in the present study was made up of chronic individuals; only six of them were sub-acute ( from three to six months after the stroke), and there seemed to be no dif erences between both groups. h is statement must be interpreted with caution, since the number of sub-acute indi-viduals was very small.
Finally, the separation according to age group showed that the young adult individuals (18 to 39 years old.) had from aver-age to high QOL scores, whereas the remainder of adults and senior citizens (40-59, and over 60 years old, respectively) were well-distributed along the continuum, the latter tending to
have a better QOL. h is information corroborates the evidence that elderly individuals adjust themselves better to their health condition, by coming to terms with their limitations30.
Studies report great variability of both motor and functional impairments in hemiplegics, depending on the location and extension of the lesion, as well as on sex, age, and their previous experiences13,29. h us, it is crucial to have items to evaluate all
of this range of variables.
h e presence of very easy or very diffi cult items constitutes an advantage for the instrument. h e former makes sure that it can be applied to more impaired or institutionalized individu-als. On the other hand, the presence of diffi cult items makes it possible to use the instrument with people having a better QOL23. h e SS-QOL showed items that were too easy, without
individuals having such low QOL that could align themselves to the level of those items. If applied to a more functionally impaired population, maybe another distribution might be contemplated, covering the lowest levels of the scale.
For further studies, it is important that the SS-QOL be ap-plied with other samples, so that the validity of the instrument can be more broadly examined. If the same items demonstrate erratic patterns with other types of samples, the instrument might undergo a series of changes, with the due approval from its authors, and followed by subsequent evaluative studies of the modii ed instrument.
h e analysis showed that SS-QOL can be used with indi-viduals similar to the sample used in the present study. How-ever, it is suggested that the interviewer reinforces the initial instructions at dif erent moments of the questionnaire, espe-cially in those items which show a greater variability in the responses. Besides, the evaluator must be alert concerning the interpretation of the test results, detecting problematic items to make sure that the i nal scores represents the actual QOL of the individual.
155
References
1. Mayo NE, Wood-Dauphinee S, Ahmed S, Gordon C, Higgins J, McEwen S, et al. Disablement following stroke. Disabil Rehabil. 1999;21(5-6):258-68.
2. Lessa I. Epidemiologia das doenças cerebrovasculares no Brasil. Rev. Sociedade Cardiol Estado São Paulo. 1999;9(4):509-18.
3. Wood-Daphinee S. The epidemiology of stroke: relevance for physical therapists. Physiotherapy Canadian. 1985;37:377-86.
4. Teixeira-Salmela LF, Oliveira ESG, Santana EGS, Resende GP. Fortalecimento muscular e condicionamento físico em hemiplégicos. Acta Fisiátrica. 2000;7:108-18.
5. Hopman WM, Verner J. Quality of life during and after inpatient stroke rehabilitation. Stroke. 2003;34(3):801-5.
6. Verbrugge LM, Jette AM. The disablement process. Soc Sci Med. 1994;38(1):1-14.
7. Lai SM, Perera S, Duncan PW, Bode R. Physical and social functioning after stroke: comparison of the Stroke Impact Scale and Short Form-36. Stroke. 2003;34(2):488-93.
8. Dorman P, Slattery J, Farrell B, Dennis M, Sandercock P. Qualitative comparison of the reliability of health status assessments with the EuroQol and SF36 questionnaires after Stroke. Stroke. 1998;29:63-8.
9. Hobart JC, Williams LS, Moran K, Thompson AJ. Quality of life measurement after stroke: uses and abuses of the SF-36. Stroke. 2002;33:1348-56.
156
11. Teixeira-Salmela LF, Olney SJ, Nadeau S, Brouwer B. Muscle strengthening and physical conditioning to reduce impairment and disability in chronic stroke survivors. Arch Phys Med Rehabil. 1999;80:1211-8.
12. Indredavik B, Bakke F, Slørdahl SA, Rokseth R, Håheim LL. Stroke unit treatment improves long term quality of life – a randomized controlled trial. Stroke. 1998;29:895-9.
13. Williams LS, Weinberger M, Harris LE, Biller J. Measuring quality of life in a way that is meaningful to stroke patients. Neurology. 1999;53(8):1839-43.
14. Williams LS, Weinberger M, Harris LE, Clark DO, Biller J. Development of a stroke-specifi c quality of life scale. Stroke. 1999;30(7):1362-9.
15. Duncan PW, Jorgensen HS, Wade DT. Outcome measures in acute stroke trials: a systematic review and some recommendations to improve practice. Stroke. 2000;31(6):1429-38.
16. Moon YS, Kim SJ, Kim HC, Won MH, Kim DH. Correlates of quality of life after stroke. J Neurological Sci. 2004;224:37-41.
17. Lai SM, Studenski S, Duncan PW, Perera S. Persisting consequences of stroke measured by the Stroke Impact Scale. Stroke. 2002;33:1840-4.
18. Beaton DE, Bombardier C, Guillemin F, Ferraz MB. Guidelines for the process of cross-cultural adaptation of self-report measures. Spine. 2000;25(24):3186-91.
19. Guillemin F, Bombardier C, Beaton D. Cross-cultural adaptation of health related quality of life measures: literature review and proposed guidelines. J Clinical Epidemiology. 1993;46(12):1417-32.
20. Schmidt S, Bullinger M. Current issues in cross-cultural quality of life instrument development. Arch Phys Med Rehabil. 2003;84(s2):29-34.
21. Duncan PW, Bode RK, Min Lai S, Perera S; Glycine Antagonist in Neuroprotection Americans Investigators. Rasch analysis of a new stroke-specifi c outcome scale: the Stroke Impact Scale. Arch Phys Med Rehabil. 2003;84(7):950-63.
22. Teixeira-Salmela LF, Magalhães LC, Souza AC, Lima MC, Lima RC, Goulart F. Adaptação do perfi l de saúde de Nottingham: um instrumento simples de avaliação da qualidade de vida. Cad Saúde Pública. 2004;20(4):905-14.
23. Souza AC, Magalhães LC, Teixeira-Salmela LF. Adaptação transcultural e análise das propriedades psicométricas da versão brasileira do Perfi l de Atividade Humana. Cad Saúde Pública. 2006;22(12):2623-36.
24. Lai JS. Construct validity of the sensory integration and praxis tests. Occup Ther J Research. 1996;16:75-97.
25. Velozo CA, Magalhães LC, Pan AW, Leiter P. Functional scale discrimination at admission and discharge: Rasch analysis of the Level of Rehabilitation Scale-III. Arch Phys Med Rehabil. 1995;76(8):705-12.
26. Chern JS, Kielhofner G, de las Heras CG, Magalhaes LC. The Volitional Questionnaire: psychometric development and practical use. Am J Occup Ther. 1996;50(7):516-25.
27. Wright DD, Stone MH. Best Test design. Chicago: MESA Press; 1979.
28. Linacre MJ, Wright BD. WINSTEPS: Rasch-model computer program. Chicago: MESA Press; 2005.
29. Carr J, Shepherd R. Stroke. In: Carr J, Shepherd R. Neurological rehabilitation: optimizing motor performance. Oxford: Butterworh Heinemann; 2000: 242-78.