Printed in Brazil - ©2006 Sociedade Brasileira de Química 0103 - 5053 $6.00+0.00
Article
*e-mail: [email protected]; [email protected]
#Present addresses: Fundação Estadual de Proteção Ambiental Henrique Luis
Roessler, Rua Carlos Chagas, 55, 90030-020 Porto Alegre-RS, Brazil and Universidade Estadual do Rio Grande do Sul, Unidade Bento Gonçalves, Av. Benjamin Constant, 229, 95700-000 Bento Gonçalves-RS, Brazil.
Anionic Surfactant Aggregation with (Hydroxypropyl)cellulose in the Presence of Added Salt
Ricardo M. Martins, Carolina A. da Silva, Cristiane M. Becker, Dimitrios Samios, Marcelo Christoff *,# and Clara I. D. Bica*
Instituto de Química, Universidade Federal do Rio Grande do Sul, Av. Bento Gonçalves, 9500, CP 15003, 91501-970 Porto Alegre-RS, Brazil
Estudou-se a agregação de surfactantes aniônicos em soluções aquosas diluídas de (hidroxipropil)celulose (HPC) sob moderada força iônica (NaCl 0,1 mol L-1). Empregaram-se os surfactantes colato de sódio (CS), deoxicolato de sódio (DC) e dodecil sulfato de sódio (SDS). Observou-se decréscimo da concentração de agregação crítica (C1) para SDS e DC em comparação à concentração micelar crítica (CMC), enquanto ocorreu aumento para CS, a 298 K. A viscosidade relativa apresentou um máximo para o sistema SDS/HPC, mas permaneceu constante para CS/HPC ou DC/HPC. Houve aumento da temperatura de turbidez para todos os sistemas. Utilizando-se espalhamento de luz dinâmico, verificou-se que, a baixas concentrações de surfactante, o modo rápido da HPC relaciona-se a agregados surfactantes/HPC e cadeias poliméricas curtas; a altas concentrações, a micelas livres. O modo lento relaciona-se a complexos surfactante/HPC ou a “clusters” de HPC. Nos sistemas sais biliares/HPC, o mecanismo de agregação pode ocorrer em duas etapas.
The aggregation of different anionic surfactants in dilute aqueous solutions of (hydroxypropyl)cellulose (HPC) under moderate ionic strength (NaCl 0.1 mol L-1) was studied. The surfactants were sodium cholate (CS), sodium deoxycholate (DC) and sodium dodecylsulphate (SDS). By fluorescence probing, the critical aggregate concentration (C1) decreased for SDS and DC in comparison to the critical micelle concentration (CMC) whereas it increased for CS at 298 K. The relative viscosity reached a maximum for SDS/HPC but remained constant for CS/HPC and DC/HPC. By light scattering, cloud points were verified to increase. By dynamic light scattering, it was concluded that, at low surfactant contents, the fast mode of HPC is related to surfactant/HPC aggregates and shorter HPC chains; at high contents, to free micelles. The slow mode is linked to interchain polymer-surfactant complexes and HPC clusters. For the bile salts/ HPC systems, the mechanism of aggregation may occur in two steps.
Keywords: bile salt, cholate, anionic surfactant, (hydroxypropyl)cellulose, light scattering
Introduction
Polymer-surfactant systems are subject of great interest because their physical properties are relevant to scientific and technological development. Cellulose ether derivatives such as (hydroxypropyl)cellulose (HPC) are water-soluble uncharged polymers that interact with anionic surfactants in solution changing the rheological properties of the system.1 Interactions between nonionic
polymers and ionic surfactants are a consequence of weak intermolecular forces which allow for a wide variety and range of behaviors in these systems. The directed action of a number of weak interactions leads to the cooperative nature of the aggregation behavior usually characterized by a starting surfactant concentration termed the critical aggregation concentration (C1). The stabilization of the interfaces between the hydrophobic core of the aggregates and water is the major driving force for polymer-surfactant interaction.2,3
hydrophobic modifications into polymers, as for example poly(sodium acrylate),4 (hydroxyethyl)cellulose,5-7
(hydroxypropyl)cellulose,8 ethyl(hydroxyethyl)cellulose,9, 10
and poly(oxyethylene).11 It was verified that
hydro-phobically modified polymers have improved properties in comparison to their unmodified analogues. These modified polymers show interesting rheological behavior depending the viscosity strongly on the shear rate and surfactant concentration.12 In general both block and graft
copolymers as well as more complex architectures were studied.11 Nevertheless only a few types of surfactants have
been investigated, most of them formed by long alkyl chains with a polar head group.13-16
We have previously studied different anionic surfactants with respect to the aggregation with the low molar mass, non charged flexible polymer poly (ethylene oxide),17 including some natural anionic
surfactant bile salts, namely, sodium cholate (CS) and sodium deoxycholate (DC), that are carboxylic polyhydroxy derivatives from cholesterol18 and the
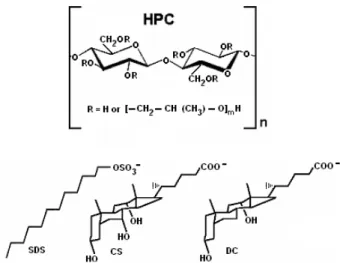
well-known sodium dodecylsulfate (SDS) that is a long chain alkylsulfate. The molecular shape of the bile salts exhibits a planar polarity due to spatial distribution of lateral groups in their steroid backbone. The bile salt structures result in smaller and more rigid aggregates than the micelles formed by conventional alkyl-surfactants providing highly non-polar micro-environments with chiral properties.19 Indeed the
balance of hydrophobic and electrostatic forces in the polymer-surfactant interaction in moderate ionic strength was shown to be sensitive to different surfactant structures being the hydrophobic component more relevant to bile salt aggregation.17 The present article
uses the same set of surfactants (CS, DC and SDS)
(Figure 1) in order to study their aggregation behavior in the presence of the semi-rigid non-ionic polymer HPC by applying techniques such as fluorescence probing, capillary viscometry, static and dynamic light scattering, including turbidimetry. Due to the presence of salt in all body fluids20 and to potential applications
in pharmaceutical formulations, the interaction of HPC with each of these anionic surfactants was investigated in aqueous NaCl 0.1 mol L-1.
The interaction between bile salts and cellulose derivatives at molecular level has received little attention. Up to our knowledge it has been studied only with (hydroxypropylmethyl)cellulose.21,22 It was
verified that the aggregation process was cooperative and that the aggregates were small, highly hydrophobic and with low surface charge density.21 The addition of
a very small amount of DC to an aqueous HPMC solution already changed the dynamics of the reduction of surface tension.22
Experimental
The surfactants CS (99%, Sigma), DC (99%, Sigma), SDS (99.5%, Fischer) were used as received. (Hydroxy-propyl)cellulose (HPC, Aldrich) has average molar substitution degree for hydroxypropyl oxide group per anhydroglucose unit MS = 4.5 (NMR). A stock aqueous solution of HPC was dialyzed one week (Membracel tubing, cut-off 12,000-16,000 g mol-1; Polylabo) and
filtered subsequently through 8 and 0.45 µm membrane filters (Millipore). After dialysis HPC presents Mw = 110,000 g mol-1, radius of gyration Rg = 39.5 nm; second
virial coefficient A2 = 1.02 10-3 mol cm3 g-2 (data obtained
through static light scattering by using Zimm plot extrapolation procedures); refractive index increment dn/ dc = 0.1736 mL g -1 obtained by differential
refrac-tometry; hydrodynamic radius RH =13.2 nm obtained by dynamic light scattering (DLS) at infinite dilution and zero angle (aqueous NaCl 0.1 mol L-1 solution, T = 298
K) and Mw/Mn = 2.5 (GPC). Pyrene (Py, Aldrich) was recrystallized twice from ethanol solution. All solutions were prepared with Milli-Q grade water (Millipore). The probe solution was prepared by evaporating the suitable volume of the ethanol stock solution, followed by dissolution of the remaining solid in the surfactant/HPC solution. All surfactant/HPC solutions were stirred for 12 h at room temperature before the measurements. To remove dust for the light scattering experiments the solutions were filtered through 0.45 µm filter (Millipore) and centrifuged at 4000 rpm for 90 minutes. All the presented data are averaged from three experimental sets.
Fluorescence
The steady-state fluorescence measurements employed a Hitachi F-4500 Spectrophotometer with cell holder thermostated by a circulating ethylene glycol bath. The fluorescence spectra for Py were recorded in the corrected spectrum mode with excitation wavelength set at 336 and 2.5 mm slit. The ratio I1/I3 was taken from first (372 nm) and third (384 nm) vibronic peaks in the Py emission spectrum that has been shown to be a sensitive function of local polarity in organized systems.23 The Py
concentration was kept low (≤ 5 × 10⁻⁶ mol L-1)to exclude
the possibility of excimer formation that may occur when the concentration is higher than 10–4 mol L-1.
Light scattering
Static and dynamic light scattering as well as turbidimetry have been undertaken on a Brookhaven Instruments spectrometer with a He-Ne laser at 632.8 nm. A 264-channel BI-9000 AT correlator covering 7 decades in delay time was used. The samples were thermostated in a refractive-index-matching liquid (decaline). A BI-DNDCW Brookhaven differential refractometer was used to measure the refractive index increment of HPC in NaCl 0.1 mol L-1 aqueous solution. All experiments took place
at 298 K. The cloud point of the solutions was measured by the intensity of the scattered light, IS, using the apparatus described above. The procedure involved heating at a constant rate of ca. 1.2 K min-1. The
temperature step was 1 K in the temperature range where IS changed. Before the measurement, each sample was pre-heated above the cloud point and cooled to room temperature.
In dynamic light scattering (DLS) the intensity time autocorrelation function G2(τ) of the scattered light intensity was measured:
G2(τ) = <I(0)I(τ)> (1)
and normalized by dividing it by the average intensity squared <I>2 (baseline). When the scattered electric field
is a gaussian process, the Siegert relation is valid:24
g2(τ) = 1+β [g1(τ)]2 (2)
where g2(τ) is the normalized intensity time auto-correlation function, g1(τ) is the field correlation function and β is the spatial coherence factor which depends on the optical set-up. In order to characterize the hydro-dynamic behavior of the aggregates, electric field time
correlation functions were analyzed by two-exponential fits24 (Microcal Origin 5.0) according to:
g1(τ) = A1exp(-Γ1τ)+A2exp(-Γ2τ) (3)
where A1 and A2 are the amplitudes of the fast and the slow modes, respectively and Γ1 and Γ2 are the relaxation rates of each mode. The translational diffusion coefficient D is obtained as:
Γ = Dq2 (4)
where q is the scattering vector whose modulus is given by q = 4πnsin(θ/2)/ λo with n the refractive index of the medium, θ the scattering angle and λo the wavelength of radiation in vacuum. It was also performed an inverse Laplace transformation to obtain the relaxation time distribution using the Repes Routine25 incorporated in the
Gendist26 commercial software package. The apparent
hydrodynamic radius, RH,app’ was obtained from the apparent diffusion coefficient at the fixed polymer concentration of [HPC] = 0.5% m/m and scattering angle
θ = 90° according to the Stokes-Einstein equation:24
(5)
where kB is the Boltzmann constant, T the absolute temperature and η the solvent viscosity. All experiments took place at 298 K.
Viscosity
The viscometric measurements were carried out in an ordinary Cannon-Fenske capillary viscometer (water flow time ~ 100 s) thermostated at 298 K by a water bath. The relative viscosity, ηrel was obtained by the expression where η and η0 are the viscosity of the sample and surfactant (free of polymer) in aqueous NaCl 0.1 mol L-1 solutions, respectively. The overlapping concentration,
c*, for HPC was obtained from determination of the intrinsic viscosity, [η] as 1/[η] ≅ 0.93% (not shown) in agreement with 1/(A2 Mw) ≅ 0.89%.
Results and Discussion
determined either by the inflection point of the curve (C1A)
or by the intercept from linear extrapolation on bottom and steep data (C1B) (Table 1). The difference between
both C1 values is proportional to non-cooperative character of the aggregation process. The critical surfactant concentration without polymer or critical micellization concentration (CMC) was obtained for each surfactant at 298 K in good agreement with literature values.16, 27 In the
presence of 0.5% HPC the C1 decreases with respect to CMC observed for the SDS/HPC2,28 and DC/HPC systems
whereas an opposite trend is observed for CS/HPC. An earlier study22 on the system DC/HPMC/NaCl 0.01 mol
L-1 indicated no changes with respect to CMC of DC but
in our work the higher ionic strength may have contributed to decrease the solubility of the system leading to
aggregation at lower concentration. The CMC reduction indicates polymer-surfactant association however the increment of CMC does not exclude it.22,29 The latter case
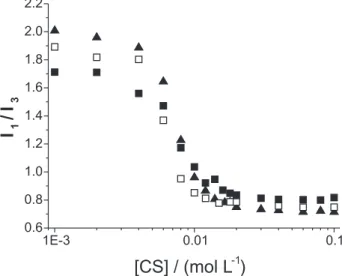
reflects a destabilization of the micelle. The cooperative degree of the aggregation leads to the sharpness of the steeper segment in the curves (Figures 2 and 3) which approximates both C1 values (Table 1). Therefore the cooperative degree of the aggregation in 0.5% HPC seems to increase for SDS (Figure 2) and DC30,31 but decreases
for CS (Figure 3).The same surfactants have shown a similar behavior with the non-ionic polymer poly(ethylene oxide).17 The micropolarity (µP) being the average ratio
I1/I3 value at the concentration range higher than C1 (bottom plateau range) indicates that 0.5% HPC does not change the hydrophobic pocket occupied by the fluorescent probe in the aggregate for any system.30 In
the case of bile salts/0.5% HPC systems, the low µP values indicate a possible absence of the palisade layer as suggested long ago for CS and DC free micelles in water in the presence of NaCl.32
The relative viscosity, ηrel of 0.5% HPC as a function of total surfactant concentration is presented in Figure 4. At 298 K the main change of ηrel is observed to SDS/HPC system as the viscosity increases up to 2.56 at 4 × 10⁻³
mol L-1 SDS concentration and decreases to 1.46 about
20 × 10-3 mol L-1. The curve for SDS/HPC system has the
same shape that was reported without salt33 changing the
maximum position to lower SDS concentration due to increase of the ionic strength.34 In addition, the maximum
viscosity at 4 × 10⁻³mol L-1 is also close to the value
observed for SDS/ethyl(hydroxyethyl)cellulose systems independently of the polymer concentration.1,14,35 Table 1. Aggregation parameters from fluorescence measurements at 298 K
Systemsa in µPb Cc / (103 mol L-1)
NaCl 0.1 mol L-1
Ad Bd
SDS 1.12 1.0 2.0
SDS, HPC 0.5% 1.12 0.63 1.0
SDS, HPC 1.2% 1.15 1.1 2.2
DC 0.68 2.3 3.1
DC, HPC 0.5% 0.67 0.78 1.1
DC, HPC 1.2% 0.75 1.4 3.2
CS 0.78 6.5 9.3
CS, HPC 0.5% 0.75 7.0 12.0
CS, HPC 1.2% 0.84 8.0 13.3
aHPC 110,000 g mol-1; bMicropolarity, µP, is the bottom average value of
the ratio I1/I3 (Py) in Figures 2 and 3, error ± 0.02; cC is the critical
mi-celle (CMC) or aggregation (C1) concentration, in mol L-1, error ± 10%; dobtained as (A) by the inflection point of aggregation curves calculated
from the minimum of its first derivative, or (B) by the intercept from linear extrapolation on bottom and steep data.
Figure 2. Dependence of the ratio I1/I3 on SDS concentration in NaCl 0.1 mol L-1 aqueous solution, in absence (open triangles) or with 0.5% (full
triangles) and 1.2% (diamonds) HPC at 298 K.
Figure 3. Dependence of the ratio I1/I3 on CS concentration in NaCl 0.1 mol L-1 aqueous solution, in absence (open squares) or with HPC 0.5%
The occurrence of the maximum viscosity above C1 can be attributed to the formation of interchain polymer-surfactant complexes.1,3,36 The subsequent decrease in the
viscosity with increasing SDS concentration indicates that the aggregate formation leads to a more compact polymer structure due to intrachain polymer-surfactant complexes.1,3 At higher SDS concentration the viscosity
falls below the initial level indicating the increase of the degree of flexibility/mobility as a result of HPC becoming more hydrophilic.3 In accordance to this interpretation is
the fact that the value of the micropolarity for SDS/HPC system is higher than that found for CS/HPC and DC/ HPC systems.30,31On the other hand the relative viscosity
for bile salts/0.5% HPC solutions is nearly constant. In this case, the technique was not sensitive enough to detect the interaction bile salts/HPC since no significant changes were observed in viscosity profile for these systems. This evidence can be related to the intensity of the interaction surfactant/HPC. It is known that free micelles of bile salts are smaller than the corresponding SDS systems even in the presence of PEO.17,27 The different behavior of these
systems can be correlated with a larger number of aggregates with smaller charge density and size in the case of the bile salts when compared to SDS.
The results obtained for turbidimetry are in agreement with this explanation. Typical experiments for the cloud point determination are shown in Figure 5a being the ratio IS/IM the scattered light intensity normalized by the highest intensity of each sample. The cloud point value is taken as the intercept from linear extrapolation between bottom and steep data. In Figure 5b in turn is shown the cloud point dependence on the total surfactant concentration for all surfactant/0.5% HPC systems. In the low surfactant
concentration range, the cloud point for 0.5% HPC / NaCl 0.1 mol L-1 (311K) is almost unchanged for all surfactant/
HPC solutions (Figure 5b). However at surfactant concentrations above each C1 there is a clear upper shift of the cloud point. The steep segment for SDS/HPC occurs about 4 × 10⁻³ mol L-1 surfactant concentration and it is
more pronounced than in the bile salts/HPC systems. The effectiveness of SDS to increase the cloud point of HPC has been attributed to electrostatic repulsion between their micelles bound to the polymer.33,37 In the present case,
the amount of added NaCl leads to a moderate ionic strength which seems not being able of completely screening this electrostatic repulsion. On the other hand
Figure 4. Relative viscosity, η/η0 of 0.5% m/m HPC / NaCl 0.1 mol L-1 as
a function of surfactant concentration, [Surfactant]: SDS (triangles), DC (circles) and CS (squares) where η0 stands for the viscosity of the free surfactant solutions(empty symbols) at 298K.
Figure 5. a) Temperature dependence of scattered light intensity (IS /IM) -normalized by the highest intensity of each sample - 0.5% m/m of HPC (up triangles); with [SDS] = 5 × 10⁻³ mol L-1 (down triangles), [DC] =
5 × 10⁻³ mol L-1 (circles) or [CS] = 17 × 10-3 mol L-1 (squares). All
solu-tions with NaC l 0.1 mol L-1. b) Cloud point as a function of the surfactant
concentration for 0.5% m/m of HPC; NaCl 0.1 mol L-1 with SDS
the behavior of the bile salts/HPC aggregate solutions is almost the same within the experimental error, starting the steep segment about 10-2 mol L-1 surfactant
concen-tration and reaching an upper limit to cloud point at 320 ± 3 K about 2 × 10⁻² mol L-1 surfactant concentration.
Another study employing some cationic surfactants as dodecyl tetramethyl ammonium halides with HPC has shown a cloud point increase also followed by a plateau dependent on type of the halide and the overall effect was attributed to small size – that is the case for bile salts – and spherical shape of their micelles.33
It is worth commenting on the fact that the heating rate of ca. 1.2 K min-1 is sufficiently slow for equilibrium
to be achieved and allowed to obtain reproducible results. For the cloud point determination of aqueous cellulose ether solutions, other studies38,39 have used even higher
rates. Moreover the procedures reported in the literature usually involve visual inspection. Our study detects clouding by the scattered light intensity with the advantage that this procedure does not depend on the human eye. Good reproducibility was achieved also by preheating the samples above their cloud points. When cooling back to room temperature, all material was dissolved, as indicated by the low scattered intensity sensitively monitored.
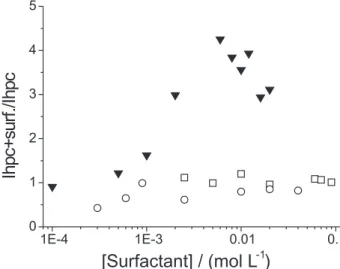
Figure 6 shows ratios of time averaged scattered intensities being the intensity scattered by surfactant/HPC systems over that of free HPC solution at 298K. The behavior is similar to the viscometric one seen in Figure 4: there is a maximum at [SDS] = 4 × 10 -3 mol L-1 followed
by a decrease of the intensity ratio while in the presence of the bile salts this ratio is nearly constant over the whole surfactant concentration range. When SDS is the surfactant, the concentration of added salt is again not enough to completely screen the electrostatic repulsion. This observed scattering behavior is consistent with that reported for high molecular weight poly(vinylpyrro-lidone), PVP, under moderate ionic strength40 where the
decrease of the scattered intensity was attributed to the effect of electrostatic repulsion which leads to enhan-cement of the second virial coefficient.
In dynamic light scattering two modes were observed in the time correlation functions: (i) a fast mode, related to single polymer chain, intrachain polymer/surfactant aggregates or free micelles and (ii) a slow mode assigned to polymer clusters and interchain polymer/surfactant complexes. It is well recognized that cellulose derivatives in aqueous solutions may show the presence of clusters that originate from the aggregation of their hydrophobic groups.41,42
Figure 7 shows the angle dependence for relaxation rate of the fast mode, Γ1, for different 0.5% HPC / NaCl
0.1 mol L-1 solutions with and without surfactants,
calculated from a two-exponential fit to the field correlation functions. For the free HPC solution the fast mode predominates over the slow mode: at 0.5% m/m HPC shows ca. 27% clusters (not shown). Both modes are diffusive as can be seen by the plots of the relaxation rate Γ1 (fast) and Γ2 (slow, not shown) versus the square of the scattering vector (q2) passing through the origin
within the experimental error. In Figure 7 the slope of the curves is proportional to the apparent diffusion coefficient which means that a common feature for bile salt aggregates is the increment of diffusiveness for the fast polymer mode while SDS does not change it. Considering the fast mode, the CS addition shows the highest diffusion coefficient among the systems presented being followed by DC. The behavior is analogous in the case of the slow mode with the exception that SDS/HPC system is faster than HPC without surfactant. These facts may reflect its highest unimer solubility among the three surfactants and, therefore, pointing out the main contribution from loosening the water superstructure (entropic component). It is also worth noting that the surfactant concentrations in Figure 7 were chosen in the aggregate range that represents similar aggregate concentration value for all surfactant/HPC systems.
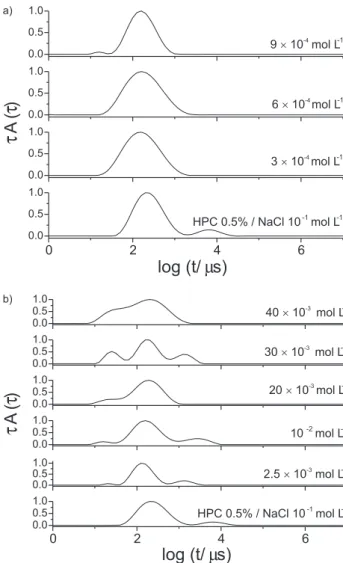
Figure 8 shows relaxation time distributions for the system CS/HPC 0.5%. In the absence of surfactant, HPC shows two distinct broad peaks, the one at longer relaxation times corresponds to HPC clusters whereas the other one can be assigned to single polymer chains. The latter is the dominant peak. When CS is added, changes in the distribution occur already below C1. At [CS] = 5 × 10⁻³ mol L-1 the cluster peak is shifted to shorter times Figure 6. Ratio of scattered intensities of 0.5% m/m HPC/surfactant so-lutions to the intensity of the free polymer solution HPC (Ihpc + surfac-tant/Ihpc) as a function of the surfactant concentration (mol L-1).
meaning that some clusters were dissolved (Figure 8a). Above C1, at [CS] = 20 × 10-3 mol L-1 three peaks can be
distinguished (Figure 8b). The middle peak is the dominant one being visibly narrower in comparison to the prevailing peak of pure HPC. The cluster peak is greatly reduced and shifted to shorter relaxation times. This means that most of the clusters were dissolved by the surfactant CS and its addition reduces the polydispersity of HPC. The cluster peak disappears at 80 × 10-3 mol L-1. At shorter relaxation
times, a small peak appears at 20 × 10-3 mol L-1 and gains
importance with the increase of CS concentration. As its position practically does not change, meaning that the hydrodynamic radius remains constant, this peak can be assigned to free micelles.
Figure 9a shows that DC dissolves HPC clusters already below C1 and makes wider the peak assigned to single HPC chains. Above C1, at [DC] = 2.5 × 10⁻³ mol L-1, the cluster
peak appears at shorter relaxation times (Figure 9b). As DC concentration increases, the distribution gets wider. At [DC] = 30 × 10-3 mol L-1 three peaks can be easily
distinguished, the one at shorter times can be assigned again to shorter HPC chains but also to free micelles, since at high surfactant concentrations the formation of free micelles is expected. At [DC] = 40 × 10-3 mol L-1 only one wide and
asymmetric peak is present.
Figure 10a shows that at [SDS] = 5 × 10⁻⁴ mol L-1 the
cluster peak is shifted to shorter relaxation times and increases its importance at [SDS] = 10-3 mol L-1. At
[SDS] = 2 × 10⁻³ mol L-1 there is only one wider peak
(Figure 10b). The maximum peak is shifted to longer relaxation times meaning that the average hydrodynamic radius <RH> increased. At [SDS] = 4 × 10⁻³ mol L-1 a further
increase of <RH> is evident. At [SDS] = 6 × 10⁻³ mol L-1
the distribution is wider than at smaller SDS contents and the maximum peak is shifted to the left. At [SDS] > 10-2
mol L-1 two peaks are again distinguishable but the cluster
peak is very small. The average hydrodynamic size gets smaller. These observations are in agreement with the viscosity (Figure 4a) and scattered intensity (Figure 6) behaviors.
Alhough two-exponential fits give a simplified description of the system dynamics, (see supplementary material for the analysis of the hydrodynamic radii of the fast and slow modes as a function of the surfactant concentration) their use in this study led to results similar to the Repes method, namely, in the case of bile salts, dissolution of HPC clusters below C1 and increasing hydrodynamic contribution of the free micelles at high surfactant contents.
In order to rationalize the relations between the surfactant structure and the aggregates with HPC, a brief
Figure 7. Angle dependence of the relaxation rate of the fast mode, Γ1, for 0.5% m/m HPC (up triangles) plus [SDS] = 5 × 10⁻³ mol L-1 (down
triangles), [DC] = 5 × 10⁻³ mol L-1 (circles) and [CS] = 17 × 10-3 mol L-1
(squares). NaCl 0.1 mol L-1.
Figure 8. Relaxation time distributions for the systems 0.5% m/m HPC / CS / NaCl 0.1 mol L-1; a) below C
1; b) above C1. T = 298 K. The
molecular description of the species involved may be useful. Both hydrophobic and polar portions do differ clearly between alkyl sulphate, SDS and cholesterol hydroxyl carboxylic derivatives, CS and DC (Figure 1). SDS is a linear molecule with a long flexible hydrophobic chain coupled to highly charged sulphate head, whereas CS and DC are rigid planar molecules anchored to a charged carboxylate head, with a hydrophobic steroid convex side and hydroxyl groups on concave side. The water solubility of these surfactants does reflect their hydrophilicity that follows the crescent order SDS<DC<CS. On the other hand HPC presents a semi-rigid poly(glycoside) backbone with intramolecular hydrogen bonding that is minimized by the hydroxypropyl substituents in order to enhance the polymer solubility. The semi-rigidity of HPC chain can be verified by the high value of the so-called r ratio of the radius of gyration to the hydrodynamic radius (ρ = Rg / Rh=3.0).43
All methods employed here indicated that the anionic surfactant aggregation in HPC solutions shows
dependence on surfactant structure under moderate ionic strength. The C1 crescent order SDS<DC<CS, deter-mined by fluorescent probe solubilization in the aggregate hydrophobic sites, shows that the higher the driving force to aggregate formation, the lower the aqueous solubility. However the type of interaction is not the same, since in the SDS/HPC and DC/HPC systems there is some micelle stabilization by the polymer as aggregation is anticipated (C1 < CMC), whereas in CS/HPC system occurs a slight increase from CMC to C1. It is worth noting that increasing the HPC concentration to the semidilute regime (1.2% m/m HPC) all systems follow the CS behavior resulting in C1 > CMC (Table 1), this may reflect the aggregation mechanism dependence on availability of the hydrophobic surface. In addition to solubility behavior and in agreement with an earlier study in the system SDS/ethyl(hydroxyethyl) cellulose,1 SDS can interact both with the propyl groups and
the ethylene oxide groups increasing the driving force to
Figure 9. Relaxation time distributions for the systems 0.5% m/m HPC / DC / NaCl 0.1 mol L-1; a) below C
1; b) above C1. T = 298 K. The
surfac-tant concentrations are indicated for each distribution.
Figure 10. Relaxation time distributions for the systems 0.5% m/m HPC / SDS / NaCl 0.1 mol L-1; a) above C
1; b) below C1. T = 298 K. The surfactant
aggregation as HPC decreases the critical concentration for free SDS. In the bile salts/HPC systems the interaction occurs mainly through the propyl groups, although a previous study indicates a weak interaction of these surfactants with poly(ethylene oxide) (PEO).17 The observed effects seem to
indicate that the partial polymer solubilization in the micelle palisade layer of SDS attributed for PEO1 does not occur in
the interaction of the bile salts/HPC aggregates as also observed to bile salts/PEO.17 Indeed, as mentioned before,
the palisade layer seems even to be absent in the case of bile salt aggregates. Also in agreement with the unchanged micropolarity between the free bile salts and aggregates,30,31
an alternative interaction could be the polymer adsorption on the hydrophobic exposed surfaces of the free bile salts that is about 60-80% of total hydrophobic surface.16
As can be seen by the dynamic light scattering results, the behavior of the bile salts/HPC systems seems to support the process of polymer adsorption since there is dissolution of polymer clusters already at surfactant concentrations lower than the critical aggregation concentration C1. This effect may also be interpreted as follows: at first bile salt unimers attach to the HPC chain and in a second step bile salt micelle-like aggregates further bind to it. Also at low surfactant contents (< C1) DC seems to be more effective in dissolving polymer clusters than CS (see Figures 8a and 9a) indicating that, in the presence of HPC, the hydrophobic surface is less exposed in the case of CS.
Finally, concerning the viscosity results, it is worth commenting that the lack of change in the viscosity profile of the curves (Figure 4) for bile salts/HPC systems does not exclude the interaction between these compounds. In fact, this behavior only ratifies that such interaction is weak. However, it indeed exists, as verified mainly by light scattering results. Also a similar behavior was found in another recent study.44
Conclusions
The surfactant alkylsulphate, SDS and the bile salts, CS and DC have shown different aggregate behavior in the presence of HPC at moderate ionic strength. The binding of the bile salts to HPC starts already below the critical aggregation concentration. Regarding the mechanism of aggregation, it may occur in two steps: (i) attachment of bile salt unimers to the HPC chain leading to the formation of aggregation nuclei; (ii) further binding of surfactant micelle-like aggregates on it. In addition the rigidity of both HPC and bile salts seem to play a role in order to expose the hydrophobic molecular segments responsible for the interaction.
Acknowledgments
We are grateful to Capes, CNPq, Fapergs, Propesq-UFRGS for financial support and fellowships.
Supplementary Information
Additional results obtained from two-exponential fits are available free of charge at http://jbcs.sbq.org.br, as PDF file.
References
1. Wang, G.; Olofsson, G.; J. Phys. Chem. 1995, 99, 5588. 2. Winnik, F. M.; Regismond, S. T. A.; Colloids Surf. A1996,
118, 1.
3. Singh, S. K.; Nilsson, S.; J. Colloid Interface Sci. 1999, 213, 152.
4. Illopoulos, I.; Wang, T. K.; Audebert, R.; Langmuir 1991, 7, 617.
5. Dualeh, A. J.; Steiner, C.; Macromolecules 1990, 23, 251. 6. Antunes, F. E.; Marques, E. F.; Gomes, R.; Thuresson, K.;
Lindman, B.; Miguel, M. G.; Langmuir 2004, 20, 4647. 7. Maestro, A.; González, C.; Gutiérrez, J. M.; J. Colloid Interface
Sci. 2005, 288, 597.
8. Winnik, F. M.; Langmuir 1990, 6, 522.
9. Thuresson, K.; Karlström, G.; Lindman, B.; J. Phys. Chem. 1995, 99, 3823.
10. Joabsson, F.; Rosen, O.; Thuresson, K.; Piculell, L.; Lindman, B.; J. Phys. Chem. B 1998, 102, 2954.
11. Thuresson, K.; Karlson, L.; Lindman, B.; Colloids Surf. A 2002, 201, 9.
12. Lindman, B.; Thalberg, K. In Interactions of Surfactants with Polymers and Proteins; Goddard, E.D.; Ananthapadmanabhan, K.P., eds; CRC Press: New York,1993, p. 235.
13. Anthony, O.; Zana, R.; Langmuir 1994, 10, 4048.
14. Evertsson, H.; Nilsson, S.; Carbohydr. Polym. 1998, 35,135. 15. Aoudia, M.; Zana, R.; J. Colloid Interface Sci. 1998, 206, 158. 16. Garidel, P.; Hildebrand, A.; Neubert, R.; Blume, A.; Langmuir
2000, 16, 5267.
17. Christoff, M.; da Silveira, N. P.; Samios, D.; Langmuir 2001, 17, 2885.
18. Small, D. M. In The Bile Salts; Nair, P. P.; Kritchevsky, D., eds.; Plenum Press: New York, 1971, pp. 249-256.
19. Yim, C.T.; Langmuir 1997, 13, 4383.
20. Evertsson, H.; Holmberg, C.; Colloid Polym. Sci. 1997, 275, 830.
21. Löfroth, J-E.; Johansson, L.; Norman, A.C.; Wettström, K.;
Prog. Colloid Polym. Sci. 1991, 84, 73.
22. Avranas, A.; Tasopoulos, V.; J. Colloid Interface Sci.2000,
23. Kalyanasundaram, K.; Thomas, J. K.; J. Am. Chem. Soc. 1977, 99, 2039.
24. Chu, B. In Laser Light Scattering: Applications of Photon Correlation Spectroscopy; Academic Press: London, 1991, pp. 84-134.
25. Jakes, J.; Collect. Czech. Chem. Commun. 1995, 60, 1781. 26. Schillen, K.; Brown, W.; Johnsen, R. M.; Macromolecules 1994,
27, 4825.
27. Paula, S.; Sus, W.; Tuchtenhagen, J.; Blume, A.; J. Phys. Chem. 1995, 99, 11742.
28. Persson, B.; Nilsson, S.; Sundelöf, L.-O.; Carbohydr. Polym. 1996, 29, 119.
29. Brackman, J. C.; Engberts, F. N.; Chem. Soc. Rev. 1993, 22, 85.
30. Martins, R. M.; Silva, C. A.; Becker, C.; Samios, D.; Bica, C. I. D.; Christoff, M.; Polímeros 2002, 12, 109.
31. Martins, R. M.; MSc. Dissertation, Universidade Federal do Rio Grande do Sul, Brazil, 2002.
32. Zana, R.; Guveli, D.; J. Phys. Chem. 1985, 89, 1687. 33. Drummond, C. J; Albers, S.; Furlong, D. N.; Colloids Surf. A.
1992, 62, 75.
34. Evertsson, H.; Nilsson, S.; Holmberg, C.; Sundelöf, L.-O.; Langmuir 1996, 12, 5781.
35. Holmberg, C.; Nilsson, S.; Singh, S. K.; Sundelöf, L.-O.; J. Phys. Chem. 1992, 96, 871.
36. Mya, K. Y.; Sirivat, A.; Jamieson, A. M; Macromolecules 2001, 34, 5275.
37. Suto, S.; Iwasawa, I.; J. Polym. Sci. A. 1993, 31, 1599. 38. Carlsson, A.; Karlström, G.; Lindman, B.; Stenberg, O.; Colloid
Polym. Sci. 1988, 266, 1031.
39. Karlström, G.; Carlsson, A.; Lindman, B.; J. Phys. Chem. 1990,
94, 5005.
40. Norwood, D. W.; Minatti, E.; Reed, W. F.; Macromolecules 1998, 31, 2966.
41. Schulz, L.; Seger, B.; Burchard, W.; Macromol. Chem. Phys. 2000, 201, 2008.
42. Wittgren, B.; Porsch, B.; Carbohydr. Polym. 2002, 49, 457. 43. Burchard, W.; Richtering, W.; Prog. Colloid Polym. Sci. 1989,
80, 151.
44. Martins, R. M.; Silva, C. A.; Becker, C. M.; Samios, D.; Christoff, M.; Bica, C. I. D.; Colloid Polym. Sci., in press
Received: March 2, 2006
Printed in Brazil - ©2006 Sociedade Brasileira de Química 0103 - 5053 $6.00+0.00
Supplementary Information
*e-mail: [email protected]; [email protected]
#Present addresses: Fundação Estadual de Proteção Ambiental Henrique Luis
Roessler, Rua Carlos Chagas, 55, 90030-020 Porto Alegre-RS, Brazil and Universidade Estadual do Rio Grande do Sul, Unidade Bento Gonçalves, Av. Benjamin Constant, 229, 95700-000 Bento Gonçalves-RS, Brazil.
Anionic Surfactant Aggregation with (Hydroxypropyl)cellulose in the Presence of Added Salt
Ricardo M. de Martins, Carolina A. da Silva, Cristiane M. Becker, Dimitrios Samios, Marcelo Christoff*,# and Clara I. D. Bica*
Instituto de Química, Universidade Federal do Rio Grande do Sul, Av. Bento Gonçalves, 9500, CP 15003, 91501-970 Porto Alegre-RS, Brazil
Additional results obtained from two-exponential fits
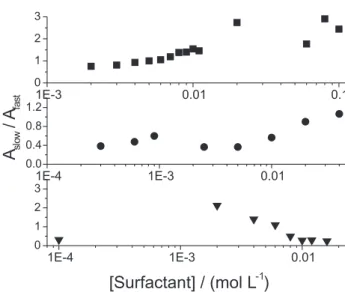
Figure S2. Ratio Aslow / Afast of the amplitudes of slow to fast correlation modes for 0.5% m/m HPC solutions as a function of the total surfactant concentration; SDS (triangles), DC (circles) CS (squares). T = 298 K; q = 90o; NaCl 0.1 mol L-1.
![Figure 5. a) Temperature dependence of scattered light intensity (I S /I M ) - -normalized by the highest intensity of each sample - 0.5% m/m of HPC (up triangles); with [SDS] = 5 × 10 -3 mol L -1 (down triangles), [DC] = 5 × 10 -3 mol L -1 (circles)](https://thumb-eu.123doks.com/thumbv2/123dok_br/18991170.460697/5.892.71.412.94.376/temperature-dependence-scattered-intensity-normalized-intensity-triangles-triangles.webp)
![Figure 10a shows that at [SDS] = 5 × 10 -4 mol L -1 the cluster peak is shifted to shorter relaxation times and increases its importance at [SDS] = 10 -3 mol L -1](https://thumb-eu.123doks.com/thumbv2/123dok_br/18991170.460697/7.892.70.407.98.390/figure-shows-cluster-shifted-shorter-relaxation-increases-importance.webp)