Prediction of Metabolic Syndrome in Children through
Anthropometric Indicators
Aparecido Pimentel Ferreira
1,2,3, Cristiane Batisti Ferreira
3, Ciro José Brito
4, Francisco José Gondim Pitanga
7,
Clayton Franco Moraes
4, Luciana Ansaneli Naves
5, Otávio de Toledo Nóbrega
5, Nancí Maria de França
4Universidade Paulista - UNIP1; Universidade Centro de Ensino Superior - UniCESP2; Universidade Planalto do Distrito Federal - UNIPLAN3; Universidade Católica de Brasília - UCB4; Universidade de Brasília - UnB, Brasília, DF5; Universidade Federal de Sergipe - UFS, Aracaju, SE6; Universidade Federal da Bahia - UFBA, Salvador, BA7 - Brazil
Mailing address: Aparecido Pimentel Ferreira •
Quadra 210, Lote 2, Edifício Cris Village, Apto 1704 - Águas Claras - 71930-750 - Brasília, DF - Brazil
E-mail: [email protected]
Manuscript received October 30, 2009; revised manuscript received August 08, 2010; accepted September 22, 2010.
Abstract
Background: Because of the need to measure anthropometric, biochemical and hemodynamic variables for the diagnosis of metabolic syndrome, we realize how difficult it is to analyze large populations, especially children, due to the poor accessibility and the invasive character. There is an urgent need to develop easy-to-use, accurate and low-cost diagnostic tools in order to predict metabolic syndrome at early ages.
Objective: To verify the prevalence of metabolic syndrome in children and to test predictive anthropometric indicators.
Methods: Cross-sectional study conducted among 109 children aged 7 to 11 years. The age-adjusted National Cholesterol Education Program definition was used for the diagnosis of metabolic syndrome. The following parameters were tested as possible predictors: body mass index (BMI), waist circumference (WC), waist-to-hip ratio (WHR), conicity index (C index), and body fat percentage.
Results: The prevalence of metabolic syndrome was 13.3% and 36% for boys and girls, respectively. The main anthropometric indicators were: BMI = 0.81 (0.69 – 0.94), WC = 0.79 (0.64 – 0.94), body fat = 0.79 (0.66 – 0.92) and WHR = 0.37 (0.21 – 0.54).
Conclusion: WC higher than 78 cm, body fat higher than 41%, and BMI higher than 24.5 kg/m² were considered predictors of metabolic syndrome. The C index and WHR were not considered predictors. (Arq Bras Cardiol 2011; 96(2): 121-125)
Keywords: Metabolic syndrome; child; prediction; overweight; obesity.
Introduction
Metabolic syndrome (MS) is a group of disorders that includes obesity, insulin resistance, high triglyceride levels, low HDL levels and hypertension. MS is notable for its association with the development of cardiovascular diseases (CVD) and type-2 diabetes mellitus (DM2)1, as well as for its high and growing prevalence in some populations2.
Given that few studies have demonstrated the overall prevalence of MS in Brazil, findings from Ferreira et al’s study3, in specific age ranges, of a 17.3% prevalence in obese children should be pointed out. Oliveira et al’s study4 showed a 30% prevalence in adults; Karnikowski et al’s study5 found a 25.6% prevalence of the syndrome among elderly individuals. However, studies on MS should give special attention to young children, because this disorder has been developing at early ages6,7.
In pediatric populations, excess body fat has shown a strong association with hypertension, dyslipidemias, insulin resistance, hyperinsulinemia and DM22,3,7. Despite the lower prevalence of CVD and MS among children, excess body fat is the most important risk factor for their occurrence. In this regard, the incidence of CVD and MS considerably increases in obese children3.
For the diagnosis of MS, it is necessary to measure anthropometric, biochemical, hemodynamic and hormonal variables, and this requires integration between the researcher and the multidisciplinary health teams. We should remember that the assessment of large populations, especially of children, is difficult because of the difficult access and the invasive character.
Based on these data, the objective of this study was to verify the prevalence of MS in children with different nutritional status and stratified by gender, as well as to identify the anthropometric indicators that are predictive of the occurrence of MS.
Methods
This study was approved by the ethics committee of Universidade Católica de Brasília (Report no. 051/2005) and by the Regional Department of Education of Taguatinga. The parents gave written informed consent for participation of their children in the study.
This is an epidemiological cross-sectional population-based study, and the confidence interval (CI) was set at 95% for public schools of the city of Taguatinga, nearby Brasília (Federal District). The schools and classes were randomly chosen, and the proportionality of students enrolled was observed.
The children were classified according to their body mass index/age (BMI/age)2. Those above the 95th percentile were considered obese; children between the 85th and 95th percentiles were classified as overweight; and those between the 5th and 75th percentiles, as normal weight.
A total of 958 children were analyzed in ten public schools; prevalences of 10.6% (n = 102) and 7.7% (n = 74) were observed for overweight and obesity, respectively, which corresponds to a frequency of 18.3% of excess-weight children. After this preliminary analysis, 109 subjects of both genders with different nutritional status and ages between 7 and 11 years were chosen to participate in the study. The number of overweight and obese participants was set according to the previously observed prevalence of these conditions in this population. Thus, a sample of 78 overweight and obese children previously selected by simple randomization using a randomization table participated in the study. For this sample, it was estimated that 71 would be an adequate number of subjects (p < 0.05) to represent the population of overweight and obese children enrolled in the public school network.
Also, a subgroup of 31 normal-weight children made up the control group for the final composition of the study sample.
A Plena scale with digital display (to the nearest 0.1 kg) and a Seca stadiometer (to the nearest 0.1 cm) were used to measure each participant’s weight and height, respectively. Waist (WC) and hip circumference (HC) were obtained using a Seca tape measure (to the nearest 0.1 cm); the waist-to-hip ratio (WHR) was calculated at a later date.
BMI was calculated by the formula weight / height2, and the conicity index, using the following mathematic equation8:
C index = Waist Circumference (m) 0.109 √Body Weight (kg) Height (m)
Body fat was measured by dual-energy X-ray absorptiometry (DXA). Whole-body analysis was carried out in a Lunar device, model DPX-IQ, software 4.6A, according to the manufacturer’s
recommendations. Relative body fat was estimated as a percentage of total body fat3.
Blood pressure was measured twice using the auscultatory method, with a Premium sphygmomanometer; the cuff size was appropriate to the arm circumference. The first reading was performed after a five-minute rest with the individual in the supine position, and the second, approximately 25 minutes after the first reading, with the individual remaining still during this period. The mean between the two readings was considered. Systolic (SBP) and diastolic blood pressures (DBP) corresponding to Korotkoff sound phases I and V were recorded.
Blood samples were drawn in the hospital of Universidade Católica de Brasília. Biochemical analyses were carried out after a 12-hour fasting. The samples were collected in non-anticoagulation gel separator vacuum tubes. For determination of cholesterol, triglyceride, high-density lipoprotein (HDL) and glucose levels, the colorimetric enzymatic kit processed in an Autohumalyzer A5 (Human, 2004) was used. The Automated Chemiluminescence System ACS-180 (Ciba-Corning Diagnostic Corp., 1995, USA) was used for insulin level determination.
Diagnosis of metabolic syndrome and cardiovascular risk factors
The modified definition by the National Cholesterol Education Programs - Adult Treatment Panel III (NCEP, 2001)8 was used for the diagnosis of MS; it consists of the presence of at least three of the following factors: obesity (characterized by abdominal obesity), dyslipidemia (high triglyceride levels or low HDL levels), hypertension and high fasting glucose levels. However, the cut-off points were adjusted to the age of the study population: triglycerides > 110 mg/dl; HDL < 38 mg/ dl; hypertension (diastolic or systolic) > age-, height- and sex-adjusted 95th percentile9. Obesity was defined by a BMI above the 95th percentile10. Insulin resistance was determined using the blood glucose homeostasis model assessment (HOMA), which is the product of fasting insulin (µIU/ml) and fasting blood glucose (mmol/l) divided by 22.511. Children with HOMA > 90th percentile were considered as insulin resistant. The presence of cardiovascular risk factors was determined according to the finding of abnormal levels of the following variables: BMI, triglycerides, HDL, blood pressure, fasting blood glucose, and insulin resistance.
Statistical analysis
The criterion used to choose the cut-off points were the values at which sensitivity and specificity were the closest and not lower than 60%12. The statistical significance of each analysis was verified by the area under the ROC curve and by the 95% confidence interval (95%CI). A perfect indicator has an area under the ROC curve of 1.00, whereas a diagonal line represents an area under the ROC curve of 0.50. For an indicator to have a significant discriminatory power, the area under the ROC curve should be between 1.00 and 0.50; the larger this area, the greater the discriminatory power of the respective indicator.
The 95% CI is another determinant of the predictive capacity. Therefore, for the anthropometric indicator studied to be considered a significant predictor of MS, the lower limit of CI (Li-CI) should not be < 0.5013. The statistical analysis of the data was carried out using the StataTM version 9.1 and SPSS 11.5 software programs13.
Results
MS was found both among boys and girls. However, in boys, there was a lower prevalence in comparison to girls, with 13.3% and 36%, respectively (p = 0.04).
A significant difference was found in the prevalence of MS when this was analyzed according to the nutritional status, since the condition was present only in obese children (23.6%; p = 0.001).
Tables 1 and 2 show the cut-off points and respective sensitivity and specificity values of the anthropometric indicators in the prediction of MS for the overall group and for the obese children, respectively.
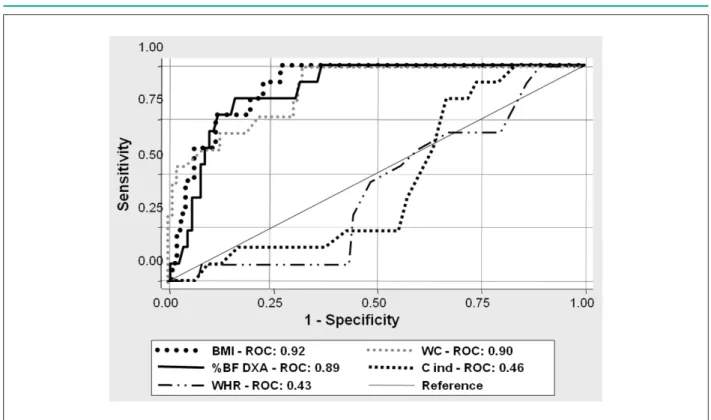
According to Tables 1 and 2, the anthropometric variables BMI, WC, and DXA were considered predictive of MS both for the overall group and for the obese group, in which the lower limit was above 0.50 (Li-CI > 0.50). WHR and conicity index, in turn, were predictive of MS only for the overall group, but not for the group of obese children, because both variables, as established in methods, did not show reliable sensitivity and specificity values (Li-CI < 0.50). Figure 113 shows the ROC curves of the variables tested in the analysis for the overall group.
Discussion
The diagnosis of MS is obtained by means of anthropometric, metabolic and hemodynamic measures. However, these are invasive measurements, especially in children. Also, the determination of biochemical variables is costly, and this impairs its use in epidemiological studies due to the risk of contamination.
The present study proposes a simple, easy-to-use and inexpensive method to be applied as a variable predictive of the diagnosis of MS. Our findings showed that simple measures such as WC and BMI had excellent sensitivity and specificity values for the prediction of MS in children.
The ability of both WC and MS as predictors of MS corroborates the strong association between body fat and the endpoint of MS, since body fat, especially abdominal fat, is related to insulin resistance and to other factors associated with MS14-18.
The analysis of WHR sensitivity and specificity showed that this variable was not predictive of MS, even when the prevalence ratio was used to calculate the risk of children classified above the previously established cut-off point and the endpoint (metabolic syndrome). Based on these data, we can say that this variable was not significant.
In another study, Ferreira et al19 verified that, among several anthropometric indicators analyzed, WHR was the one that showed the weakest correlations in comparison to the other variables considered by the World Health Organization as good indicators of body fat in children.
The conicity index predominantly measures central fat. Despite being widely used in the adult population and being strongly associated with cardiovascular diseases, it did not show good sensitivity and specificity for the prediction of MS in children. Excess abdominal fat is known to be related to metabolic disorders and to be strongly associated with MS, including in children3,20.
In the present study, the conicity index did not prove to be a good predictor of MS, despite its ability to predominantly estimate visceral fat. This is possibly due to the peculiar characteristic of the children evaluated in the present study, who were under pubertal age and, consequently, away from their peak height in comparison to the adult population, within which the variable was validated as a predictor of
Table 1 - Cut-off points and sensitivity and specificity values of the anthropometric indicators as predictors of overall metabolic syndrome
Metabolic syndrome (n = 109)
CP Sensit. Spec. AUC ( 95% CI)
BMI (kg/m²) 23.5 84.6 81.3 0.92 (0.86 - 0.97)
WC (cm) 78.0 76.9 78.1 0.89 (0.81 - 0.97)
DXA (%) 41.0 84.6 84.4 0.89 (0.81 - 0.96)
WHR (cm) 0.87 46.1 51.2 0.43 (0.28 - 0.57) Conicity
index - - - 0.46 (0.32 - 0.60)
CP - cut-off point; Sensit. - sensitivity value; Spec. - speciicity value; AUC - area under the curve; DXA - fat percentage as measured by DXA; BMI - body mass index; WC - waist circumference; WHR - waist-to-hip ratio.
Table 2 -Cut-off points and sensitivity and speciicity values of the anthropometric indicators as predictors of overall metabolic syndrome only for the group of obese children
Metabolic syndrome (n = 55)
CP Sensit. Spec. AUC (IC 95%)
BMI (kg/m²) 24.5 76.9 76.2 0.81 (0.69 - 0.94)
WC (cm) 78.7 69.2 73.8 0.79 (0.64 - 0.94)
DXA (%) 42.2 76.9 76.2 0.79 (0.66 - 0.92)
WHR (cm) 0.92 46.2 41.9 0.37 (0.21 - 0.54) Conicity
index - - - 0.43 (0.26 - 0.60)
Figure 1 -ROC curve of the anthropometric indicators as predictors of overall metabolic syndrome.
cardiovascular diseases8. Thus, two hypotheses can be made: (i) the conicity index isnot efficient to estimate visceral fat in children under pubertal age; and (ii) this index is not efficient to predict MS in the age range studied.
One of the limitations of the present study is the impossibility to extrapolate the results for the overall population, because its case series does not comprise a probabilistic sample of obese, overweight or normal-weight children. However, the authors consider that the major findings of the present study are representative of the population of obese children in Brazil, but not of the overall population of children.
Another limitation is related to the difficulty to establish a definite diagnosis of metabolic syndrome, as well as to associate anthropometric and metabolic variables of this syndrome, particularly in pediatric populations. Thus, further studies on this issue are required, particularly those in which the ethnic variability is considered. In this regard, a high genetic heterogeneity in the Brazilian population has already been verified by means of ancestry studies21.
Conclusion
Based on the results found and considering the limitations of the present study, we conclude that MS was present in
23% of the obese children, 13.3% of the boys and 36% of the girls. WC higher than 78 cm, body fat higher than 41%, and BMI higher than 24.5 kg/m² were considered predictive of metabolic syndrome. C index and WHR were not considered predictors.
Acknowledgements
Instituto Sabin and Núcleo de Apoio à Pesquisa do Laboratório Sabin.
Potential Conflict of Interest
No potential conflict of interest relevant to this article was reported.
Sources of Funding
There were no external funding sources for this study.
Study Association
References
1. Chen W, Berenson GS. Metabolic syndrome: definition and prevalence in children. J Pediatr. 2007;83(1):1-3.
2. Oliveira CL, Mello MT, Cintra IP, Fisberg M. Obesidade e síndrome metabólica na infância e adolescência. Rev Nutr Campinas. 2004;17:237-45.
4. Oliveira EP, Souza MLA, Lima MDA. Prevalência de síndrome metabólica em uma área rural do semi-árido Baiano. Arq Bras Endocrinol Metab. 2006;50(3):456-65.
3. Ferreira AP, Oliveira CE, França NM. Metabolic syndrome and risk factors for cardiovascular disease in obese children: the relationship with insulin resistance (HOMA-IR). J Pediatr. 2007;83(1):21-6.
5. Karnikowski M, Córdova C, Oliveira RJ, Karnikowski MG, Nóbrega OT. Non-alcoholic fatty liver disease and metabolic syndrome in Brazilian middle-aged and older adults. São Paulo Med J. 2007;125(6):333-7.
6. Sinaiko A. Obesity, insulin resistance and the metabolic syndrome. J Pediatr. 2007;83(1):3-5.
7. M i r a n d a P J, D e f r o n z o R A , C a l i f f R M , G u y t o n J R . M e t a b o l i c syndrome: definition, pathophysiology, and mechanisms. Am Heart J. 2005;149(1):33-45.
8. Executive Summary of the Third Report of the National Cholesterol Education Program (NCEP). Expert Panel on Detection, Evaluation and Treatment of High Blood Cholesterol in Adults (Adult Treatment Panel III). JAMA. 2001;285(19):2486-97.
9. Jessup A, Harrell JS. The metabolic syndrome: look for it in children and adolescents, too! Clinical Diabetes. 2005;23(1):26-32.
10. Department of Health amd Human Services. CDC. Table for calculated body mass index values for selected heights and weights for ages 2 to 20 years. [Access on 2009 May 10]. Available from: http://www.cdc.gov/needphp/ dnpa/healthyweight/assessing/bmy/00binaries/bmi-tables.pdf.
11. Huang TT, Johnson MS, Goran MI. Development of a prediction equation for insulin sensitivity from anthropometry and fasting insulin in prepubertal and early pubertal children. Diabetes Care. 2002;25(7):1203-10.
12. Moreira SR, Ferreira AP, Lima RM, Arsa G, Campbell CSG, Simões HG, et al. Predicting insulin resistance in children: anthropometric and metabolic indicators. J Pediatr. 2008;84(1):47-52.
13. Schisterman EF, Faraggi D, Reiser B, Trevisan M. Statistical inference for the area under the receiver operating characteristic curve in the presence of random measurement error. Am J Epidemiol. 2001;154(2):174-9.
14. Ferreira AP, Nóbrega OT, França NM. Association of body mass index and insulin resistance with metabolic syndrome in Brazilian children. Arq Bras Cardiol. 2009;93(2):147-53.
15. Weiss R, Dziura J, Burgert TS, Tamborlane W, Taksali SE, Yeckel CW, et al. Obesity and the metabolic syndrome in children and adolescents. N Engl J Med. 2004;350(23):2362-74.
16. Papadopoulou-Alataki E, Papadopoulou-Legbelou K, Doukas L, Karatzidou K, Pavlitou-Tsiontsi A, Pagkalos E. Clinical and biochemical manifestations of syndrome X in obese children. Eur J Pediatr. 2004;163(10):573-9.
17. Hirschler V, Aranda C, Calcagno Ml, Maccalini G, Jadzinsky M. Can waist circumference identify children with the metabolic syndrome? Arch Pediatr Adolesc Med. 2005;159(8):740-4.
18. Druet C, Dabbast M, Baltaskse V, Payen C, Jouret CB, Chevenne D, et al. Insulin resistance and the metabolic syndrome in obese French children. Clin Endocrinol. 2006;64(6):672-8.
19. Ferreira AP, Ferreira CB, Mota MR, Fonseca RMC, Nóbrega OT, Oliveira RJ, et al. Comparação entre o critério do CDC e outros indicativos de gordura corporal para avaliação do estado nutricional. Arq cienc saúde. 2008;15(2):75-81.
20. Sinaiko AR, Steinberger J, Moran A, Prineas RJ, Vessby B, Basu S, et al. Relation of body mass index and insulin resistance to cardiovascular risk factors, inflammatory factors, and oxidative stress during adolescence. Circulation. 2005;111(15):1985-91.