Received January 31, 2000 / Accepted May 20, 2002
FIRST RESULTS FROM MESOSPHERIC AIRGLOW
OBSERVATIONS AT 7.5° S.
1Dpto Física, CCT/UFPB
Campina Grande, PB, Brazil, 58.109-970 [email protected]
2Instituto Nacional de Pesquisas Espaciais, CEA
São José dos Campos, SP, Brazil, 12.227-010
R. A. Buriti
1, H. Takahashi
2& D. Gobbi
2The Cariri Airglow Observatory has been in operation since November, 1997. This observatory has a multi-filter photometer to measure the airglow emission intensities in the frequencies of OI557.7 nm, OI630.0 nm, NaD, OH(6,2) band, O2 Atmospheric (0-1) band , and the OH and O2 rotational temperatures. The observatory is located at São João do Cariri, State of Paraíba, one of the driest region in Northeast Brazil, situated at 7.40S, 36.50W. Day to day continuous observations (13 days around the new moon period) allow us to study nocturnal, day to day and seasonal variation of the airglow emission intensities. The nocturnal variations of the mesospheric emissions and OH(6,2) rotational temperature have shown strong seasonal dependence with maxima in equinox and minima in solstice. The OI557.7 nm presented the largest relative amplitude (0.42) whereas the rotational temperature presented the smallest relative amplitude (~0.03) and annual averages equal to 231 K. The annual averages of the intensities in OI557.7 nm, O2(0,1) and OH(6,2) were 124 R, 321 R and 1323 R, respectively. Variation of airglow intensities of 2 and 3 days were observed in OI5577 and O2(0,1).
Key words: Airglow; Photometer; Rotational temperature.
PRIMEIROS RESULTADOS DAS OBSERVAÇÕES DE AIRGLOW DA MESOSFERA EM 7,50S - O Observatório de airglow do Cariri tem feito observações rotineiras desde novembro de 1997. Ele conta com um fotômetro multicanal destinado a medir as intensidades do airglow nas freqüências de OI557,7 nm, OI630,0 nm, NaD e também a intensidade do airglow das moléculas do OH(6,2) e do O2(0-1) atmosférico, além das suas respectivas temperaturas rotacionais. O Observatório está localizado na cidade de São João do Cariri (7.40S, 36.50W), estado da Paraíba, cuja região é considerada a mais seca do Brasil. Observações contínuas (13 dias em torno da lua nova) permitem estudar variações noturnas, dia a dia e sazonais do airglow. As variações noturnas das emissões do airglow mesosférico da temperatura rotacional do OH(6,2) mostraram forte dependência sazonal, com máximos durante os equinócios e mínimos nos solstícios. A maior amplitude relativa observada foi da intensidade do OI557,7 nm (0,42) enquanto que a da temperatura rotacional foi de 0,03 com média anual igual a 231 K. A intensidade média anual do OI557,7 nm, O2(0,1) e OH(6,2) foi de 124 R, 321 R e 1323 R, respectivamente. Variação de 2 e 3 dias foi observado no IO5577 e O2(0,1).
carrying out airglow observation in the equatorial zone is one of the reasons for the lack of data.
A new airglow observation site in the equatorial zone was set up at São João do Cariri (Paraíba State) where a multi-filter airglow photometer was installed, measuring the atomic oxygen emissions, OI 557.7 nm green line and OI630.0 nm red line, molecular oxygen O2 atmospheric (0-1) band, sodium (NaD), and hydroxyl OH (6,2) band emissions. The rotational temperature of OH(6,2) and O2(0-1) were also obtained from their rotational spectra. The purpose of the present work is to present and discuss preliminary mesospheric airglow data carried out in 1998.
THE SITE
The observation site was set up within the area of the meteorological station of the Federal University of Paraiba, UFPB, at São João do Cariri (7023' S, 36032'
W), located in Northeast Brazil. It is a small city with a population of around 4,000, and thus has a small citylight effect in airglow observations. The city is located at an altitude of 500 m above sea level and the local climate is very dry, around 20-35% in humidity at 3 o’clock pm during the summer season. Because this region is considered one of the driest place in Brazil, the presence of clouds is very rare at night, which provides good observational conditions. The nearest larger city (Campina Grande with a population of 300 thousand) is 80 km from the observatory. The airglow observation instruments are installed inside a container of 2 x 3.5 m2 dimensions, with air conditions controlled by an air
conditioning system. There are two roof windows to look up the night sky.
1989). A PC type personal computer is used to control the Multi-3, and to process the data, calculating intensity and temperature on real time.
OBSERVATION
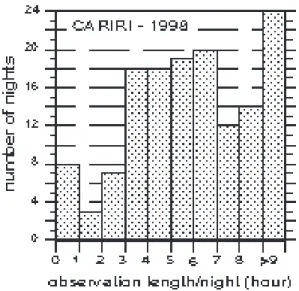
Airglow observations started at Cariri in November, 1997. In 1998 the rain precipitation at Cariri region was about 130 mm, possibly because of the El Nino phenomenon. Consequently, many nights with good airglow observations conditions were obtained. The observations were carried out for 13 days a month during the new moon period. Fig. 1 shows a histogram
Figure 1 - Histogram of number of night observations in 1998 versus the observation length per night in hours.
of the number of nights of observations as a function of the length of the data run in hours. According to this figure, most of the night presented temporal data more than 3 hours. In total, 143 nights of observations were chosen for the present work. Although the Multi-3 has measured the NaD line and the rotational temperature of O2(0-1), they were not included in this work.
Seasonal variations
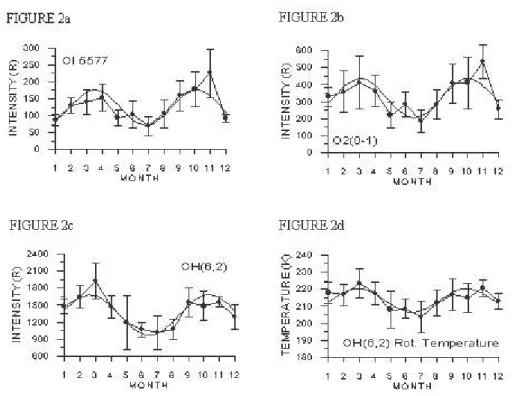
The monthly averaged airglow intensities and rotational temperature were calculated considering every good data set from each period of observation. They presented a strong seasonal variation for all of the parameters measured. The results are shown in Fig. 2. They have a minimum in June/July and maxima in the equinoxes. The fitting curve, which represents the principal period, obtained by least mean square, is plotted for the respective parameter.
OI5577 and O2A(0-1) Airglow Intensity: The atomic oxygen green line (OI557.7 nm) comes from two emission layers, one from the ionospheric F2 layer (nearby 250 km) and the other from the upper mesosphere (around 97 km). In Fig. 2a only the mesospheric component of the OI557.7 nm emission intensity - hereafter OI5577 - is plotted. In order to subtract the F region OI5577 component, we assumed that it is equivalent to 20 % of the OI6300 intensity (Silverman, 1970), both observed simultaneously. Takahashi et al. (1990) obtained a value of 17% for equatorial region from rocket data. Fagundes et al.
(1995) obtained a value of ~26% using OI6300 and OI557.7 nm data intensity from C. Paulista (230S,
450W). The values of OI630 nm intensity, observed in
Cariri in 1998, varied from 20 to 505 R with an annual mean of 168.9 ± 108.9 R. According to these values, the OI5577 from F-region varied from 4 to 101 R.
The mesospheric OI5577 showed semi-annual oscillation, maxima in April and October/November, minima in July and December/January. It is worthwhile to note that the intensity of OI5577 decreased from November (230 R) to December (80 R) was sudden and large. Clemesha et al. (1992) observed a similar behavior to OI5577 and OH(9,4) intensities and a depletion in NaD emission in November at C. Paulista. They attributed these effects to a vertical wind in the lower thermosphere resulting in increase atomic oxygen at emissions heights.
In order to obtain the airglow intensity of O2(0-1) - hereafter IO2 - the peak (8660 •) and the center (8680 •) of the P+Q branches intensities were observed, besides the corresponding background. Similar seasonal variation can be seen for the O2(0-1) band emission intensity (Fig. 2b), although the relative amplitude of oscillation is smaller than OI5577. Such drastic change, from October to December, must be generated by sudden change of the atomic oxygen concentration and/or the emission height change suggested by Ward et al. (1997). Further investigation would be necessary in order to clarify the phenomenon. OH(6,2) Emission Intensity and Rotational Temperature: The emission intensity of OH(6,2)
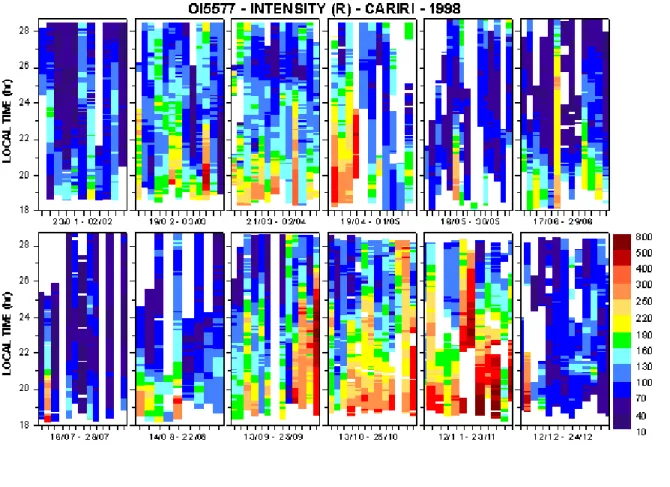
the figure, each tick at the abscissas means a specific night of each period of observation. The labels below the abscissas represent the beginning and the end day of each period. The ordinate represents local time; “26”, for example, means 2 am of the next day. The color scale represents the intensity and the temperature levels. The white blocks indicate no data measured.
It was not applied any kind of smoothing process to the data set, such as running average. However,
and quickly decreased to the end of the night. Some nights showed an increase after 2 am (or 26 h). In October and November, some nights presented a large intensity during whole the night.
IO2: The Fig. 3b shows the contour plot of IO2. It is possible to note that the intensity was higher in March and September and lower in the winter and summer solstices. It is worth to observe that, in June, the IO2 increased its value at each 4 days. In general, the
Figure 2a-d - Monthly mean values of the airglow intensities and temperature observed at Cariri in 1998. Seasonal variations are easily noted. The bars represent the standard deviation.
(a)
(b)
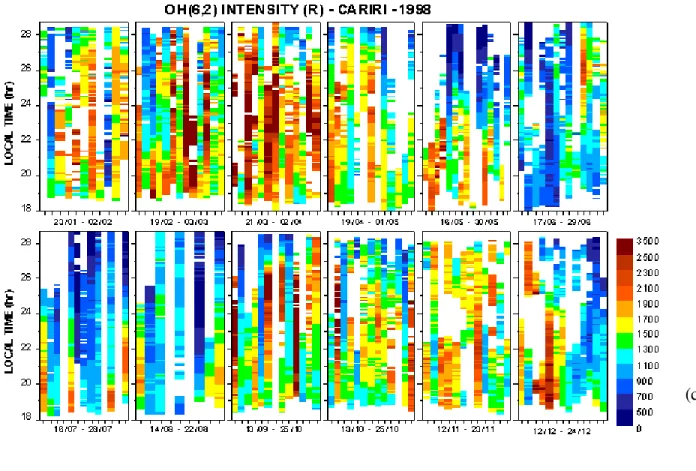
Figura 3 - Intensidades do airglow do a) OI5577, b) O2(0-1), c) OH(6,2) e d) temperatura rotacional do OH(6,2) observadas no Cariri em 1998. Os números abaixo de cada abscissa indicam o dia e o mês relativo ao início e ao término do período observado. A ordenada representa a hora local; “25 h”, por exemplo, significa 1 hora da manhã do dia seguinte e assim por diante. Os espaços em branco indicam ausência de dados.
(c)
intensity decreased after midnight. The number of data in November is reduced, due to the fact that the filter change mechanism for the Filter 5 was in trouble after November 17.
IOH and TOH: In contrast to OI5577, the contour plot of the OH (6,2) band emission intensity and rotational temperature, shown in Fig. 3c and 3d, included more blank blocks in it. This is because the observations of IOH and IO2 were high sensitive to the presence of clouds, as thin as possible. From this figure, nevertheless, the IOH presented a semi-annual variation, high values during the equinoxes and lower in the June/July solstice. March was the only month that the IOH presented its intensity around 2000 R during whole course of the night.
The variation of TOH, shown in the Fig. 3d, is similar to IOH, also showing a semi-annual variation. March presents the higher temperatures, over 220 K. On the other hand, June and July are the months that the temperature is below 210 K. The amplitude of variation reached up to 8% of the mean values in May and July. The other months present small variation around the mean values. As the case of IOH, the nocturnal variation of the TOH presented, in general, large values in dusk.
DISCUSSION
The observed airglow intensities in the present work clearly showed a quasi-semi-annual oscillation. Cogger et al. (1981) studied seasonal variation using satellite data and concluded that the amplitude of the semi-annual oscillation of OI5577 rises towards higher latitude. Garcia & Solomon (1985) predicted that the amplitude decreases towards the equatorial region. Takahashi et al. (1995) observed strong seasonal variation of OI5577, OH(9,4) and TOH(9,4) from 40S
and from 230S. They concluded that the semi-annual
oscillations in 230S are smaller than 40S.
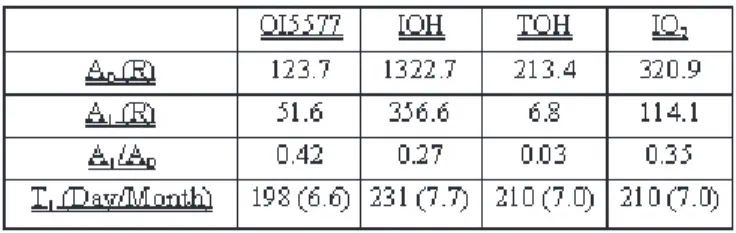
The relative amplitudes of oscillation of the observed emissions and temperature (A1/A0), are summarized in Tab. 2. A0 represents the annual mean intensity and A1 is the intensity amplitude of the principal period obtained by Maximum Entropy Method (Anderson, 1974). As it was already shown in Fig. 2a, the OI5577 had the largest amplitude of oscillation compared to the other emissions. The TOH presented the smallest relative variation, being 0.03.
The data analysis shows that the variation is quasi-semi-annual. These periods and amplitudes were obtained by the Maximum Entropy Method (MEM). It is important to note that there is an error in the period. When we plot the average of each month, we did not make any mention to the beginning day and to the end day of each period of observation. For example, the month #1 is relative to observation between 21 January and 2 February and the month #12 is relative to the period between 12 and 24 December. All parameters analysed present period between 165 and 210 days.
The variation in OI5577, IOH and IO2 can be attributed mainly to the vertical movement of the atomic oxygen layer according to the seasonal period. Naturally, this movement makes the concentration of atomic oxygen change and consequently the airglow submitted to this long variation also. A continuous decrease of OI5577 from dusk to midnight and after increase towards dawn can be seen in Fig. 3a. This behavior has been explained by Moreels et al. (1974) as the result of less vertical mixing in equatorial regions resulting in no intensity increase in the OH intensity. This can be confirmed when we compare Fig. 3a and Fig. 3c. While the IO5577 increases after 26 hr, the IOH decreases. It is easy to see this behavior in March, May, September and October. This same behavior is valid to IO2 .
The OI5577 shows variations of 3-5 days from dusk to midnight from February to July. This variation can be noted in IO2 (Fig. 3b) from February to June,
Table 2 - Annual mean (a0), amplitude of the semiannual component (a1) and period of oscillation (t1) in day (month).
of strong quasi-semi-annual oscillation for the mesospheric airglow emission intensities and temperature. Periods of 6.6 to 7 months were observed. There is a sudden intensity decrease in the OI5577 and O2 band emissions from November to December. The large number of data permitted to make the plot contour of the OI5577, OH(6,2), O2 emissions and OH rotational temperature for every period of observation, which allows to study long term variations of the airglow.
ACKNOWLEDGMENTS
We are most grateful to Mr. Augusto Souza and Eng. Meinardo Costa for operation and technical assistance of Multi-3 photometer. The Cariri Observatory is supported by Universidade Federal da Paraiba (UFPB), Instituto Nacional Pesquisas Espaciais (INPE) and São João do Cariri Prefecture to whom we acknowledge. The present work is partially supported by Pronex No. 76.97.1079.00.
REFERENCES
Anderson, N., 1974. On the calculation of filter
coefficients for maximum entropy spectral analysis. Geophys., 39, pp. 69-72.
Brenton, J.G. & Silverman, S.M., 1970. A study
of the diurnal variations of the 5577• [OI] airglow emission at selected IGY stations. Planet. Space. Sci.,18, 641.
Clemesha, R. B.; Simonich, D. M.; Takahashi, H.;
Batista, P. P. & Sahai, Y., 1992. The annual
variation of the height of the atmospheric sodium layer at 230 S: possible evidence for convective transport. J. Geophys. Res., 97, D5, pp. 5981-5985.
Moreels, G., Gattinger, R.L. & Jones, A.V., 1974. Diurnal, Annual and Solar Cycle Variations of Hydroxyl and Sodium Nightglow Intensities in the Europe-Africa Sector. Planet. Space Sci., 22, 344.
Silverman, S.M., 1970. Night airglow
phenomenology. Space Sci. Rer., 11, 341. Takahashi, H., Sahay, Y., Clemesha, B. R.,
Simonich, D.M., Teixeira, N.R., Lobo, R. M.
& Eras, A., 1989. Equatorial mesospheric and
F-region airglow emissions observed from latitude 4 South. Planet. Space Sci. 37(6), 649-655. Takahashi, H., Clemesha, R. B., Sahai, Y., Batista,
P. P., Abdu, M. A. & Muralikrishna, P., 1990. Equatorial F--region OI6300• and OI5577• emission profiles observed by rocket-borne airglow photometers. Planet. Space Sci. 38(6), 547. Takahashi, H., Clemesha, B. R. & Batista, P.P.,
1995. Predominant semi-annual oscillation of the
upper mesospheric airglow intensities and temperatures in the equatorial region. J. Atmos. Terr. Phys., 57, 407-414.
Takahashi, H., Gobbi, D., Batista, P.P., Melo, S.M.L., Teixeira, N.R. & Buriti, R. A., 1998. Dynamical Influence on the Equatorial Airglow Observed from the South American Sector. Adv. Space Sci. Vol. 21, No. 6, pp. 817-825.
Ward, W.E., Solheim, B.H. & Shepherd, G.G.,
1997. Two-day wave induced variations in the
oxygen green line volume emission rate: WINDII observations. Geophys. Res. Lett., 24 (9), 1127-1130.